Discontinuous transition in an equilibrium percolation model with suppression
Abstract
Discontinuous transition is observed in the equilibrium cluster properties of a percolation model with suppressed cluster growth as the growth parameter is tuned to the critical threshold at sufficiently low initial seed concentration in contrast to the previously reported results on non-equilibrium growth models. In the present model, the growth process follows all the criteria of the original percolation model except continuously updated occupation probability of the lattice sites that suppresses the growth of a cluster according to its size. As varied from higher values to smaller values, a line of continuous transition points encounters a coexistence region of spanning and non-spanning large clusters. At sufficiently small values of (), the growth parameter exceeds the usual percolation threshold and generates compact spanning clusters leading to discontinuous transitions.
pacs:
64.60.ah 05.70.Fh 64.60.DeRecently, percolation transition (PT) has been reported as a first order discontinuous transition in a model of explosive percolation (EP) by Achlioptas et al AP . However, percolation is well known as a model of second order continuous phase transition (CPT) and widely applied in a variety of problems ranging from sol-gel to metal insulator transition stauffer ; bunde ; grimmett ; sahimi . Instead of the original equilibrium percolation model, a series of non-equilibrium growth models epj223 then proposed to demonstrate first order PT. In these models, imposing the product (or sum) rule to occupy a bond in growing a cluster, a discontinuous jump in the size of the largest cluster at a delayed percolation threshold is characterized as discontinuous phase transition (DPT). However, soon a controversy that the EP is a DPT or not erupts on the basis of slow convergence of asymptotic cluster properties in the limit costa ; rio ; fried . For example, some of the Euclidean lattice models ziff ; arg2 of EP were found inconclusive in their nature of transition grass ; unsul . In the spanning cluster avoiding (SCA) model of EP, it was claimed that there exists an upper critical dimension below which the transitions will be discontinuous avd though in this model the transition occurs at unit probability, a trivial percolation threshold. A few growth models kim ; herr1 ; herr2 ; manna ; bfwm in Euclidean space, however, are found to display first order DPT. It seems beside CPT and true first order DPT there exists a mixed DPT in which characteristics of both first order and second order transitions appear tric ; radi and the system possess unusual finite size scaling (FSS) hyb . In most of the cases, except the jump in the order parameter the other aspects of first order transition such as phase co-existence, nucleation, etc. are ignored grass ; janssen . More importantly, not only the understanding of the origin of DPT remains incomplete but also it is not yet demonstrated in the context of equilibrium percolation model.
In this letter, we propose a two parameter equilibrium percolation model keeping nucelation and growth as the main ingredient. The parameters are the initial seed concentration and a growth parameter . The model displays CPT, mixed DPT and finally true first order DPT at suitable range of parameter values. The DPT in this model is not only characterized by the jump in the order parameter but also supported by the presence of phase co-existence. The model not only distinguishes clearly the features of different PTs but also captures most of the essential features of several different EP models.
The model is developed on a -dimensional (d) square lattice of size occupying the lattice sites randomly with an initial seed concentration . Clusters of occupied sites, connected by nearest neighbor (NN) bonds, are formed. The initial cluster size distribution is determined identifying the clusters by Hoshen-Kopelman algorithm HK . The clusters are then arranged in an ascending order according to their sizes . These finite clusters are then grown sequentially starting from the smallest cluster with a size dependent probability. At a Monte Carlo (MC) time step , the growth probability of a cluster of size is given by
| (1) |
where the growth parameter is a constant between and is the size of the largest cluster present at that time. At any time , the value of is the smallest () for the largest cluster and it is largest () for the smallest cluster (). Accordingly, the model is called suppressed cluster growth percolation (SCGP) which is quite different from the controlled largest cluster growth model of EP herr1 . In a single MC step, only a single layer of empty NN perimeter (both internal and external) sites of a cluster are occupied with its growth probability . Once a site is rejected with probability , the site remains unoccupied throughout the growth process as in the original percolation model (OPM) and which is not the case in most of the EP models. An empty lattice site may be a common NN site of more than one cluster. Since we occupy the empty sites of the smallest cluster first, the status of occupation or rejection of such sites cannot be altered in future at the time of growth of the other clusters of higher sizes if they are encountered as their neighbors. As soon as all the clusters present at that time are allowed to grow one layer of NN perimeter sites, MC time step is increased by one. During a MC step, some of the isolated clusters may found in contact with each other at the end of one layer growth. Clusters found in contact are merged together, its size is relabeled and the cluster size distribution is updated. The growth probability is re-calculated after every update of cluster size distribution and second layer of growth starts. The growth process stops when no empty site on the perimeter of any of the clusters is available to occupy. In this model, even if all the clusters in the whole lattice merged to a single large cluster, the growth of the largest cluster will not be seized. The final equilibrium cluster size distribution is collected at the end of the growth process and used to analyze PT.
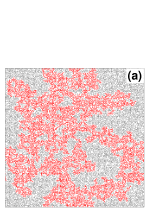
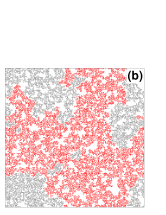
Extensive computer simulation has been performed for different values of from to taking . Though has a trivial upper limit, the percolation threshold, the lower limit should be chosen in such a way that the system has sufficient number of growth centers. The system is then studied varying for a given and . Clusters are grown applying periodic boundary condition (PBC) in both the horizontal and the vertical directions. Ensemble average is made on random initial configurations for each and on a given . Typical cluster configurations for and at their respective thresholds on a lattice of are shown in Fig. 1. The morphology of the spanning clusters (in red) are very different for s. For , most of the lattice sites are found occupied at the end of the growth process, several finite clusters (in gray) of many different sizes are found within the spanning cluster as in the OPM. Whereas for , a large number of lattice sites remain unoccupied as excluded area, almost no finite cluster is found inside the spanning cluster as it is observed in percolation of active gels enclv . The spanning cluster at a smaller looks more compact than that at a higher .
PT in SCGP is characterized by the properties of the final equilibrium spanning/large clusters. The order parameter, the probability to find a lattice site in the spanning cluster, is defined as , where is the size of the spanning cluster. The FSS form of is then expected to be
| (2) |
where is the critical value of growth parameter at which the PT occurs. The average value of at the threshold scales as , where is the fractal dimension of the spanning cluster. Following the formalism of analyzing thermal critical phenomena binder ; bruce , the distribution of is taken as
| (3) |
where is a universal scaling function. Such a distribution function of is also used in the context of PT recently grass . With such scaling form of distribution, one could easily show that as well as scale as . The susceptibility is defined in terms of the fluctuation in as
| (4) |
Following the hyper-scaling relation , the FSS form of is obtained as
| (5) |
where is the scaling function. Studying FSS of and its fluctuation , the critical thresholds are identified and the values of , are estimated. The order of transition is verified by estimating higher order Binder cumulant (BC) kbinder ; botet . Below we present data for two extreme values of , and , and we comment on data for the intermediate range of .
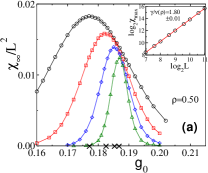
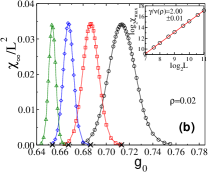
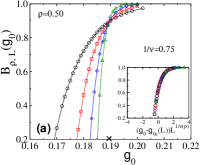
In Fig. 2, is plotted against for two different values of : (a) and (b). As expected, is found to have a maximum for a particular value of for a given . The positions of these maxima correspond to the percolation thresholds in this model and are marked by crosses on the axis. For and , it is found that which is higher than of OPM, the critical occupation probability for growing the percolation clusters from a single seed following Leath algorithm LH , as it happens in most of the EP growth models AP ; ziff ; tric . Note that, the threshold here is a non-trivial finite value in contrast to the trivial threshold value in SCA avd . As in the case of explosive electric breakdown model electric , the values of are found to decrease with increasing for . The maximum values of the susceptibility are expected to follow a scaling relation . Values of for different at their respective are plotted against in the insets of Fig. 2(a) and (b) for and respectively. By linear least square fit to the data points, the values of are extracted. For , it is found that , that of the OPM ( stauffer ) within error bar. The value of remains unaltered within for . Hence, the transitions for belong to the same universality class of OPM. Whereas for , is found herr1 ; bfwm as it occurs in a first order DPT. The value of is also found to occur for within error bar. In the intermediate region , the value of is found to decrease continuously from to as changes from to . Such continuously varying exponents are also observed in a hybrid PT model hyb ; prl116 . To confirm the nature of PT in
SCGP, the th order BC
| (6) |
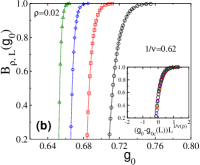
is studied. In Fig. 3, is plotted against for different for (a) and (b). For , the plots of for different cross at a point corresponding to the critical percolation threshold of SCGP, as it occurs for a CPT. Such crossing of BCs are also observed for . For , however, no such crossing of BCs for different is found to occur as expected in first order transitions. Non-crossing of BCs are also observed for . In the intermediate region , BCs cross over a range of values indicating no precise crossover value. The FSS form of BC, , where is a scaling function is verified in the insets of Fig. 3, plotting BC against . To obtain a reasonable data collapse, the value of is tuned manually to for and to for with their respective values of . Knowing the values of and , the FSS form of is also verified.
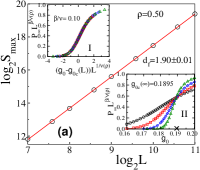
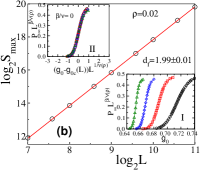
The compactness of the spanning cluster is measured by plotting against for and in Figs. 4(a) and (b) respectively. By linear least square fit through the data points in double logarithmic scale, the fractal dimensions are obtained as , as that of OPM, for whereas , as that of space dimension , for . The values of for both and are found to be the expected one within error. For , the growth parameter exceeds of OPM and consequently the initial small finite clusters grow as compact clusters. The compact spanning cluster at smaller emerges due to the merging of these compact finite clusters. Such growth of a macroscopic cluster due to nucleation of small finite clusters is an essential feature of first order DPT. In the intermediate region , the value of is found changing continuously with . Since , one has for and for . The values of are verified studying the variation of against . In the inset-I of Fig. 4(a) and (b), are plotted against for and taking their respective values of . For , a crossing point (as appeared in the plots of BC) among the plots for different is found to appear whereas for no such crossing point is observed. Furthermore, for , becomes steeper and steeper as increases. Such steeper increase in is also noted in several other models of EP bfwm . The collapse of is verified by plotting vs in the inset-II of Fig. 4(a) for and in Fig. 4(b) for taking respective values of and . Thus, at higher , follows usual FSS of OPM whereas at smaller its scaling becomes independent of . For , unusual scaling of is found to occur. It is important to note that no DPT occurs in a similar two parameter model of random cluster growth without suppression in growing the clusters santra , which represents CPT for the whole range of .
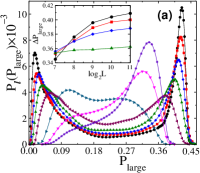
To realize the presence of co-existing phases in SCGP, an ensemble of large clusters, the spanning or the largest if no spanning cluster appears, at are generated. The probability to find a lattice site in a largest cluster of size is . The distribution of is expected to be
| (7) |
where is a scaling function. In Fig. 5(a), the distribution , interpolated through equally spaced bins of data points, are plotted against for a wide range of . Whenever there is a crossing point in the BCs, the distributions are obtained at corresponding to that crossing otherwise they are obtained at . For , not only the distributions are found single-humped but also the scaled distributions collapse onto a single curve when plotted against . The transitions in this region are thus CPT which follow usual percolation scaling. On the other hand, for , the distributions are found double-humped bimodal distributions as it appears in thermal phase transitions bruce1 and also reported in some of the EP models grass ; manna1 ; tian ; marco . The appearance of bimodal distribution indicates the coexistence of the spanning cluster with the large (non-spanning) clusters. No suitable scaling exponent is found to collapse either of the humps of these bimodal distributions. The heights of the humps are found increasing with for a given . Though a leftward shift of the distributions is found to occur with , the hump to hump separation is found either constant or increasing with as shown in the inset of Fig. 5(a) for different values of , as in some of the EP models electric ; manna1 . It is important to note that is also increasing with decreasing for a large making the jump more drastic in the dilute limit of . Not only the compact spanning clusters appear in this region due to nucleation of finite compact clusters but also the number of clusters merged to form the spanning cluster become non-extensive with . All these features provide a strong evidence of true first order DPT. For , becomes broader as well as double humps start developing and becomes prominent as decreases. Thus, in this region, the model exhibits non-universal critical behavior accompanied by unusual FSS beside a finite jump in the order parameter like mixed DPT in some of the EP models prl116 . However, is found to decrease with in the intermediate region of . Thus the apparent DPT in this region may disappear in limit and one may find the line of CPT is extended further down to lower values of . In Fig. 5(b), a phase diagram for SCGP is presented in the parameter plane for where is the critical area fraction of spanning (or largest) cluster, the mean value of distribution in the case of a single hump otherwise the hump positions. Though the boundaries of the regions are not sharp, it can be seen that a line of second order transition (for ) bifurcates at a tricritical point into two lines of first order transitions (for ) enclosing a coexistence region which ultimately represent true first order DPT for . The existence of a tricritical point is also observed in a growth model with modified product rule incorporating a dilution parameter tric .

In conclusion, an equilibrium SCGP with two parameters is developed which clearly distinguishes CPT, DPT and mixed DPT in one of its phase plane. The usual equilibrium spanning cluster approach demonstrates CPT for and strong first order DPT for . The CPTs are found to belong to the same universality class of OPM. The DPT, however, is characterized by a discontinuous jump in the order parameter, coexistence of spanning and non-spanning large clusters and appearance of compact spanning cluster. A compact spanning cluster in this region is an outcome of merging of the compact finite clusters that were grown with high . The region of coexistence is found to be confined within a double-humped bimodal distribution of the order parameter. In the intermediate range of , the nature of PT still remains inconclusive as characteristic features of both CPT and DPT appear concurrently and can only be resolved in true thermodynamic limit.
References
- (1) D. Achlioptas, R. M. D’Souza, and J. Spencer, Science 323, 1453 (2009).
- (2) D. Stauffer and A. Aharony, Introduction to Percolation Theory, Taylor and Francis, London, (1994).
- (3) A. Bunde and S. Havlin, eds Fractals and Disordered systems, Springer-Verlag, Berlin, (1996).
- (4) G. Grimmett, Percolation, Springer (1999).
- (5) M. Sahimi, Applications of Percolation Theory, (Taylor & Francis, London) (1994).
- (6) N. Araújo, P. Grassberger, B. Kahng, K. J. Schrenk, and R. M. Ziff, Eur. Phys. J. Special Topics 223, 2307 (2014) and references therein.
- (7) R. A. da Costa, S. N. Dorogovtsev, A. V. Goltsev, and J. F. F. Mendes, Phys. Rev. Lett. 105, 255701 (2010).
- (8) O. Riordan and L. Warnke, Science 333, 322 (2011).
- (9) E. J. Friedman and A. S. Landsberg, Phys. Rev. Lett. 103, 255701 (2009).
- (10) R. M. Ziff, Phys. Rev. Lett. 103, 045701 (2009); Phys. Rev. E 82, 051105 (2010).
- (11) N. Bastas, K. Kosmidis, and P. Argyrakis, Phys. Rev. E 84, 066112 (2011).
- (12) P. Grassberger, C. Christensen, G. Bizhani, S.-W. Son, and M. Paczuski, Phys. Rev. Lett. 106, 225701 (2011).
- (13) N. Bastas, P. Giazitzidis, M. Maragakis, K. Kosmidis, Physica A, 407 54-65 (2014).
- (14) Y. S. Cho, S. Hwang, H. J. Herrmann, B. Kahng, Science 339, 1185 (2013).
- (15) Y. Kim, Y. K. Yun, and S.-H. Yook, Phys. Rev. E 82, 061105 (2010).
- (16) N. A. M. Araújo and H. J. Herrmann, Phys. Rev. Lett. 105, 035701 (2010).
- (17) K. J. Schrenk, N. A. M. Araújo and H. J. Herrmann, Phys. Rev. E 84, 041136 (2011).
- (18) S. S. Manna and A. Chatterjee, Physica A 390, 177 (2011).
- (19) K. J. Schrenk, A. Felder, S. Deflorin, N. A. M. Araujo, R. M. D’Souza and H. J. Herrmann, Phys. Rev. E 85, 031103 (2012).
- (20) N. A. M. Araújo, J. S. Andrade Jr., R. M. Ziff, and H. J. Herrmann, Phys. Rev. Lett. 106, 095703 (2011).
- (21) F. Radicchi and S. Fortunato, Phys.Rev.E 81, 036110 (2010).
- (22) W. Chen, J. Nagler, X. Cheng, X. Jin, H. Shen, Z. Zheng, and R. M. D’Souza, Phys. Rev. E 87, 052130 (2013).
- (23) H-K Janssen and O Stenull, EPL, 113, (2016), 26005.
- (24) J. Hoshen and R. Kopelman, Phys. Rev. B 14, 8 (1976).
- (25) M. Sheinman, A. Sharma, J. Alvarado, G. H. Koenderink, and F. C. MacKintosh, Phys. Rev. Lett. 114, 098104 (2015).
- (26) K. Binder, Z. Phys. B 43, 119 (1981).
- (27) A.D. Bruce, J. Phys. C 14, 3667 (1981).
- (28) K. Binder, Rep. Prog. Phys. 60, 487 (1997).
- (29) A. Hasmy, R. Paredes, O Sonneville-Aubrun, B. Cabane, and R. Botet, Phys. Rev. Lett. 82, 3368 (1999).
- (30) P.L. Leath, Phys. Rev. B 14, 5046 (1976).
- (31) C. L. N. Oliveira, N. A. M. Araújo, J. S. Andrade Jr., and H. J. Herrmann, Phys. Rev. Lett. 113, 155701 (2014).
- (32) Y. S. Cho, J. S. Lee, H. J. Herrmann, and B. Kahng, Phys. Rev. Lett. 116 025701 (2016)
- (33) B. Roy and S. B. Santra, Croat. Chem. Acta. 86, 495 (2013).
- (34) A. D. Bruce, and N. B. Wilding, Phys. Rev. Lett. 68, 193 (1992).
- (35) S. S. Manna, Physica A 391, 2833 (2012).
- (36) L. Tian, and D.-N. Shi, Phys. Lett. A 376, 286 (2012).
- (37) M. Mueller, W. Janke, and D. A. Johnston, Phys. Rev. Lett. 112, 200601 (2014).