X-RAY FLASHES IN RECURRENT NOVAE:
M31N 2008-12a
AND THE IMPLICATIONS OF THE Swift NON-DETECTION
Abstract
Models of nova outbursts suggest that an X-ray flash should occur just after hydrogen ignition. However, this X-ray flash has never been observationally confirmed. We present four theoretical light curves of the X-ray flash for two very massive white dwarfs (WDs) of 1.380 and 1.385 and for two recurrence periods of 0.5 and 1 years. The duration of the X-ray flash is shorter for a more massive WD and for a longer recurrence period. The shortest duration of 14 hours (0.6 days) among the four cases is obtained for the WD with one year recurrence period. In general, a nova explosion is relatively weak for a very short recurrence period, which results in a rather slow evolution toward the optical peak. This slow timescale and the predictability of very short recurrence period novae give us a chance to observe X-ray flashes of recurrent novae. In this context, we report the first attempt, using the Swift observatory, to detect an X-ray flash of the recurrent nova M31N 2008-12a (0.5 or 1 year recurrence period), which resulted in the non-detection of X-ray emission during the period of 8 days before the optical detection. We discuss the impact of these observations on nova outburst theory. The X-ray flash is one of the last frontiers of nova studies and its detection is essentially important to understand the pre-optical-maximum phase. We encourage further observations.
Subject headings:
nova, cataclysmic variables – stars: individual (M31N 2008-12a) – white dwarfs – X-rays: binaries1. INTRODUCTION
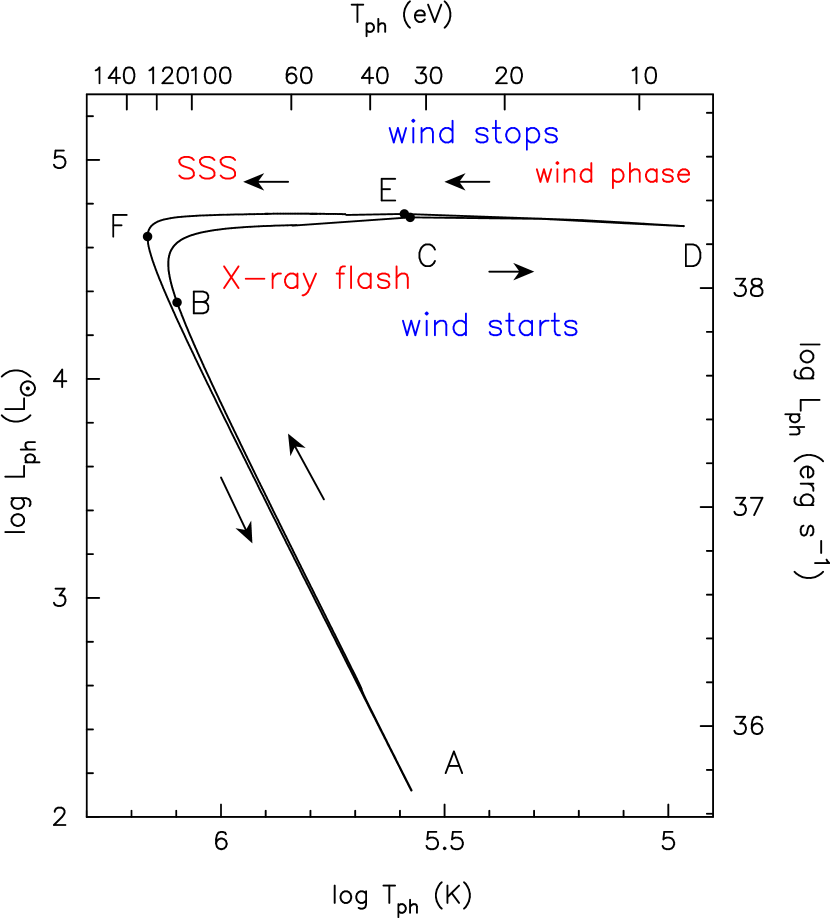
A nova is a thermonuclear runaway event that occurs on an accreting white dwarf (WD) (e.g., Iben, 1982; José et al., 1993; Nariai et al., 1980; Prialnik & Kovetz, 1995; Starrfield et al., 1974). Figure 1 shows a schematic HR diagram for one cycle of a nova outburst on a very massive WD. The thermonuclear runaway of hydrogen sets in on an accreting WD at point A. The luminosity increases toward point B at which the nuclear luminosity () reaches its maximum. After that, the envelope on the WD greatly expands and reaches point D (the maximum expansion of the photosphere: corresponding to the optical peak). An optically thick wind begins to blow at point C and continues until point E through D. A part of the envelope mass is lost in the wind. From point C to E, the hydrogen-rich envelope mass decreases owing to wind mass loss and nuclear burning. After point E, it decreases owing to hydrogen burning. The hydrogen burning extinguishes at point F.
The decay phase of optical and near-infrared (NIR) light curves corresponds to the phase from point D to E. The supersoft X-ray phase corresponds to the phase from point E to F. These phases have been well observed in a number of novae in various wavelength bands (e.g. Hachisu & Kato, 2006, 2010, 2014, 2015, 2016a; Osborne, 2015; Schwarz et al., 2011, and references therein). The evolution of novae has been modeled by the optically thick wind theory (Kato & Hachisu, 1994), and their theoretical light curves for D-E-F have successfully reproduced the observed light curves including NIR, optical, UV, and supersoft X-rays. From point D to E, the optical/IR light curves are well explained in terms of free-free emission (Gallagher & Ney, 1976), the fluxes of which are calculated from the mass-loss rate of the optically thick winds (Wright & Barlow, 1975). From point E to F, the duration of the supersoft X-ray phase is theoretically reproduced. Detailed comparison with theory and observation enables us to determine/constrain the nova parameters such as the WD mass, distance, and extinction, in many novae (Hachisu & Kato, 2014, 2015, 2016a, 2016b). Thus, the characteristic properties of a nova from D to F have been well understood in both observational and theoretical terms.
The X-ray flash is the stage from point B to C, which occurs just after the hydrogen ignition (Kato et al., 2015; Hachisu et al., 2016), but before the optical discovery. This stage has not been theoretically studied well, partly because of numerical difficulties and partly because of insufficient observational data to guide the theoretical models. In general, we cannot know in advance when and where a nova will erupt. Thus, soft X-ray flashes have never been detected in any kind of nova with any X-ray satellite. X-ray flashes represent one of the last frontiers of nova eruption studies and their detection will open a new landscape of nova physics.
The X-ray flash of novae has been predicted from theoretical models for many years (e.g., Starrfield et al., 1990; Krautter, 2002), but its observation had not been attempted until recently. In an attempt to provide observational constraints on X-ray flashes Morii et al. (2016) analyzed MAXI/GSC (Gas Slit Camera) data obtained with 92 minute cadence for 40 novae, including recurrent novae. They deduced the upper limit of the soft X-ray fluxes spanning a period of 10 days before the optical discovery of each nova. The energy bandpass of MAXI/GSC, however, is too high (2-4 keV) to detect the supersoft X-rays (blackbody temperatures up to a maximum of 120 eV, observed in nova M31N 2008-12a, see Henze et al., 2014b, 2015a) expected during the flash. Thus their upper limits of the bolometric luminosity are much higher than the theoretically expected values ( erg s-1, see Kato et al., 2015) and their approach was not effective to restrict the epoch of an X-ray flash.
We carried out a coordinated, very high-cadence observing campaign with the Swift satellite (Gehrels et al., 2004) to detect the X-ray flash during the 2015 outburst of the recurrent nova M31N 2008-12a (Darnley et al., 2014, 2015; Henze et al., 2014a, 2015a; Tang et al., 2014). This is the ideal object to detect X-ray flashes because its recurrence period is as short as a year, possibly even half a year (Henze et al., 2015b). Such a very short recurrence period allows us to predict the eruption date with unprecedented accuracy ( month) and thereby makes any observational campaigns significantly more feasible than for any other novae. We found no significant X-ray emission during the eight days before the optical discovery by Darnley et al. (2015a). This result is not consistent with the prediction made by Kato et al. (2015), and suggests that theoretical models are still incomplete especially in the rising phase. Because no observational detection of soft X-rays and their properties has ever been obtained in the pre-optical-maximum phase, we are unable to constrain the theoretical models. In the present paper we describe the theoretical light curves of X-ray flashes for massive WDs, and present the observational results. We also address the implication of a non-detection of a flash.
This paper is organized as follows. Section 2 describes our improved numerical calculations and presents theoretical light curves of X-ray flashes as well as the physical properties of expanding envelopes in the early phase of shell flashes. Section 3 describes the Swift observations of the 2015 outburst of M31N 2008-12a, which resulted in the non-detection of an X-ray flash. In Section 4, we identify the reason why X-ray flash emission was not detected. Discussion and conclusion follow in Sections 5 and 6.
2. EARLY EVOLUTION OF SHELL FLASH
2.1. Numerical method
We calculated recurrent nova models on 1.38 and 1.385 WDs accreting hydrogen-rich matter ( and for hydrogen, helium, and heavy elements, respectively) with mass-accretion rates of 1.4 – 2.5 yr-1, corresponding to recurrence periods from one year to half a year (Darnley et al., 2015; Henze et al., 2015b). We also calculated models for a 1.35 WD of 1.0 and 12 year recurrence periods for comparison. Table 1 summarizes our models. The WD mass and mass-accretion rate are the given model parameters and the other values, including recurrence periods, are calculated results.
We calculated several outburst cycles until the shell flashes reached a limit cycle. We used the same Henyey-type code as in Kato et al. (2014, 2015) and Hachisu et al. (2016), but adopted a thinner static boundary layer [] for the outermost surface layer and smaller time-steps and mass zones. These technical improvements enabled us to calculate the photospheric values much more accurately in the extended phase (after point B in Figure 1) until the optically thick wind begins to blow at (K) . The X-ray light curves are calculated from the photospheric luminosity and temperature assuming blackbody emission.
Our report here is focused on the very early phase of nova outbursts, i.e., the X-ray flash phase. The occurrence of the optically thick wind in our models is judged using the surface boundary condition BC1 listed in Table A1 of Kato & Hachisu (1994).

2.2. Energy budget
Figure 2 shows the energy budget in the very early phase of shell flashes on a WD for two recurrence periods yr (yr-1: solid) and yr (yr-1: dashed). The nuclear luminosity,
| (1) |
takes a maximum value of for the yr case and for the yr case. Here, is the energy generation rate per unit mass for hydrogen burning, is the mass within the radius , and is the mass of the white dwarf including the envelope mass. The maximum value is lower for the shorter recurrence period. A shorter recurrence period corresponds to a higher mass-accretion rate, and ignition starts at a smaller envelope mass because of heating by a larger gravitational energy release rate. We define the hydrogen-rich envelope mass as the mass above , i.e.,
| (2) |
and the ignition mass, , as the hydrogen-rich envelope mass at the maximum nuclear energy release rate, i.e., (at ) because the envelope mass is increasing owing to mass-accretion even after hydrogen ignites. The ignition mass is for yr and for yr. For a smaller envelope mass, the pressure at the bottom of the envelope is lower and therefore the maximum temperature is also lower. As a result, the maximum value of is lower for a shorter recurrence period.
Although a high nuclear luminosity () is produced, most of the energy is absorbed by the burning shell, as indicated by the large negative values of the gravitational energy release rate, , which is defined by
| (3) |
where is the gravitational energy release rate per unit mass, is the temperature and is the entropy per unit mass (see, e.g., Kato et al., 2014; Hachisu et al., 2016).
As a result, the photospheric luminosity (, because neutrino loss is negligible) is two orders of magnitude smaller than the peak value of . Shortly after the ignition, the photospheric luminosity approaches a constant value. This constant value is close to but slightly smaller than the Eddington luminosity at the photosphere,
| (4) |
where is the opacity at the photosphere. In other words, the photospheric luminosity stays below the Eddington luminosity in this early phase of a shell flash.
2.3. HR diagram
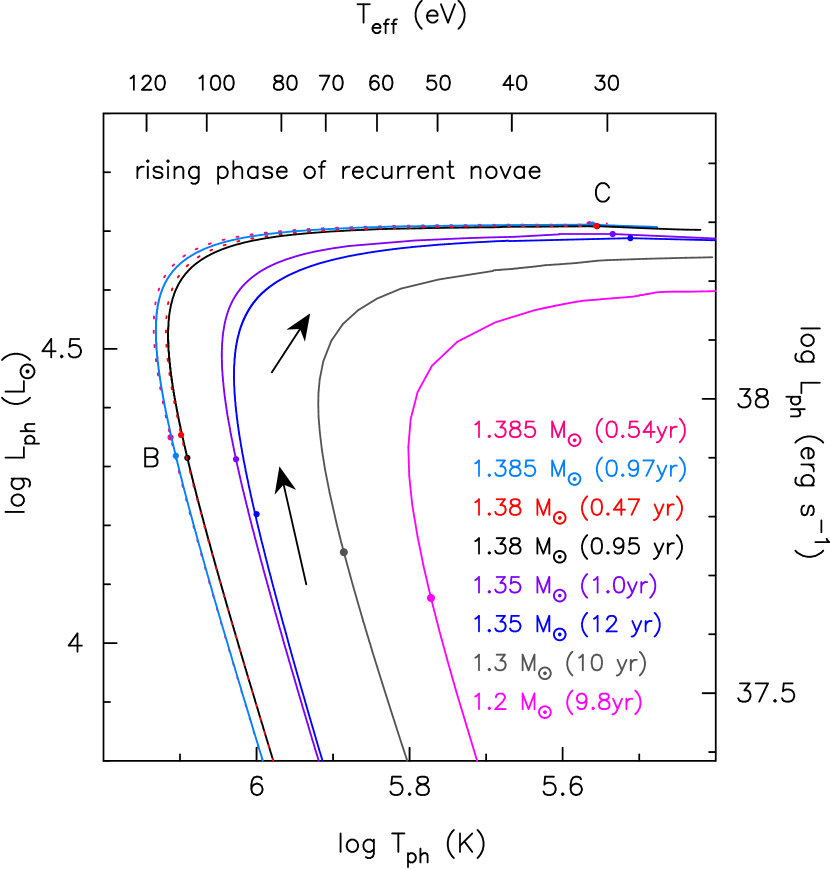
Figure 3 shows the HR diagram of the rising phase of recurrent nova outbursts for various WD masses and recurrence periods. X-ray flashes correspond to the phase approximately from point B to C (the same marks denote the same stage in Figure 1). A more massive WD reaches a higher photospheric luminosity and maximum photospheric temperature, therefore we expect larger X-ray luminosity during the X-ray flash on a more massive WD.
The track in the HR diagram depends not only on the WD mass but also more weakly on the recurrence period. For a longer recurrence period, the ignition mass is larger and the envelope begins to expand at a lower luminosity. Thus, the track locates slightly lower and towards the right (redder) side compared to that of a shorter recurrence period.
2.4. X-ray light curve
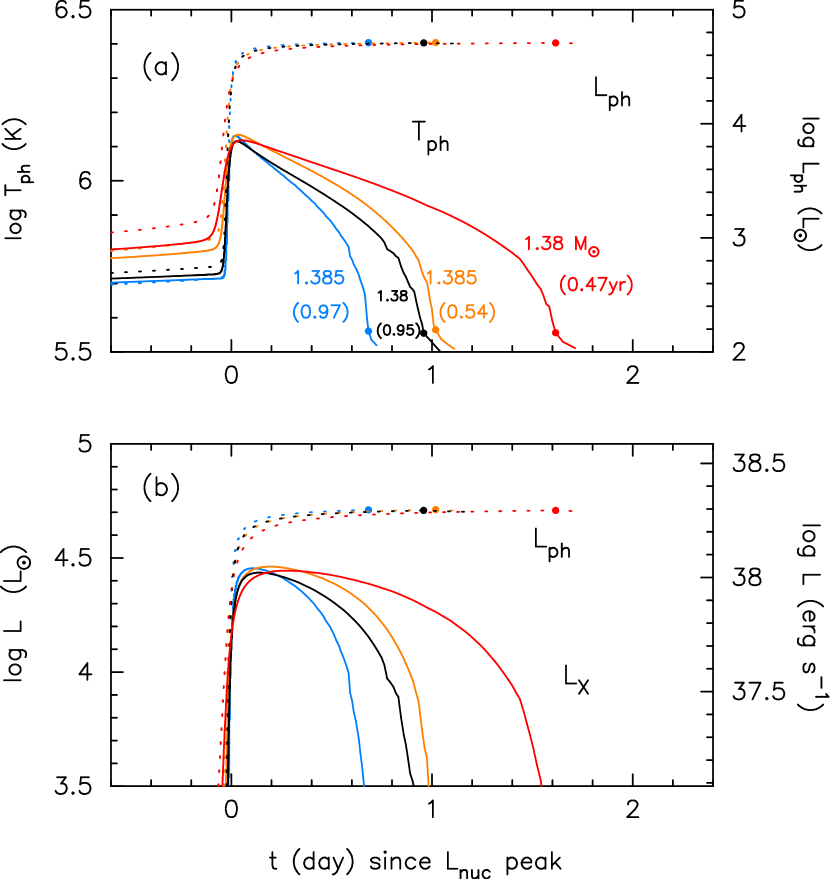
Figure 4(a) shows the photospheric temperature and luminosity during the X-ray flashes for the 1.38 and 1.385 WD models in Table 1. The photospheric luminosity quickly rises near the peak () and reaches a constant value. The photospheric temperature reaches its maximum immediately after the time of ignition and decreases with time. When the envelope expands and the photospheric temperature decreases to a critical temperature, the optically thick wind occurs (this epoch corresponds to point C in Figure 1). This critical temperature is indicated by small filled circles in Figure 4(a). Shortly before this epoch, the temperature drops quickly corresponding to the opacity increase near the photosphere, which will be discussed in Section 2.6.
Figure 4(b) shows the X-ray luminosity in the supersoft X-ray band (0.3 – 1.0 keV). The duration ( 4) of the X-ray flash is 14 – 19 hours (0.59 – 0.78 days) for year recurrence period novae and 22 – 34 hours (0.9 – 1.4 days) for -year period novae. For a shorter recurrence period, the ignition is weaker as explained before, so the expansion is slower than in longer recurrence period novae. The shortest duration among these four models is 14 hours (0.59 days) for 1.385 with yr. As 1.385 is almost the upper limit of a mass accreting WD with no rotation (Nomoto et al., 1984), a duration of 14 hours (0.59 days) would be the minimum for novae with recurrence periods shorter than one year.
The ultra-short recurrence period nova M31N 2008-12a shows a supersoft X-ray source phase (SSS) of 10 days (Henze et al., 2014a, 2015a; Tang et al., 2014). In general, the SSS phase (from E to F in Figure 1) is shorter for a more massive WD. The duration of the SSS phase of M31N 2008-12a is consistent with a WD (Henze et al., 2015a). Such a SSS phase duration allows us to exclude WDs much more massive than 1.385 . Similarly, we can also exclude a WD because its SSS duration would be too long. The duration of the X-ray flash in a 1.38 – WD ( hours) is long enough to be detectable with the 6-hour cadence of our Swift observations (see Section 3).
2.5. Various WD models and flash duration
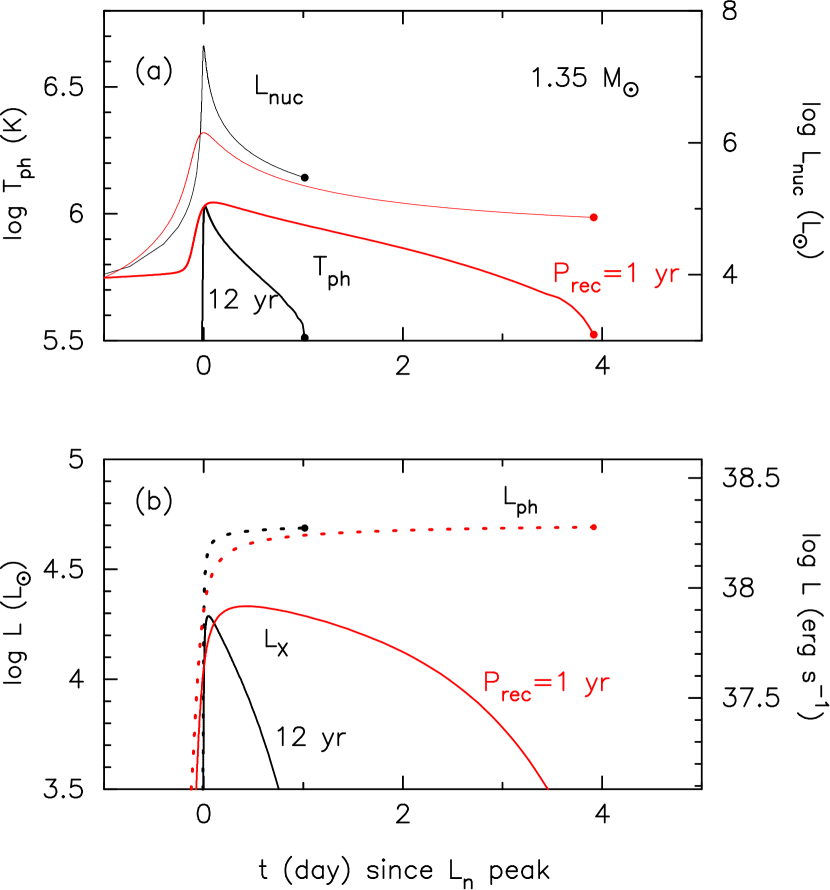
We have calculated shell flash models on a WD with and 12 yr for comparison. The corresponding mass accretion rates are listed in Table 1. Figure 5(a) shows the evolution of the nuclear luminosity and photospheric temperature. The outburst in the yr case (red lines) is much weaker than in the yr scenario (black lines) as indicated by the lower nuclear energy generation rate . As a result, in the yr case, the photosphere slowly expands, therefore the photospheric temperature decreases slowly, which results in a much longer X-ray flash as demonstrated in Figure 5(b).
| WD mass | ||||||
|---|---|---|---|---|---|---|
| () | ( yr-1) | (year) | (day) | () | ( K) | |
| 1.385 | … | 0.54 | 0.90 | 2.3 | 1.74 | |
| 1.385 | … | 0.97 | 0.59 | 5.1 | 1.84 | |
| 1.38 | … | 0.47 | 1.4 | 1.5 | 1.66 | |
| 1.38 | … | 0.95 | 0.78 | 3.9 | 1.77 | |
| 1.35 | … | 1.0 | 2.5 | 1.5 | 1.54 | |
| 1.35 | … | 12 | 0.37 | 29 | 1.89 |
Table 1 lists the maximum value of the nuclear energy generation rate and the maximum temperature in the hydrogen nuclear burning region . There are three models of similar recurrence period, year, for 1.35, 1.38 and 1.385 . Both and are larger in more massive WDs. This means that the shell flash is stronger and hence evolves faster in a more massive WD with the same recurrence period because of the stronger gravity of the WD. On the other hand, for a given WD mass, both and are smaller for a shorter recurrence period. This tendency is clearly shown in the two models in which is 19 times larger in yr than in yr. The duration of the X-ray flash is 6.8 times longer for the shorter recurrence period.
To summarize, more massive WDs undergo stronger shell flashes, but their flashes become weaker for shorter recurrence periods. Thus, the duration of X-ray flash is shorter in more massive WDs, but longer for shorter recurrence periods. Even in WDs as massive as 1.38 , the X-ray flash could last days.

2.6. Internal structure at the end of X-ray flash
The X-ray flash ends when the envelope expands and the optically thick winds start blowing. In this subsection, we examine the possibility that the optically thick winds are accelerated much earlier (i.e., before point C in Figure 1), which shortens the duration of the X-ray flash.
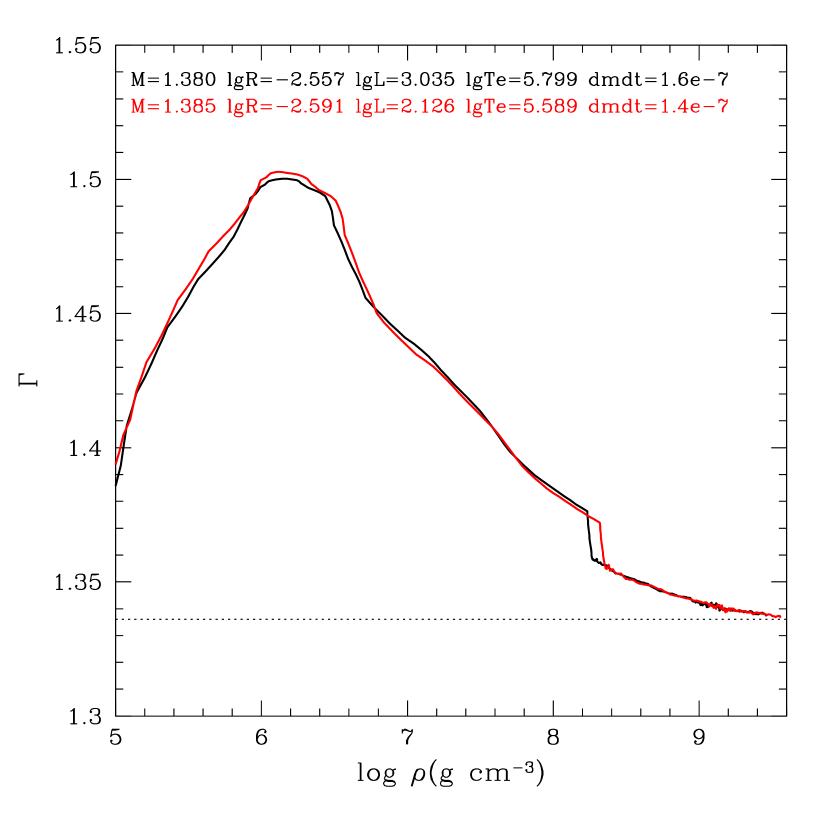
Before going into the details of the envelope structure, it would be instructive to discuss the opacity in the envelope, which is closely related to the envelope expansion and occurrence of wind mass loss. Figure 6 shows the run of the OPAL opacity (Iglesias et al., 1987; Iglesias & Rogers, 1996) with solar composition in an optically thick wind solution with (K) =4.0 on the WD. This model has a very large envelope mass and a uniform chemical composition that does not exactly correspond to the structure of a very short recurrence period nova, but is sufficient to show the characteristic properties of the OPAL opacity. In our evolution calculation, the chemical composition varies from place to place and the photospheric temperature is much higher than in this case.
The opacity has several peaks above the constant value of the electron scattering opacity for . The peak at (K) =4.5 corresponds to the second helium ionization. The prominent peak at (K) is owed mainly to low/mid-degree ionized iron found in opacity projects (Iglesias et al., 1987; Seaton et al., 1994). Hereafter, we call it the “Fe peak.” The peak at (K)= 6.2 relates to highly ionized Fe, C, O, and Ne. We call it the “C/O peak.” A tiny peak around (K)= 7.0 is owed to the highly ionized heavy elements Ar – Fe. The opacity is smaller than that of electron scattering at the highest temperature region because of the Compton effect.
A large peak in the opacity causes the envelope expansion and accelerates the optically thick winds. In the model in Figure 6, the critical point of the optically thick winds (Kato & Hachisu, 1994), in which the velocity becomes equal to the isothermal, sound velocity, appears just on the inside of the Fe peak. A critical point appears in the region of acceleration which means that the envelope is accelerated outward where the opacity quickly increases outward.
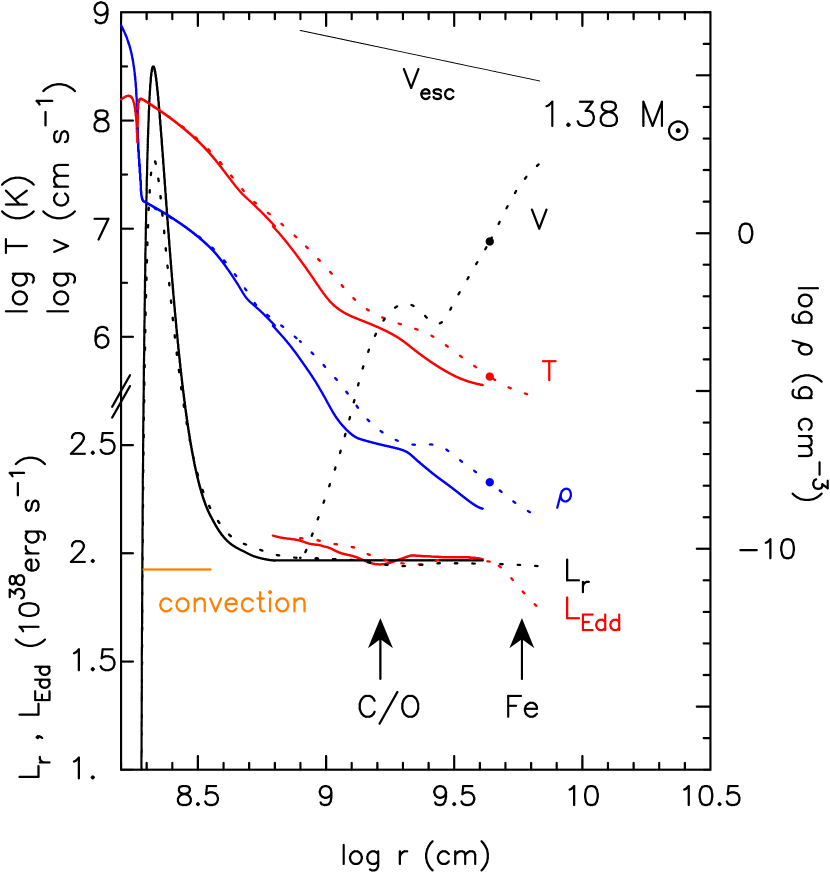
Figure 7 shows the internal structures at the end of the X-ray flash in our WD model with yr. The solid line represents the structure at point C in Figures 1, 3, and 4, and the dotted line corresponds to the stages shortly after point C. From top to bottom we show the escape velocity , wind velocity , temperature , density , radiative luminosity which is the summation of diffusive luminosity and convective luminosity, and local Eddington luminosity defined by
| (5) |
where is the opacity. As the opacity depends on the local temperature and density, the local Eddington luminosity also varies. Note that Equation (4) represents the photospheric value of Equation (5). The velocity is not plotted for the solution at point C.
The local Eddington luminosity in Figure 7 shows a small dip at (cm) corresponding to the C/O peak at in Figure 6. Here, the local Eddington luminosity is slightly lower than the diffusive luminosity, i.e., locally the luminosity is super-Eddington. However, this C/O peak does not result in the occurrence of optically thick winds. Instead, the temperature and density profiles become shallower in this region.
When the envelope expands enough and the photospheric temperature approaches the prominent Fe peak, optically thick winds occur. The Fe peak is so large that the local Eddington luminosity decreases to much below the radiative luminosity. The critical point (Kato & Hachisu, 1994) appears near the photosphere, which corresponds to the inner edge of the Fe peak in Figure 6.
If the winds were accelerated by the C/O peak, the X-ray flash durations would be much shorter because the expansion and acceleration occur much earlier. We have confirmed in all of our calculated models that the wind is driven by the Fe peak and not by the C/O peak. Thus, we conclude that the X-ray flash should last at least a half day as in Table 1 and could not be much shorter than that.
3. SEARCH FOR THE X-RAY FLASH IN THE 2015 ERUPTION OF M31N 2008-12a
3.1. Observing Strategy
The multiwavelength coverage of the 2013 and 2014 eruptions of M31N 2008-12a (Darnley et al., 2014, 2015; Henze et al., 2014a, 2015a) resulted in significantly improved predictions of future eruptions. Moreover, Henze et al. (2015b) combined new findings with archival data to arrive at a prediction accuracy of month (and suggest a recurrence period of days). Based on the updated forecast we designed an observational campaign to monitor the emerging 2015 eruption and catch the elusive X-ray flash.
The project was crucially reliant on the unparalleled scheduling flexibility of the Swift satellite (Gehrels et al., 2004), whose X-ray telescope (XRT; Burrows et al., 2005) provided a high-cadence monitoring. Similarly, the unprecedented short recurrence time and predictability of M31N 2008-12a made it the only target for which such an endeavor was feasible.
Starting from 2015 August 20 UT, a 0.6 ks Swift XRT observation was obtained every six hours. After the first week of the monitoring campaign, the exposure time per observation was increased from 0.6 ks to 1 ks, because the actual exposure time often fell short of the goal. The nova eruption was discovered on August 28 (Darnley et al., 2015a), slightly earlier than predicted by Henze et al. (2015b), without any prior detection of an X-ray flash. Because of this early eruption date and the last-minute improvement in prediction accuracy, based on the recovery of the 2010 eruption (Henze et al., 2015b), only eight days worth of observations were obtained before the 2015 eruption. All individual observations until after the optical discovery are listed in Table 2. The campaign continued until the end of the SSS phase and the analysis of the phase is presented by Darnley et al. (2016, in prep.).
3.2. Data Analysis
All Swift XRT data were obtained in photon counting (PC) mode and were reduced using the standard Swift and Heasarc tools (HEASOFT version 6.16). Our analysis started from the cleaned level 2 files that had been reprocessed locally with HEASOFT version 6.15.1 at the Swift UK data centre.
We extracted source and background counts in xselect v2.4c based on the XRT point spread function (PSF) of M31N 2008-12a observed during previous eruptions. We applied the standard grade selection 0–12 for PC mode observations. Based on the early SSS phase detections we chose a circular region with a radius of 22 arcsec, which corresponds to a 78% PSF area (based on the merged detections of the 2013/4 eruptions), to optimize the ratio of source to background counts in the source region. The background region excluded the locations of nearby faint X-ray sources as derived from the merged data of the 2013 and 2014 eruption monitoring campaigns (cf. Henze et al., 2014a, 2015a). All counts were restricted to the 0.3–1.0 keV band (refer to the X-ray spectrum of the eruption discussed in Darnley et al. 2016, in prep.).
We checked for a source detection using classical Poisson statistics and determined count rate upper limits using the method of Kraft et al. (1991). The number of background counts were scaled to the source region size and corrected for the differences in exposure, derived from the XRT exposure map, between the regions for each individual observation. To improve the signal to noise ratio of the detection procedure the dataset was smoothed by a two-observation wide boxcar function to achieve a rolling hour window. The added source and background counts were analyzed in the same way as the individual measurements. Note, that therefore successive upper limits are not statistically independent.

3.3. Results
The monitoring campaign was executed exceptionally well, with a median cadence of 6.3 hours between two consecutive observations. At no point was there more than a 10 hour gap between successive pointings. Therefore, the minimum flash duration of 14 hours (0.59 days) would have been covered by at least one observation, more likely two, during the entire eight days prior to the eruption.
In Figure 8 the resulting and XRT count rate upper limits are shown for the individual and merged observations, respectively. The upper limits are between 2 – 4 ct s-1 for the individual observations, which roughly corresponds to the variability range of the SSS phase around maximum (Henze et al., 2015a). The combined upper limits for each two successive merged observations (i.e. a rolling 12 hour period) were almost entirely well below the expected flash count rate of 2 ct s-1. This prediction assumes a similar luminosity and spectrum for the X-ray flash and the SSS phase (see Fig. 1 and compare Henze et al., 2015a; Kato et al., 2015).
The time of eruption () is defined as the midpoint between the last non-detection by the Liverpool Telescope (MJD 57262.16) and the first Swift UVOT detection (MJD 57262.40; cf. Darnley et al. 2016, in prep., for both). Therefore, (August 28.28 UT), with the error corresponding to half the interval between both observations. The rightmost data points in Figure 8 feature the start of the SSS phase to compare the signatures of an actual detection. Additionally, the number of counts in the source region always remained below 2 for individual observations, except for the emergence of the SSS emission.
| ObsID | ExpaaDuration of the X-ray flash: (0.3 - 1.0 keV) . | DatebbStart date of the observation. | MJDbbStart date of the observation. | ccTime in days after the optical eruption of nova M31N 2008-12a on 2015-08-28.28 UT (MJD 57262.28). | ulim | ulim |
|---|---|---|---|---|---|---|
| [ks] | [UT] | [d] | [d] | [ ct s-1] | [ ct s-1] | |
| 00032613063 | 0.66 | 2015-08-20.027 | 57254.0273 | -8.253 | ||
| 00032613064 | 0.47 | 2015-08-20.281 | 57254.2812 | -7.999 | ||
| 00032613065 | 0.70 | 2015-08-20.547 | 57254.5469 | -7.733 | ||
| 00032613066 | 0.50 | 2015-08-20.820 | 57254.8203 | -7.460 | ||
| 00032613067 | 0.40 | 2015-08-21.023 | 57255.0234 | -7.257 | ||
| 00032613068 | 0.48 | 2015-08-21.281 | 57255.2812 | -6.999 | ||
| 00032613069 | 0.53 | 2015-08-21.555 | 57255.5547 | -6.725 | ||
| 00032613070 | 0.41 | 2015-08-21.812 | 57255.8125 | -6.467 | ||
| 00032613071 | 0.55 | 2015-08-22.023 | 57256.0234 | -6.257 | ||
| 00032613072 | 0.72 | 2015-08-22.344 | 57256.3438 | -5.936 | ||
| 00032613073 | 0.54 | 2015-08-22.543 | 57256.5430 | -5.737 | ||
| 00032613074 | 0.42 | 2015-08-22.812 | 57256.8125 | -5.467 | ||
| 00032613075 | 0.54 | 2015-08-23.020 | 57257.0195 | -5.260 | ||
| 00032613076 | 0.78 | 2015-08-23.344 | 57257.3438 | -4.936 | ||
| 00032613077 | 0.45 | 2015-08-23.543 | 57257.5430 | -4.737 | ||
| 00032613078 | 0.51 | 2015-08-23.809 | 57257.8086 | -4.471 | ||
| 00032613079 | 0.32 | 2015-08-24.020 | 57258.0195 | -4.260 | ||
| 00032613080 | 0.64 | 2015-08-24.340 | 57258.3398 | -3.940 | ||
| 00032613081 | 0.60 | 2015-08-24.539 | 57258.5391 | -3.741 | ||
| 00032613082 | 0.49 | 2015-08-24.805 | 57258.8047 | -3.475 | ||
| 00032613083 | 0.57 | 2015-08-25.016 | 57259.0156 | -3.264 | ||
| 00032613084 | 0.59 | 2015-08-25.340 | 57259.3398 | -2.940 | ||
| 00032613085 | 0.46 | 2015-08-25.559 | 57259.5586 | -2.721 | ||
| 00032613086 | 0.47 | 2015-08-25.887 | 57259.8867 | -2.393 | ||
| 00032613087 | 0.58 | 2015-08-26.012 | 57260.0117 | -2.268 | ||
| 00032613088 | 0.49 | 2015-08-26.406 | 57260.4062 | -1.874 | ||
| 00032613089 | 0.53 | 2015-08-26.613 | 57260.6133 | -1.667 | ||
| 00032613090 | 0.51 | 2015-08-26.801 | 57260.8008 | -1.479 | ||
| 00032613091 | 0.85 | 2015-08-27.012 | 57261.0117 | -1.268 | ||
| 00032613092 | 0.79 | 2015-08-27.406 | 57261.4062 | -0.874 | ||
| 00032613093 | 0.67 | 2015-08-27.602 | 57261.6016 | -0.678 | ||
| 00032613094 | 0.87 | 2015-08-27.801 | 57261.8008 | -0.479 | ||
| 00032613095 | 0.56 | 2015-08-27.012 | 57261.0117 | -1.268 | ||
| 00032613096 | 0.74 | 2015-08-28.008 | 57262.0078 | -0.272 | ||
| 00032613097 | 0.80 | 2015-08-28.406 | 57262.4062 | 0.126 | ||
| 00032613098 | 0.67 | 2015-08-28.602 | 57262.6016 | 0.322 | ||
| 00032613099 | 0.87 | 2015-08-28.801 | 57262.8008 | 0.521 | ||
| 00032613100 | 0.87 | 2015-08-29.004 | 57263.0039 | 0.724 |
| ObsID | Exp | DateaaDead-time corrected exposure time. | MJDaaMidpoint between the two observations. | aaMidpoint between the two observations. | ulim | ulim |
|---|---|---|---|---|---|---|
| [ks] | [UT] | [d] | [d] | [ ct s-1] | [ ct s-1] | |
| 00032613063/064 | 1.13 | 2015-08-20.15 | 57254.1542 | -8.126 | ||
| 00032613064/065 | 1.17 | 2015-08-20.41 | 57254.4140 | -7.866 | ||
| 00032613065/066 | 1.20 | 2015-08-20.68 | 57254.6836 | -7.596 | ||
| 00032613066/067 | 0.90 | 2015-08-20.92 | 57254.9218 | -7.358 | ||
| 00032613067/068 | 0.88 | 2015-08-21.15 | 57255.1523 | -7.128 | ||
| 00032613068/069 | 1.01 | 2015-08-21.42 | 57255.4180 | -6.862 | ||
| 00032613069/070 | 0.94 | 2015-08-21.68 | 57255.6836 | -6.596 | ||
| 00032613070/071 | 0.96 | 2015-08-21.92 | 57255.9180 | -6.362 | ||
| 00032613071/072 | 1.27 | 2015-08-22.18 | 57256.1836 | -6.096 | ||
| 00032613072/073 | 1.26 | 2015-08-22.44 | 57256.4434 | -5.837 | ||
| 00032613073/074 | 0.96 | 2015-08-22.68 | 57256.6778 | -5.602 | ||
| 00032613074/075 | 0.96 | 2015-08-22.92 | 57256.9160 | -5.364 | ||
| 00032613075/076 | 1.32 | 2015-08-23.18 | 57257.1816 | -5.098 | ||
| 00032613076/077 | 1.23 | 2015-08-23.44 | 57257.4434 | -4.837 | ||
| 00032613077/078 | 0.96 | 2015-08-23.68 | 57257.6758 | -4.604 | ||
| 00032613078/079 | 0.83 | 2015-08-23.91 | 57257.9140 | -4.366 | ||
| 00032613079/080 | 0.96 | 2015-08-24.18 | 57258.1797 | -4.100 | ||
| 00032613080/081 | 1.24 | 2015-08-24.44 | 57258.4395 | -3.841 | ||
| 00032613081/082 | 1.09 | 2015-08-24.67 | 57258.6719 | -3.608 | ||
| 00032613082/083 | 1.06 | 2015-08-24.91 | 57258.9101 | -3.370 | ||
| 00032613083/084 | 1.16 | 2015-08-25.18 | 57259.1777 | -3.102 | ||
| 00032613084/085 | 1.05 | 2015-08-25.45 | 57259.4492 | -2.831 | ||
| 00032613085/086 | 0.93 | 2015-08-25.72 | 57259.7226 | -2.557 | ||
| 00032613086/087 | 1.05 | 2015-08-25.95 | 57259.9492 | -2.331 | ||
| 00032613087/088 | 1.07 | 2015-08-26.21 | 57260.2090 | -2.071 | ||
| 00032613088/089 | 1.02 | 2015-08-26.51 | 57260.5097 | -1.770 | ||
| 00032613089/090 | 1.04 | 2015-08-26.71 | 57260.7070 | -1.573 | ||
| 00032613090/091 | 1.36 | 2015-08-26.91 | 57260.9062 | -1.374 | ||
| 00032613091/092 | 1.64 | 2015-08-27.21 | 57261.2090 | -1.071 | ||
| 00032613092/093 | 1.46 | 2015-08-27.50 | 57261.5039 | -0.776 | ||
| 00032613093/094 | 1.54 | 2015-08-27.70 | 57261.7012 | -0.579 | ||
| 00032613094/096 | 1.61 | 2015-08-27.90 | 57261.9043 | -0.376 | ||
| 00032613096/097 | 1.54 | 2015-08-28.21 | 57262.2070 | -0.073 | ||
| 00032613097/098 | 1.47 | 2015-08-28.50 | 57262.5039 | 0.224 | ||
| 00032613098/099 | 1.54 | 2015-08-28.70 | 57262.7012 | 0.421 | ||
| 00032613099/100 | 1.74 | 2015-08-28.90 | 57262.9024 | 0.622 |
The strict limits indicate that we should have seen the X-ray flash if it had occurred with the predicted luminosity and spectrum during the time of the monitoring. The restrictive limits can be used to constrain the X-ray flux in a meaningful way. The corresponding data are given in Tables 2 and 3.
4. IMPLICATION OF NON-DETECTION OF X-RAY/UV FLUXES
We have confirmed theoretically that the X-ray flash should last 14 hours (0.59 days) or longer (in Section 2). The X-ray flash was not, however, detected in our six-hour-cadence eight-day observations preceding the 2015 outburst. In this section we examine two possible reasons for the non-detection; (1) the X-ray flash had occurred during the Swift observation period, but all the photons were obscured by surrounding neutral hydrogen, or (2) the X-ray flash had occurred earlier than our Swift observation period, i.e., more than eight days before the optical discovery.
4.1. Absorption by surrounding neutral hydrogen
A WD in a binary is possibly surrounded by ionized/neutral material originating from the companion star. If the WD is surrounded by a substantial amount of neutral hydrogen, X-ray photons emitted from the WD surface could be mostly absorbed, and thus one may not detect the X-ray flash. It is, however, poorly known whether the mass-accreting WDs in recurrent novae are surrounded by ionized or neutral matter in their early outburst phase.
The companion of M31N 2008-12a has not been identified, yet. If the companion star is a Roche-lobe filling subgiant, we can expect that the mass transfer is mainly through the accretion disk and a small proportion of the mass lost by the donor is spread over the circumbinary region. If the companion is a red giant, the binary could be embedded within the cool neutral wind, which absorbs supersoft X-ray photons from the WD.
Darnley et al. (2014) compared the spectral energy distribution (SED) of M31N 2008-12a in its quiescent phase with those of the Galactic recurrent novae, RS Oph, T CrB, and U Sco. Based on the similarity of the RS Oph SED, rather than U Sco which is much fainter, the authors suggested that M31N 2008-12a likely contains a red giant companion with a significant accretion disk component that dominates the near-UV and optical flux. The authors note, however, that the possibility of a face-on subgiant companion remains because U Sco is an eclipsing binary and its edge-on disk may not be bright.
Hachisu & Kato (2016b) classified 40 classical novae into six classes according to their evolutionary path in the color-magnitude diagram and found that the different paths correspond to differences in the nova speed class and thus the envelope mass. These authors also displayed the color-magnitude evolution during the 2014 outburst of M31N 2008-12a and found that its characteristic properties are similar to those of U Sco and CI Aql, which are both recurrent novae with a subgiant companion, but different from RS Oph which has a red giant companion (see their Figures 72(c), (d), and 76(b)). This suggests that M31N 2008-12a has a subgiant companion.
The Galactic object RS Oph is a well observed recurrent nova. Its recorded outbursts were in 1898, 1933, 1958, 1967, 1985 and 2006 (Evans et al., 2008). In the 1985 outburst very soft X-ray emission was detected 251 days after the optical maximum (Mason et al., 1987). Hachisu & Kato (2001) regarded this X-ray emission to be due to the accretion luminosity and suggested that the accretion rate had dropped by a factor of six after the outburst. Dobrzycka & Kenyon (1994) also pointed out a decrease in the mass accretion rate from line fluxes in H I and He I that decreased by a factor of four after the 1985 outburst. Day 251 falls in the period of the postoutburst minimum of days -400, after which the visual luminosity increased by about a magnitude (Evans et al., 1988). X-rays were also observed in 1992 with ROSAT (Orio, 1993), but the supersoft flux ( keV) was very weak. One possible explanation is absorption by the massive cool wind (e.g., Shore et al., 1996) from the red giant companion as suggested by Anupama & Mikołajewska (1999). After 21 years of accumulation, the overlying RG wind reaches 2-5 cm-2 (Bode et al., 2006; Sokoloski et al., 2006) in the 2006 outburst. However, the absorption effect of this overlying RG wind is quickly removed (Osborne et al., 2011). After the outburst the mass-accretion rate had dropped in the post-outburst minimum phase and soft X-rays were observable because the ejecta swept away the red giant cool wind. After day 400, the mass transfer had recovered and the hot component could be surrounded by neutral hydrogen.
If the accretion disk is completely blown off by the ejecta, it may take a few orbital periods until a significant amount of the red giant wind falls onto the WD. Hachisu & Kato (2001) roughly estimated the resumption time of mass-transfer in RS Oph to be days, where is the binary separation and is the velocity of infalling matter. This is roughly consistent with the recovery of the quiescent luminosity 400 days after the 1985 outburst [see Figure 1 in Evans et al. (1988); Figure 2 in Hachisu & Kato (2006), Worters et al. (2007), also Darnley et al. (2008)]. M31N 2008-12a shows a ultra-short recurrence period of one or half a year. It is unlikely that systems like RS Oph produce successive outbursts with such a short recurrence period because of a long interruption of mass transfer unless the disk survives the eruption. Thus, we expect that M31N 2008-12a does not have a red giant companion.
U Sco is another well observed Galactic recurrent nova with a subgiant companion. Ness et al. (2012) examined an X-ray eclipse during the 2010 outburst in detail and concluded that the mass accretion resumed as early as day 22.9, midway during the SSS phase. In a binary with a subgiant companion, thus, we can expect the mass accretion to resume just after an outburst.
For these reasons, we may conclude that M31N 2008-12a has a subgiant companion. In case of close binaries, the transferred matter is mostly distributed in the orbital plane (see, e.g., Sytov et al., 2009, for a 3-D calculation of mass flow in a close binary). Note that, in our binary models, the WD radiates – at – K in its quiescent phase. Therefore, we expect that the matter surrounding the WD may be kept ionized during the quiescent phase. Thus, we consider that an X-ray flash should have been detected if it had occurred during our observing period.
4.2. Slow evolution after X-ray flash
The other explanation of the undetected X-ray flash is that the flash had already occurred and finished when we started our observations eight days before the UV/optical discovery. This means that the evolution time from C to D in Figure 1 was longer than eight days, and the optical/UV bright phase, from D to E, lasted about 5.5 days (Darnley et al., 2015; Henze et al., 2015a). Darnley et al. (2015) pointed out that M31N 2008-12a showed slow rise to the optical peak magnitude in the 2014 outburst. This suggest a slow evolution toward point D.
The timescale from C to E can be roughly estimated as follows. The decrease of the envelope mass from C to E is owed both to nuclear burning and mass ejection. For example, in a WD with yr, the envelope mass is at C and decreases to at E. In the 2014 outburst, the ejected hydrogen mass was estimated to be (Henze et al., 2015a), which corresponds to for (the hydrogen mass fraction is smaller than the initial because of convective mixing with the nuclear burning region).
Darnley et al. (2015) derived a total ejected mass of . Here we assume the mass ejected by the wind to be . Thus, nuclear burning had consumed the rest of the mass, during the period from C to E. If we take the mean nuclear luminosity as 4.65, the evolution time from C to E is roughly estimated as days, here and energy generation of hydrogen burning erg g-1. So we obtain the duration between epochs C and D in Figure 1 to be days. For a longer recurrence period, yr, we obtain, in the same way, ( days. Here we assume X=0.53 and the mean nuclear luminosity to be 4.85 for a somewhat stronger shell flash than in the shorter recurrence period (see Figure 2).
In this way we may explain that the X-ray flash had occurred 15.5 days ( yr) or 9.3 days ( yr) before the optical/UV peak. These values should be considered as rough estimates because they are sensitive to our simplified value for the mean , beside other parameters such as the WD mass and recurrence period (i.e., mass accretion rate). Even though, these estimates suggest that the nova evolution is slow between C and D, and the X-ray flash could have occurred before our observing period (eight days before the optical/UV detection), rather than immediately before the optical maximum (Kato et al., 2015).
Observations of recurrent novae have shown that they evolve much faster than typical classical novae, which is demonstrated by their very short X-ray turn-on time (duration between the optical peak to the X-ray turn-on, see, e.g., Page et al., 2015, for the shortest 4 day case of V745 Sco). By analogy, and without observational support, we suspect that the rising phase of recurrent novae must also be fast. However, our 8-days-non-detection prior to the optical/UV peak suggests it may not be as fast as predicted. It is partly suggested by our calculation that is rather small in very short recurrence period novae even though the WD is extremely massive. The small nuclear burning energy generation rate renders the recurrent nova eruption relatively weak. Because time-dependent calculations have many difficulties in the expanding phase of nova outbursts, no one has ever succeeded in reproducing reliable multiwavelength light curves that included the rising phase. We expect that the detection of X-ray flashes can confirm such a slow evolution in the very early phase of a nova outburst.
5. DISCUSSION
5.1. Comparison with other works
Many numerical calculations of shell flashes have been presented, but only a few of them provided sufficient information on the early stages corresponding to the X-ray flash. Nariai et al. (1980) calculated hydrogen shell flashes, in which the evolution time from (defined as ) to a stage of (K) is 1.5 hours for a 1.3 WD with yr-1. Iben (1982) showed the timescale from to (K) to be about 100 days for a 0.964 WD with yr-1 (in his Figure 8). For a 1.01 WD, it is about 20 days with yr-1 and about 1 day for yr-1 (in his Figures 15 and 21) . These studies are based on the Los Alamos opacities that have no Fe peak, so the optically thick wind does not occur, resulting in a much longer total duration of the nova outburst. However, the timescales in the very early phase corresponding to the X-ray flash (defined by (K) ) should not be much affected by the Fe peak because the photospheric temperature is higher than the Fe peak. We see a tendency of a longer X-ray flash for a less massive WD and for a larger mass accretion rate (i.e., a shorter recurrence period). This tendency agrees with our results.
Hillman et al. (2014) showed evolutionary change in the effective temperature of nova outbursts with the OPAL opacities. Their Figure 3 shows an X-ray flash duration (defined by (K) ) of a few hours for a 1.4 WD with a mass accretion rate of yr-1. This accretion rate corresponds to the recurrence period of 20 yr (Prialnik & Kovetz, 1995). Considering the tendency that a longer duration X-ray flash is obtained for a less massive WD and larger mass-accretion rate, their duration of a few hours is consistent with our results of half a day to one day (Table 1).
5.2. General relativistic stability of massive WDs
The masses of our WD models are very close to the Chandrasekhar mass limit, above which non-rotating WDs cannot exist. This limit is for pure degenerate gas (e.g. Equation 6.10.26 in Shapiro & Teukolsky, 1983), where is the mean molecular weight of the electron. According to Shapiro & Teukolsky (1983), Kaplan (1949) first pointed out that general relativity probably induces a dynamical instability when the radius of a WD becomes smaller than km. Chandrasekhar & Tooper (1964) independently showed that a WD of mass is dynamically unstable when its radius decreases below km. This means that the instability occurs at radii much larger than the Schwarzschild radius . In our model, the 1.38 WD has the radius of km, much larger than the Schwarzschild radius 4.1 km, and the above stability limits of general relativity, km.
Assuming the polytropic relation , Shapiro & Teukolsky (1983) derived a different stability criterion (see their Equation 6.10.30), i.e.,
| (6) |
In our 1.38 model with yr-1 ( yr), the right hand side of Equation (6) becomes maximum at point A in Figure 1, that is, . Thus, the stability criterion becomes . For the 1.385 model with yr-1 ( yr), this criterion is , essentially the same as for the 1.38 model. We calculated the distribution of in the accreting phase as shown in Figure 9. The black line depicts of the 1.38 model, while the red line represents the 1.385 model. Both the red and black lines are located above the horizontal dashed line of . Therefore, both models satisfy the stability condition (). Note that the central part hardly changes during the flash. Thus, we conclude that our 1.38 and 1.385 WD models are stable against the general relativistic instability.
5.3. The soft X-ray transient MAXI J0158744
MAXI J0158744 is an X-ray transient, believed to be a Be star plus WD binary that appeared in the Small Magellanic Cloud (Li et al., 2012; Morii et al., 2013). MAXI detected a brief ( 90 min) X-ray flux ( 5 keV) of very high luminosity (several erg s-1). Follow up Swift observations detected soft X-ray emission ( eV) that lasted two weeks (Li et al., 2012), resembling a SSS phase on a massive WD. For the origin of the early brief X-ray flux, Li et al. (2012) attributed to the interaction of the ejected nova shell with the Be star wind. Morii et al. (2013) concluded that the X-ray emission is unlikely to have a shock origin, but associated it with the fireball stage of a nova outburst on an extremely massive WD.
In this paper we have considered the very early phase of shell flashes in the extreme limit of massive WDs and high mass-accretion rates. Our calculations have shown that, in this limit, the evolution is very slow (X-ray flash lasts one day), and the X-ray luminosity does not exceed the Eddington luminosity ( erg s-1). The wind mass loss does not occur during the X-ray flash, and the energy range of the X-ray photons are up to 100-120 eV. These properties are incompatible with the bright (super-Eddington), high energy ( keV), very short duration (90 min) X-ray emission seen early on in MAXI J0158-744. Therefore, we conclude that the brief early X-ray flux in MAXI J0158-744 is not associated with that expected in the extreme limit of massive non-rotating WDs with high mass-accretion rates.
6. CONCLUSIONS
Our main results are summarized as follows.
1. In a very early phase of a recurrent nova outburst, the photospheric luminosity rises very close to the Eddington luminosity at the photosphere and the temperature reaches as high as K in WDs as massive as . We expect bright supersoft X-ray luminosities in this X-ray flash phase, as large as erg s-1.
2. We present light curves of X-ray flashes for 1.35, 1.38, and WDs. The duration of the X-ray flash depends on the WD mass and the recurrence period, shorter for a more massive WD, and longer for a shorter recurrence period. The duration of the X-ray flash would be a good indicator of the WD mass and mass-accretion rate because it depends sensitively on these values.
3. The optically thick wind arises at the end of X-ray flash ( (K) ) owing to acceleration by the Fe opacity peak. As no strong wind mass loss is expected during the X-ray flash, we could observe a naked photosphere, i.e., the spectrum is close to that of blackbody with .
4. We observed with a six-hour-cadence the 2015 outburst of M31N 2008-12a with Swift from eight days before the optical discovery. Although our theoretical prediction of the X-ray flash duration was long enough, as long as 0.5 – 1.5 days, no X-ray flash was detected.
5. We examined two possible reasons for the non-detection. Absorption by the surrounding matter originated from the companion is unlikely. Instead, we suggest that the X-ray flash could have occurred before our observations started, because short recurrence period novae undergo a very slow evolution.
6. The X-ray flash is one of the last frontiers of nova studies. We encourage further attempts at observational confirmation in the near future. Any detection of X-ray flashes would be essentially important to explore the pre-optical-maximum phase and to ultimately understand the complete picture of nova eruptions.
References
- Anupama & Mikołajewska (1999) Anupama, G. C., & Mikołajewska, J. 1999, A&A, 344, 177
- Bode et al. (2006) Bode, M. F., O’Brien, T. J., Osborne, J. P., et al. 2006, ApJ, 652, 629
- Burrows et al. (2005) Burrows, D. N., Hill, J. E., Nousek, J. A., et al. 2005, Space Sci. Rev., 120, 165
- Chandrasekhar & Tooper (1964) Chandrasekhar, S. & Tooper, R. F. 1964, ApJ, 139, 1396
- Darnley et al. (2014) Darnley, M. J., Williams, S. C., Bode, M. F., et al. 2014, A&A, 563, L9
- Darnley et al. (2015) Darnley, M. J., Henze, M., Steele, I. A., et al. 2015, A&A, 580, 45
- Darnley et al. (2015a) Darnley, M. J., Henze, M., Shafter, A. W., & Kato, M. 2015a, ATel, 7964, 1
- Darnley et al. (2008) Darnley, M. J., Hounsell, R. A., Bode, M. F., & Darnley, M. J 2008, RS Ophiuchi (2006) and the Recurrent Nova Phenomenon, ed. A. Evans, M. F. Bode, T. J. O’Brien, & M. J. Darnley. (San Francisco, CA, ASP), ASP Conf. Ser. 401, 203
- Dobrzycka & Kenyon (1994) Dobrzycka, D., & Kenyon, S. J. 1994, AJ, 108, 2259
- Evans et al. (2008) Evans, A, Bode, M. F., O’Brien, T. J., & Darnley, M. J. 2008, RS Ophiuchi (2006) and the Recurrent Nova Phenomenon, ed. A. Evans, M. F. Bode, T. J. O’Brien, & M. J. Darnley. (San Francisco, CA, ASP), ASP Conf. Ser. 401
- Evans et al. (1988) Evans, A., Callus, C. M., Albinson, J. S., et al., 1988, MNRAS, 234, 755
- Gallagher & Ney (1976) Gallagher, J. S., & Ney, E. P. 1976, ApJ, 204, 35
- Gehrels et al. (2004) Gehrels, N., Chincarini, G., Giommi, P., et al. 2004, ApJ, 611, 1005
- Gordon et al. (2003) Gordon, K.D., Clayton,G. C., Misselt, K.A., et al. 2003, ApJ, 594, 279
- Hachisu & Kato (2001) Hachisu, I., & Kato, M. 2001, ApJ, 558, 323
- Hachisu & Kato (2006) Hachisu, I., & Kato, M. 2006, ApJS, 167, 59
- Hachisu & Kato (2010) Hachisu, I., & Kato, M. 2010, ApJ, 709, 680
- Hachisu & Kato (2014) Hachisu, I., & Kato, M. 2014, ApJ, 785, 97
- Hachisu & Kato (2015) Hachisu, I., & Kato, M. 2015, ApJ, 798, 76
- Hachisu & Kato (2016a) Hachisu, I., & Kato, M. 2016a, ApJ, 816, 26
- Hachisu & Kato (2016b) Hachisu, I., & Kato, M. 2016b, ApJS, 223, 21
- Hachisu et al. (2016) Hachisu, I., Saio, H., & Kato, M. 2016, ApJ, 824, 22
- Henze et al. (2015b) Henze, M., Darnley, M. J., Kabashima, F., et al. 2015b, A&A, 582, 8
- Henze et al. (2014a) Henze, M., Ness, J.-U., Darnley, M., et al. 2014a, A&A, 563, L8
- Henze et al. (2015a) Henze, M., Ness, J.-U., Darnley, M., et al. 2015a, A&A, 580, 46
- Henze et al. (2014b) Henze, M., Pietsch, W., Haberl, F., et al. 2014b, A&A, 563, A2
- Hillman et al. (2015) Hillman, Y., Prialnik, D., Kovetz, A., Shara, M. M. 2015, MNRAS, 446, 1924
- Hillman et al. (2014) Hillman, Y., Prialnik, D., Kovetz, A., Shara, M. M., & Neill, J. D. 2014, MNRAS, 437, 1962
- Iben (1982) Iben, I.,Jr. 1982, ApJ, 259, 244
- Iglesias et al. (1987) Iglesias, C. A., Rogers, F. J., & Wilson, B. G. 1987, ApJ, 322, L45
- Iglesias & Rogers (1996) Iglesias, C. A., & Rogers, F. J. 1996, ApJ, 464, 943
- José et al. (1993) José, J., Hernanz, M., & Isern J. 1993, A&A, 269, 291
- Kato & Hachisu (1994) Kato, M., & Hachisu, I., 1994, ApJ, 437, 802
- Kato et al. (2014) Kato, M., Saio, H., Hachisu, I., & Nomoto, K. 2014, ApJ, 793, 136
- Kato et al. (2015) Kato, M., Saio, H., & Hachisu, I. 2015, ApJ, 808, 52
- Kaplan (1949) Kaplan, S.A. 1949, Zhurnal Eksperimental’noi i Teoreticheskoi Fiziki, 19, 951 (In Russian)
- Kraft et al. (1991) Kraft, R. P., Burrows, D. N., & Nousek, J. A. 1991, ApJ, 374, 344
- Krautter (2002) Krautter, J. 2002, IAP conf., 637, 345
- Li et al. (2012) Li, K. L., Kong, A. K. H., Charles, P. A., et al. 2012, ApJ,761, 99
- Mason et al. (1987) Mason, K. O., Córdova, F. A., Bode, M. F., & Barr, P. 1987, RS Ophiuchi (1985) and the Recurrent Novae Phenomenon, ed. M. F. Bode (Utrecht: VNU Science), 167
- Mohamed & Podsiadlowski (2012) Mohamed, S., & Podsiadlowski, Ph. 2007, Baltic Astronomy, 21, 88
- Morii et al. (2013) Morii, M., Tomida, H., Kimura, M., et al. 2013, ApJ, 779, 118
- Morii et al. (2016) Morii, M., Yamaoka, H., Mihara,T., Matsuoka, M., & Kawai, N. 2016, PASJ, 68, S11
- Nariai et al. (1980) Nariai, K., Nomoto, K., & Sugimoto, D. 1980, PASJ, 32, 473
- Ness et al. (2012) Ness, J.-U., Schaefer, B. E., Dobrotka, A., et al. 2012, ApJ, 745, 43
- Nielsen & Gilfanov (2015) Nielsen, M. T. B., & Gilfanov, M. 2015, MNRAS, 453, 2927
- Nomoto et al. (1984) Nomoto, K., Thielemann, F.-K., & Yokoi, K. 1984, ApJ, 286, 644
- Osborne et al. (2011) Osborne, J. P., Page, K. L., Beardmore, A. P., et al. 2011, ApJ, 737, 124
- Osborne (2015) Osborne, J.P. 2015, Journal of High Energy Astrophysics, 7, 117
- Orio (1993) Orio, M. 1993, A&A, 274, L41
- Page et al. (2015) Page, K. L., Osborne, J.P, Kuin, N.P., et al. 2015, MNRAS, 454, 3108
- Prialnik & Kovetz (1995) Prialnik, D., & Kovetz, A. 1995, ApJ, 445, 789
- Wright & Barlow (1975) Wright, A. E., & Barlow, M. J. 1975, MNRAS, 170, 41
- Schwarz et al. (2011) Schwarz, G.J., Ness, J-U, Osborne, J. P., et al. 2011, ApJS, 197, 31
- Seaton et al. (1994) Seaton, M. J., Yan, Y., Mihalas, D., & Pradhan, A., K. 1994, MNRAS, 266, 805
- Shapiro & Teukolsky (1983) Shapiro, S. L., & Teukolsky, S. A. 1983, Black Holes, White Dwarfs, and Neutron Stars: The Physics of Compact Objects (John Wiley & Sons, New York), chap.6
- Shore et al. (1996) Shore, S. N., Kenyon, S. J., Starrfield, S., & Sonneborn, G. 1996, ApJ, 456, 717
- Sokoloski et al. (2006) Sokoloski, J. L., Luna, G. J. M., Mukai, K., & Kenyon, S. J. 2006, Nature, 442, 276
- Starrfield et al. (1974) Starrfield, S., Sparks, W. M.. & Truran, J. W. 1974, ApJS, 28, 247
- Starrfield et al. (1990) Starrfield, S., Truran, J. W., Sparks, W. M., Krautter, J., & MacDonald, J. 1990, Physics of Classical Novae. Proceedings of IAU Colloquium No.122, Eds. A. Cassatella & R. Viotti (Springer-Verlag: Berlin), 306
- Sytov et al. (2009) Sytov, A. Yu., Bisikalo, D. V., Kaigorodov, P. V., & Boyarchuk, A. A. 2009, Astronomy Reports, 53, 428
- Tang et al. (2014) Tang, S., Bildsten, L., Wolf, W. M., et al. 2014, ApJ, 786, 61
- Wolf et al. (2013a) Wolf, W. M., Bildsten, L., Brooks, J., & Paxton, B. 2013a, ApJ, 777, 136
- Wolf et al. (2013b) Wolf, W. M., Bildsten, L., Brooks, J., & Paxton, B. 2013b, ApJ, 782, 117 (Erratum)
- Worters et al. (2007) Worters, H. L., Eyres, S. P. S., Bromage, G. E., Osborne, J. P. 2007, MNRAS, 379, 1557