Studies of the Long Secondary Periods in Pulsating Red Giants
John R. Percy and Emily Deibert
Department of Astronomy and Astrophysics, and
Dunlap Institute of Astronomy and Astrophysics
University of Toronto
Toronto ON
Canada M5S 3H4
Abstract We have used systematic, sustained visual observations from the AAVSO International Database, and the AAVSO time-series analysis package VSTAR to study the unexplained “long secondary periods” (LSPs) in 27 pulsating red giants. In our sample, the LSPs range from 479 to 2967 days, and are on average 8.1 1.3 times the excited pulsation period; they are about 5 times the fundamental period. There is no evidence for more than one LSP in each star. In stars with both the fundamental and first overtone radial period present, LSP is more often about 10 times the latter. The visual amplitudes of the LSPs are typically 0.1 magnitude and do not correlate with the LSP. The phase curves tend to be sinusoidal, but at least two are sawtooth. The LSPs are stable, within their errors, over the timespan of our data, which is typically 25,000 days. The amplitudes, however, vary by up to a factor of two or more on a time scale of roughly 20-30 LSPs. There is no obvious difference between the behavior of the carbon (C) stars and the normal oxygen (M) stars. Previous multicolor photoelectric observations showed that the LSP color variations are similar to those of the pulsation period, and of the LSPs in the Magellanic Clouds, and not like those of eclipsing stars. We note that the LSPs are similar to the estimated rotation periods of the stars, though the latter have large uncertainties. This suggests that the LSP phenomenon may be a form of modulated rotational variability.
AAVSO keywords = AAVSO International Database; Photometry, visual; pulsating variables; giants, red; period analysis; amplitude analysis
ADS keywords = stars; stars: late-type; techniques: photometric; methods: statistical; stars: variable; stars: oscillations
1. Introduction
About a third of pulsating red giants show a long secondary period (LSP), about ten times longer than the pulsation period (Wood 2000, Percy and Bakos 2003). LSPs have been known for many decades (O’Connell 1933, Payne-Gaposchkin 1954, Houk 1963), from visual or photographic observations. LSPs have also been discovered photoelectrically in many small-amplitude pulsating red giants (Percy et al. 1996, Percy et al. 2001, Percy and Bakos 2003). LSPs were rediscovered in 1999 by Peter Wood and colleagues (Wood et al. 1999, Wood 2000), from large-scale survey observations of pulsating red giants in the Large Magellanic Cloud (LMC). Since then, he and others have accumulated many more observations of this phenomenon, and have considered many possible explanations. None of them explains these LSPs satisfactorily. Wood considers this to be the most significant unsolved problem in stellar pulsation.
There are at least three possible mechanisms that are still of interest: the turnover of giant convective cells (Stothers 2010), oscillatory convective modes (Saio et al. 2015), or the presence of a dusty cloud, orbiting the red giant, together with a low-mass companion in a close, circular orbit (Soszyński and Udalski 2014), or some combination of these.
Nicholls et al. (2009) (hereinafter NWCS) discussed the problem of the LSPs in detail, and “are unable to find a suitable model for the LSPs”, so they ended by listing “all the currently known properties of LSPs” – a list of 13 items. A few other properties have been added in the literature since then. The purpose of the present paper is to use the systematic, sustained visual data in the AAVSO International Database (Kafka 2016) to add further “knowns” to this list.
LSPs are not the only unsolved mystery in pulsating red giants. Percy and Abachi (2013) found that the pulsation amplitudes in these stars varied by factors of 2 to over 10 on median time scales of 44 pulsation periods. There are also random cycle-to-cycle period fluctuations in red giants (Eddington and Plakidis 1929, Percy and Colivas 1999) which may be related to large convection cells in these stars.
2. Data and Analysis
We used visual observations from the AAVSO International Database (AID: Kafka 2016), and the AAVSO VSTAR time-series analysis package (Benn 2013), which includes both a Fourier analysis and a wavelet analysis routine. Stars (listed in Table 1) with sufficient observations in the AID were chosen for analysis from several sources, including Payne-Gaposhkin (1954), Houk (1963), and Kiss et al. (1999), among others. We have included three pulsating red supergiants (SG) for comparison. We have also included V Hya which has unusually-deep and stable LSP minima, and may be an eclipsing binary star (Knapp et al. 1999). The columns give the star name, the type (M, C, or SG), the starting JD (otherwise all the AID data were used) the pulsation period P, the LSP, the ratio of these, the mean, maximum, and minimum LSP amplitudes, and notes. The notes are as follows: pcs - sinusoidal phase curve; pcs: - possibly sinusoidal phase curve; pc? - phase curve uncertain, but possibly non-sinusoidal; pcst - phase curve sawtooth; dsp - data sparse; * - see section 3.12. The phase curve is a graph of magnitude versus phase, determined with VSTAR using the known period; it essentially folds all of the observations into one cycle. Note that the mean amplitude was determined by Fourier analysis, the maximum and minimum amplitude by wavelet analysis.
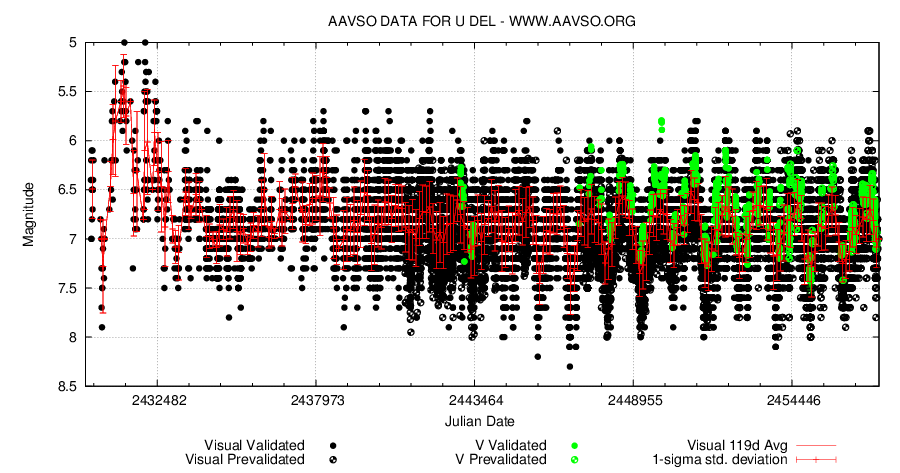
Figure 1 shows the long-term light curve of U Del. The visual observations have also been averaged in bins of 119 days (the pulsation period) to show the LSP more clearly.
3 Results
3.1 Lengths of LSPs
NWCS gave a range of 250 to 1400 days, primarily based on observations of stars in the Magellanic Clouds. Our study includes both short-period and longer-period stars in the Milky Way. The Galactic stars in Table 1 may have different properties than the low-metallicity stars in the Magellanic Clouds, studied by Wood and others. Excluding supergiants, our range is 479 to 2967 days. There may be stars with shorter or longer LSPs, presumably with pulsation periods shorter or longer than those in Table 1.
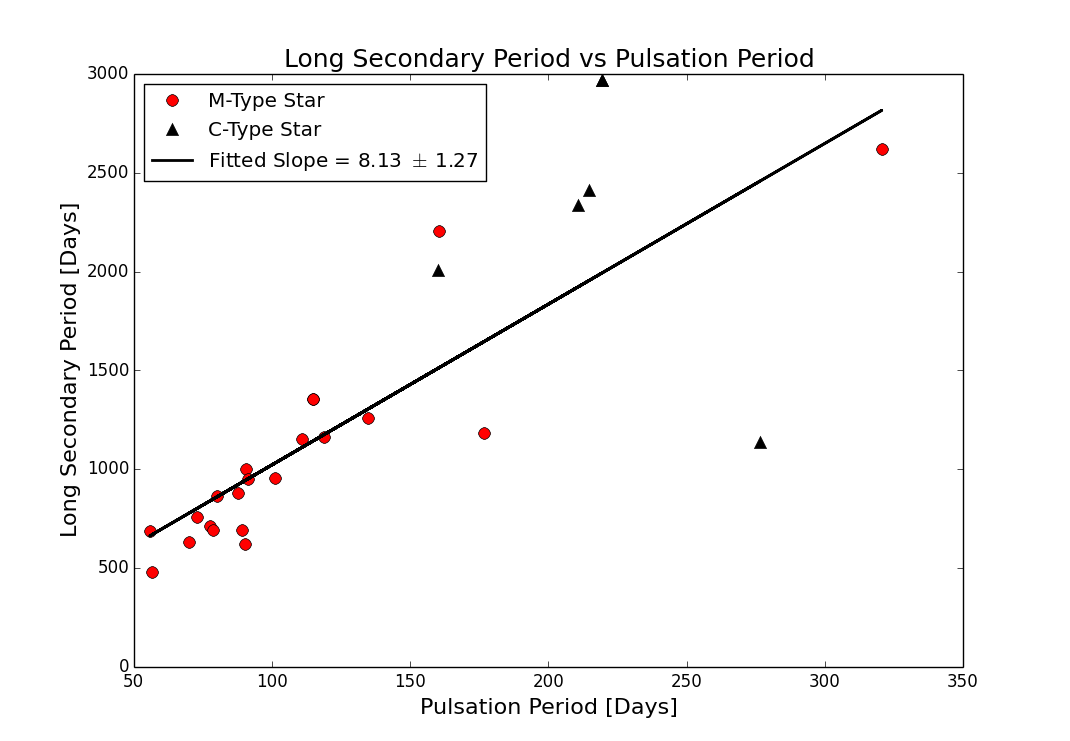
Figure 2 shows the relationship between the LSP and the excited pulsation period. The slope of the relationship is 8.1 1.3. The relationship may not be linear. The results for supergiants (section 3.2) suggest that the slope becomes shallower at longer periods. This may be because the fundamental period is more likely to be excited in longer-period stars; see Section 3.5.
3.2 LSPs in Red Supergiants
It is important to note that LSPs are also found in pulsating red supergiants (Kiss et al. 2006, Percy and Sato 2009); the LSP phenomenon seems to be continuous from class III to class II to class I stars. Kiss et al. (2006) used Fourier techniques to analyze visual measurements; Percy and Sato (2009) used self-correlation techniques to analyze similar datasets. There are about 10 stars for which the above-mentioned papers obtained consistent pulsation periods and LSPs; for these, the median value of LSP/P is 6.0 and the median LSP visual amplitude is 0.10 mag, similar to those in red giants. For red supergiants in the Large Magellanic Cloud, the median LSP/P is about 4, and the median V amplitude is about 0.08 (Yang and Jiang 2012). Kiss et al. (2006) concluded, on the basis of the Lorentzian envelopes of the peaks in the Fourier spectra, and the strong 1/f noise, that large convection cells play an important role in the behavior of these red supergiant stars.
3.3 The Amplitudes of the LSPs
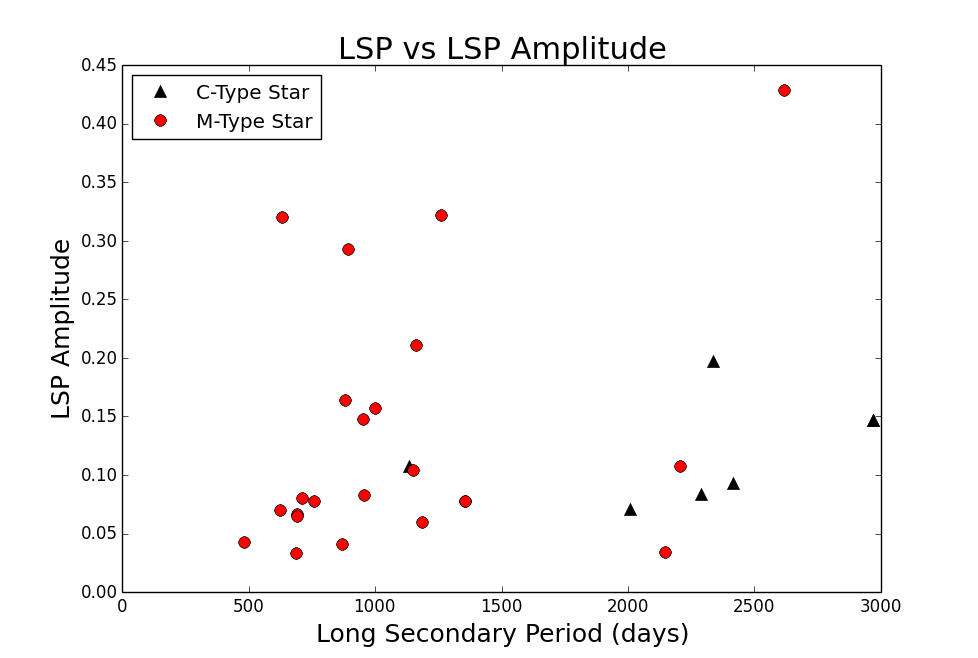
The median LSP amplitude for the stars in Table 1 is 0.10 for both the M stars and the C stars. There is no evidence that it varies with LSP (and therefore with the size and/or temperature of the star), according to Figure 3, which shows the LSP amplitude as a function of LSP. Note that we find LSPs in short-period pulsators such as RZ Ari, whose variability is best studied photoelectrically (Percy et al. 2008). Nicholls et al. (2010) show that the LSP velocity amplitude is constant, at a few km/s, over a very wide range of LSPs.
It is said that Mira stars do not have LSPs, but low-amplitude LSPs may be hidden by the large-amplitude pulsation, and by the complex Fourier spectra of these stars, which arise from the systematics in the time distribution of the observations, and from the stars’ random changes in period and amplitude. For instance: the Fourier spectra of AAVSO visual data on Mira stars tend to have strong one-cycle-per-year aliases at periods of a few thousand days (the possible values of the LSPs), and the noise level in the spectra exceeds 0.1 magnitude.
3.4 The Phase Curves of the LSPs
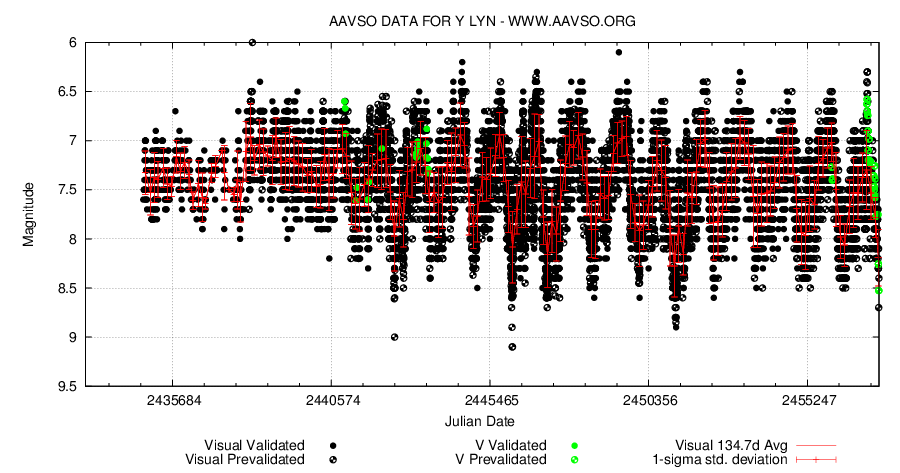
For most of the stars in our sample, the LSP phase curves are indistinguishable from sine curves, with the exception of a very small number which have sawtooth or possibly sawtooth shapes. The clearest example is Y Lyn (Figure 4). This figure shows the long-term light curve of Y Lyn; the visual observations have also been averaged in bins of 134.7 days (the pulsation period) to show the sawtooth shape of the LSP light curve more clearly. The other star with a distinctly saw-tooth phase curve is RV Lac. We note that both these stars have higher-than-average LSP amplitudes. The model of Soszyński and Udalski (2014) predicts a different shape for the phase curve; see section 4.
3.5 Is the LSP Always Ten Times the Fundamental Pulsation Period?
Some stars with LSPs pulsate in the fundamental mode, and others in the first overtone. Is the LSP always ten times the excited period, no matter which mode is excited?
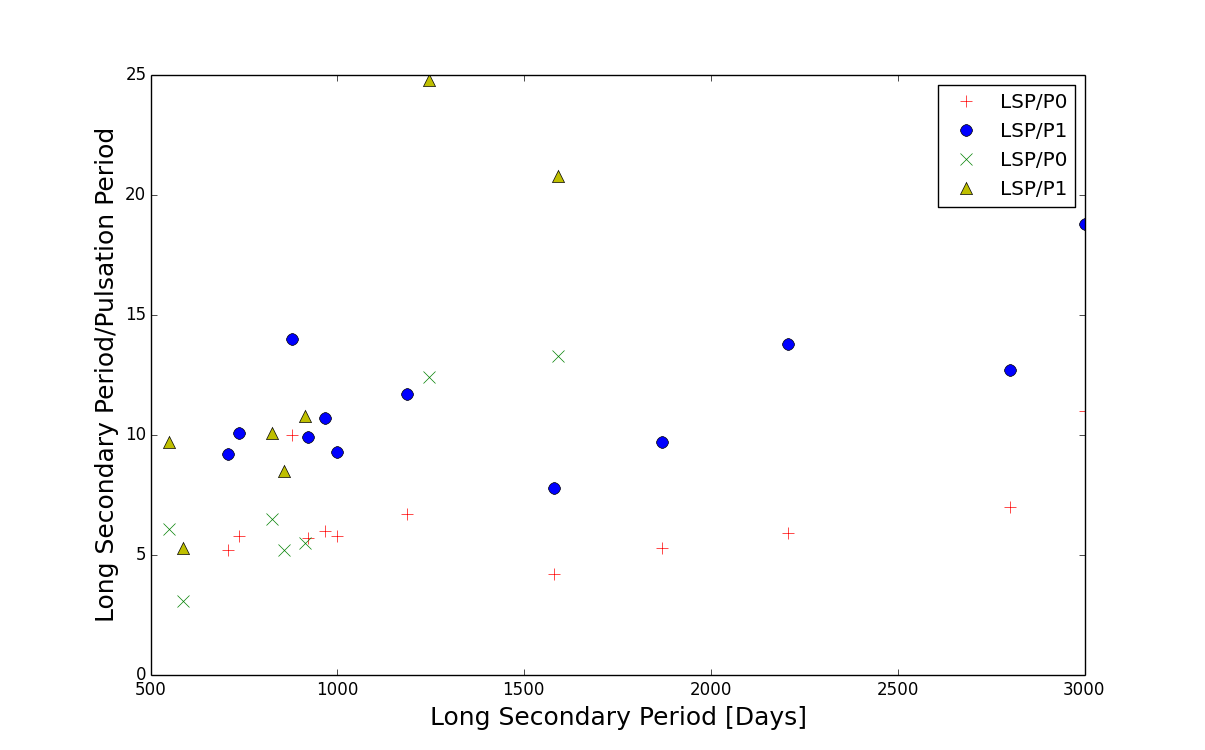
Fuentes-Morales and Vogt (2014) used the ASAS database to study 72 pulsating red giants. Of the stars which they identified as triply periodic (their Table 2), eight appear to have an LSP and a fundamental (P0) and a first overtone (P1) radial period present. In three of these, LSP/P1 is closer to 8.1 than LSP/P0; in two of these, LSP/P0 is closer, and in three of them, both ratios are equidistant from 8.1. In Kiss et al. (1999)’s list of triply-periodic stars, there are nine with LSP, P0 and P1. In six cases, LSP/P1 is closer to 8.1, in two, LSP/P0 is closer, and in one case, they are equidistant from 8.1. In our sample, there are four stars (RX Boo, RS Cam, TX Dra, and X Her) which appear to have these three periods present. In three, LSP/P0 is closer to 8.1; in the other, LSP/P1 is closer to 8.1. We conclude that, although LSP is slightly more often about 8.1 times the first overtone radial period, this is not always the case. This may explain some of the scatter in Figure 2.
A different approach is to consider a plot (Figure 5) of LSP/P0 and LSP/P1 versus LSP. For stars with LSP less than about 1500 days, LSP/P0 is about 5-6, LSP/P1 is about 9-11. This suggests that the LSP is generally about 5-6 times the fundamental period. For stars with LSP greater than 1500 days, the behavior is much less consistent.
3.6 Uniqueness of the LSP
Some theories of the LSP suggest that there may be two or more long timescales in a pulsating red giant, such as the turnover time of a bright or dark convective cell, and the rotation period of the star. There are already four timescales which we have identified in our sample: (1) the pulsation period; (2) the LSP; (3) the timescale for increase and decrease of the amplitude of the pulsation period; and (4) the timescale for increase and decrease of the amplitude of the LSP. As noted below, timescale (3) is not the same as the LSP.
We have used Fourier analysis to look for stars in our sample which might have more than one LSP, but there are none in which a second LSP is significantly above the noise level. For example: the LSP light curves in Figures 1 and 4 appear to be monoperiodic.
3.7 LSP Period Stability
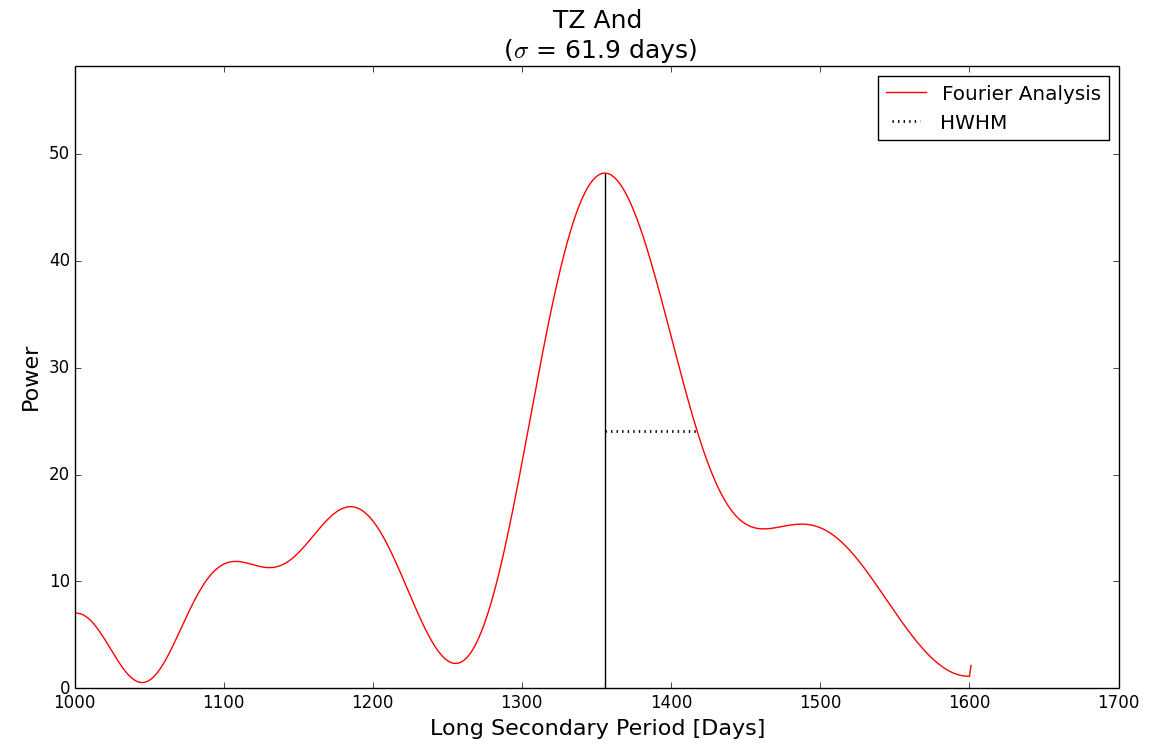
For most of the stars in Table 1 – those for which the observations are both dense and sustained – the half-width at half-maximum errors in determining the LSP are 3 to 5 percent. Figure 6 shows the Fourier spectrum of TZ And, showing how the HWHM uncertainly of the LSP was determined. We adopt 3 percent as a reasonable intrinsic uncertainty caused by the finite length of the dataset and the scatter in the visual observations. We then used wavelet analysis to study changes in the LSP with time. We did not find any stars for which LSP varied by more than three times the error i.e. by 10 percent or more, over the timespan of the observations, which is typically 25,000 days. A possible exception may be Z Eri, for which the mean LSP is 722 days, the range is 695 to 740 days, and the formal error of the LSP is only 7 days. This error seems unreasonably low, however, being only 1 percent.
3.8 LSP Amplitude Stability
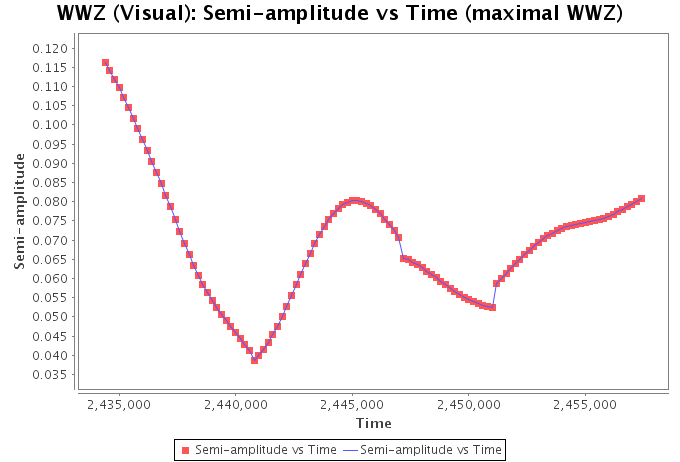
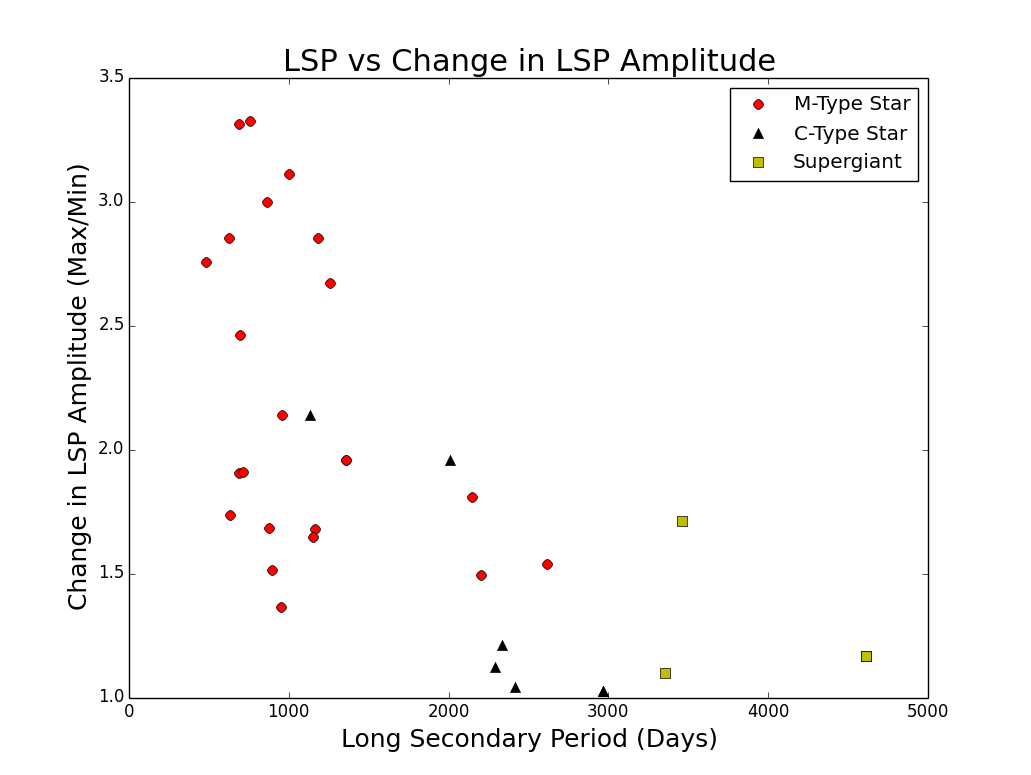
Percy and Abachi (2013) showed that, for a small sample of red giants with LSPs, the amplitudes of most of the LSPs varied by a factor of up to 2, on a time scale of typically 30 LSPs or greater. Figure 7 shows the amplitude of the LSP of RT Cnc as a function of time. The amplitude rises and falls on a time scale of about 20 LSPs. This is true of the other stars in Table 1, as it was for the LSPs of the stars studued by Percy and Abachi (2013). It is difficult to determine the time scale of the LSP amplitude variability because of its length, but one way of doing so is shown in Figure 8, which plots a measure of the change in LSP amplitude against the LSP. Stars with longer LSPs change less in amplitude, presumably because, for these stars, the time scale of amplitude variability, being tens of times greater than the LSP itself, is longer than the timespan of our observations. This interpretation of Figure 8 is therefore consistent with the results of Percy and Abachi (2013).
3.9 Correlation of Pulsation Amplitude with LSP Phase
NWCS note that the primary pulsation is visible in the light curve at all times throughout the LSP and the primary period does not significantly change with LSP phase. Because the cycles of increase and decrease of the primary pulsation period’s amplitude vary on a median time scale of 44 periods (Percy and Abachi 2013), whereas the LSP is about 8.1 times the excited pulsation period, it follows that the pulsation period’s amplitude is not correlated with the LSP phase. For instance: for W Ori, the cycles of pulsation amplitude increase and decrease are about 4500 days, whereas the LSP is about half that.
3.10 Oxygen (M) Stars versus Carbon (C) Stars
In our previous studies of red giants, Percy and Yook (2014) identified one possible difference in pulsational behavior between oxygen (M) stars and carbon (C) stars, namely that, in C stars, amplitude changes correlated with period changes, whereas this was not true for M stars. We have therefore looked in our database to see whether there are any differences between M and C stars in the LSPs or their amplitudes. In doing this, we have been careful to compare stars with similar periods. Carbon stars have longer pulsation periods, on average, than oxygen stars, because the carbon-star phenomenon is associated with a more advanced stage of evolution, when the star is larger and cooler. Figures 2, 8, and 9 show no obvious differences between the behavior of the two classes of star.
3.11 LSP Color to Light Variations
Derekas et al. (2006) pointed out that, on the basis of their observations, the relative color amplitudes were similar, for the LSPs, to those for the pulsation period, but this was not true for stars with ellipsoidal variability. Percy et al. (2008) used merged AAVSO and robotic telescope photometry to show that the same was true for the LSPs of 12 small-amplitude pulsating red giants (EG And, RZ Ari, Psi Aur, BC CMi, TU CVn, FS Com, Her, V642 Her, 30 Her, Y Lyn, UX Lyn, TV Psc), with the possible exception of EG And, which appears to be a genuine symbiotic spectroscopic binary (their figures 7 and 8). Specifically: these stars had a visual amplitude about twice the red amplitude which, in turn, was about twice the near-infrared amplitude; they are brighter when hotter. These relative amplitudes are slightly larger, on average, than the V/I ratios shown in Figure 4 of Soszyński and Udalski (2014), but are within the same range. And the metallicities of the Galactic and LMC stars are quite different.
3.12 Notes on Individual Stars
T Ari: This star, because of its large amplitude, is classified as a Mira star.
RX Boo: There may also be a 372.99-day period.
Y CVn: The pulsation period is uncertain, but is most likely 160 days.
AW Cyg: The pulsation period (most likely 358 days) and the LSP are uncertain.
RY Dra: The 276.7-day pulsation period is consistent with the DIRBE photometry (Price et al. 2010), and the 1135.6-day LSP in the AAVSO data seems secure. But the DIRBE data suggests that the LSP may be longer.
g Her: There may also be a 61.21-day pulsation period.
V Hya: This is a peculiar pulsating red giant with an LSP (6907 days) which has a large amplitude (1.13 mag), a V-shaped phase curve, and a stable LSP and LSP amplitude – very much like the RVB star U Mon. Knapp et al. 1999) suggest that this is a binary in which the secondary component is surrounded by dust.
4 Ser: The pulsation period is uncertain, but is most likely 111 days.
V UMi: There may also be a 125.45-day pulsation period.
4. Discussion
Numerous possible explanations for the LSPs have been proposed and examined but, as NWCS have described, most have not been successful. These include radial or non-radial pulsation – unless there is some non-standard pulsation mode yet to be discovered. Standard binary models fail to explain the highly non-random distribution of velocity-curve amplitudes, shapes, and orientations (but the situation is reminiscent of the “Barr effect” (Percy 2015) in which the velocity curves of spectroscopic binary stars were distorted by mass transfer).
Saio et al. (2015) have proposed that oscillatory convective modes are a possible explanation for the LSPs. The timescales are consistent with the LSPs, assuming that the modes are actually excited. The amplitudes, shapes, and color dependences of the phase curves are in reasonable agreement with observations. We would need some explanation for the variable amplitudes of the LSPs. Saio et al. (2015) state that there is a minimum luminosity for the presence of oscillatory convective modes. We find LSPs in many less-luminous stars, with amplitudes comparable to those in more luminous ones.
Another interesting and still-viable explanation is the rise and fall of giant convective cells, which are known to occur in cool stars (Stothers 2010). The time scales of rise and fall are similar to those of LSPs, but we must remember that these stars are also rotating, so this phenomena would be modulated by the rotation period. We do not find evidence for two different LSPs in the same star (section 3.6). Also: we would need an explanation for the variable amplitude of the LSPs.
Another possible explanation is the effect of a dusty cloud orbiting the red giant with a low-mass companion in a close, circular orbit (Soszyński and Udalski 2014). The period of variability would be the orbital period. The authors suggest that the red giant would be co-rotating with the companion, so the periods would be comparable with those in Figure 9. The period would be a year or several, and would increase with the size of the star. The phase curves (their Figures 5 and 6) are close to sinusoidal, except for the one for i = 90 degrees, which is vaguely sawtooth, and also has the largest amplitude. We find sawtooth phase curves in two stars with large phase-curve amplitudes. The amplitude of the LSP might change if the dusty cloud was periodically depleted and replenished. It seems rather improbable that a third of red giants should have such configurations, though we should remember that the not-uncommon LSPs in RV Tauri stars (the so-called RVb stars) are thought to be due to the effect of a binary companion (Percy 1993, Waelkens and Waters 1993). Derekas et al. (2006) noted that the period-luminosity relation for LSPs overlapped with that for known (eclipsing) binary stars, which was an argument for a binary explanation. Soszyński and Udalski (2014) determined the shapes of the light curves which would result from their model. Our phase curves do not seem to agree with theirs, though ours are rather indistinct because of the lower accuracy of the visual observations, and the presence of the pulsational variability.
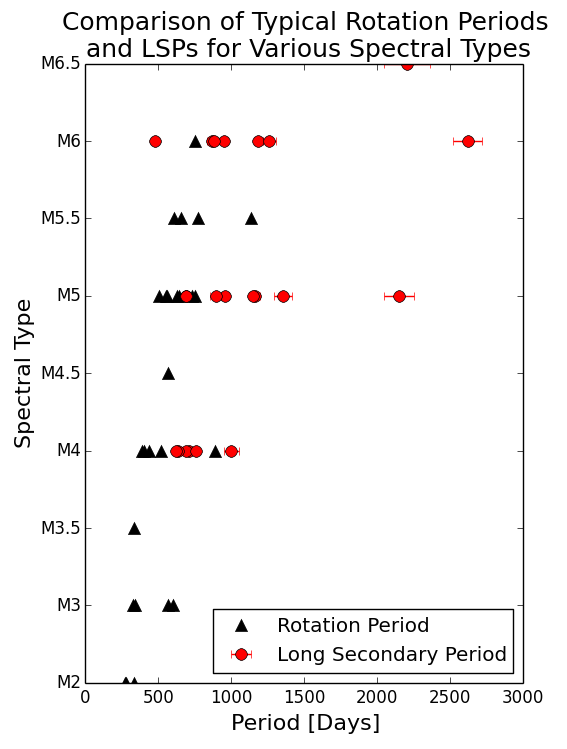
Yet another explanation would be the presence of a large, hot/bright or cool/dark convective cell, with a lifetime of a few tens of LSPs. This would result in rotational variability whose amplitude varied, as bright convective cells grew and decayed. (We note, however, that Stothers (2010) estimates the turnover timescale as being closer to LSP than to 20-30 LSPs.) The rotation periods of red giants can be estimated from their projected rotational velocities (v sin i) (Zamanov et al. 2008) and their radii (Zamanov et al. 2007) using the formula P = 50.6R/v where P is the period in days, R is the radius in solar units, and v is the equatorial rotational velocity in km/s. For stars in the range M1III to M6III, the rotational periods range mostly from 500 to 1000 days. Figure 9 shows the LSP and the rotation period of stars as a function of spectral type. The rotation periods are estimated as described above. They are highly uncertain, as a result of the uncertainty in v sin i and R, and the unknown value of sin i. We note, however, that Olivier and Wood (2003) obtained upper limits to rotation velocities in nearby stars with LSPs, and found them to be too slow for rotation of a (single) spot to yield the observed LSP values. Figure 9 suggests that the rotation is too fast.
The general similarity, however, between the rotation period and the LSP, and the stability of the LSP is consistent with a rotational origin for the LSP. Whatever causes the LSP amplitude variations must have a timescale which is proportional to LSP.
5. Conclusions
We have used systematic, sustained visual observations from the AAVSO International Database, and the AAVSO time-series analysis software package to study the LSPs in 27 red giants. The LSPs are, on average, 8.1 1.3 times the excited pulsation period, and the median visual amplitude is 0.1, independent of the LSP. The LSPs are stable over many decades, but the amplitudes rise and fall on a time scale of a few tens of LSPs. The LSP phase curves are not well-defined, but at least two appear to have a sawtooth shape. The similarity between the LSP and the rotation period of the star suggests that the LSP phenomenon may be due to rotational variability, modulated by a large bright or dark convective cell, or by obscuring material near the photosphere. We also note that visual observations, despite their lower accuracy, are able to delineate the long-term behavior of these stars because they are sustained over up to a century. Whether or not the rotational hypothesis is correct, we believe that we have added a few more “knowns” to the NWCS list, and brought us a bit closer to solving this longstanding mystery.
Acknowledgements
We thank the AAVSO observers who made the observations on which this project is based, the AAVSO staff who archived them and made them publicly available, and the developers of the VSTAR package which we used for analysis. We are very grateful to Professor Peter Wood for reading and commenting on a draft of this paper. We acknowledge and thank the University of Toronto Work-Study Program for financial support. JRP thanks co-author ED, an astronomy and physics (and English) major, for carrying out this project so professionally. ED thanks co-author JRP for the opportunity to work on this project. This project made use of the SIMBAD database, maintained in Strasbourg, France.
References
Benn, D. 2013, VSTAR data analysis software (http://www.aavso.org/node/803).
Derekas, A., Kiss, L.L., Bedding, T.R., Kjeldsen, H., Lah, P., and Szabó, Gy.M. 2006, Astrophys. J. Letters, 650, L55.
Eddington, A.S. and Plakidis, S. 1929, Mon. Not. Roy. Astron. Soc., 90, 65.
Fuentes-Morales, I. and Vogt, N., 2014, Astron. Nachr., 335, 1072.
Houk, N. 1963, Astron. J., 68, 253.
Kafka, S. 2016, observations from the AAVSO International Database (https://www.aavso.org/aavso-international-database
Kiss, L.L., Szatmáry, K., Cadmus, R.R., Jr., and Mattei, J.A. 1999, Astron. Astrophys., 346, 542.
Kiss, L.L., Szabó, G.Y. and Bedding, T.R. 2006, Mon. Not. Roy. Astron. Soc., 372, 1721.
Knapp, G.R., Dobrovolsky, S.L., Ivesic, Z., Young, K., Crosas, M., Mattei, J.A., Rupen, M.P. 1999, Astron. Astrophys., 351, 97.
Nicholls, C.P., Wood, P.R., Cioni, M.-R., and Soszyński, I. 2009, Mon. Not. Roy. Astron. Soc., 399, 2063 (NWCS).
Nicholls, C.P., Wood, P.R. and Cioni, M.-R.L. 2010, Mon. Not. Roy. Astron. Soc., 405, 1770.
O’Connell, D.J.K. 1933, Bull. Harvard Obs., #893, 19.
Olivier, E.A. and Wood, P.R. 2003, Astrophys. J., 584, 1035.
Payne-Gaposchkin, C. 1954, Harvard Annals. 113, 189.
Percy, J.R. 1993, in Luminous High-Latitude Stars, ed. D.D. Sasselov, ASP Conference Series 45, 295.
Percy, J.R., Desjardins, A., Yu, L. and Landis, H.J. 1996, Publ. Astron. Soc. Pacific, 108, 139.
Percy, J.R. and Colivas, T. 1999, Publ. Astron. Soc. Pacific, 111, 94.
Percy, J.R., Wilson, J.B. and Henry, G.W. 2001, Publ. Astron. Soc. Pacific, 113, 983.
Percy, J.R. and Bakos, G.A. 2003, in The Garrison Festschrift, ed. Gray, R.O., Corbally, C. and Philip, A.G.D., L. Davis Press, 49.
Percy, J.R., Mashintsova, M., Nasui, C.O., Seneviratne, R., and Henry, G.W. 2008, Publ. Astron. Soc. Pacific, 120, 523.
Percy, J.R. and Sato, H. 2009, J. Roy. Astron. Soc. Canada, 103, 11.
Percy, J.R. and Abachi, R. 2013, J. Amer. Assoc. Var. Star Observers, 41, 1.
Percy, J.R. and Yook, J.Y. 2014, J. Amer. Assoc. Var. Star Observers, 42, 245.
Percy, J.R. and Huang, D.J. 2015, JAAVSO, 43, 118.
Percy, J.R. 2015, J. Roy. Astron. Soc. Canada, 109, 266.
Price, S.D., Smith, B.J., Kuchar, T.A., Mizuno, D.R., and Kraemer, K.E. 2010, Astrophys. J. Suppl., 190, 203.
Saio, H., Wood, P.R., Takayama, M., and Ita, Y., 2015, Mon. Not. Roy. Astron. Soc., 452, 3863.
Soszyński, I. and Udalski, A. 2014, Astrophys. J., 788, 13-6.
Stothers, R.B. 2010, Astrophys. J., 725, 1170.
Waelkens, C. and Waters, L.B.F.M. 1993, in Luminous High-Latitude Stars, ed. D.D. Sasselov, ASP Conference Series 45, 219.
Wood, P.R. et al. 1999, in IAU Symp. #191, Asymptotic Giant Branch Stars, ed. T. Le Bertre, A. Lebre, and C. Waelkens, Cambridge: Cambridge University Press, 151.
Wood, P.R. 2000, Publ. Astron. Soc. Australia, 17, 18.
Yang, M. and Jiang, B.W. 2012, Astrophys. J., 754, 35.
Zamanov, R.K., Bode, M.F., Melo, C.H.F., Bachev, R., Gomboc, A., Stateva, I.K., Porter, J.M., and Pritchard, J., 2007, Mon. Not. Roy. Astron. Soc., 380, 1053.
Zamanov, R.K., Bode, M.F., Melo, C.H.F., Stateva, I.K., Bachev, R., Gomboc, A., Konstantinova-Antova, R., and Stoyabov, K.A., 2008, Mon. Not. Roy. Astron. Soc., 390, 377.
| Star | SpT | JD(start) | P(d) | LSP | LSP/P | A/Amax/Amin | Notes |
|---|---|---|---|---|---|---|---|
| TZ And | M | 2440093 | 114.8 | 1355.1 | 11.8 | 0.078 0.096 0.049 | pc?, dsp |
| RZ Ari | M | all | 56.5 | 479.4 | 8.48 | 0.043 0.102 0.037 | pc? |
| T Ari | M | 2415000 | 320.6 | 2617.8 | 8.17 | 0.429 0.485 0.315 | pc?, * |
| RX Boo | M | all | 160.3 | 2205.1 | 13.76 | 0.108 0.136 0.091 | pc?, * |
| RS Cam | M | 2443500 | 90.5 | 999 | 11.04 | 0.157 0.255 0.082 | pc: |
| U Cam | C | 2425400 | 219.4 | 2967.4 | 13.53 | 0.147 0.151 0.147 | pcs |
| IX Car | SG | 2442500 | 371.5 | 4608.3 | 12.40 | 0.188 0.249 0.213 | pcs:, dsp |
| AA Cas | M | 2437500 | 80.1 | 866.8 | 10.82 | 0.041 0.066 0.022 | pc? |
| SS Cep | M | 2432500 | 101.1 | 955.2 | 9.45 | 0.083 0.137 0.064 | pcs: |
| RT Cnc | M | all | 89.3 | 691.7 | 7.75 | 0.067 0.116 0.035 | pc? |
| FS Com | M | 2440000 | 55.7 | 688.7 | 12.36 | 0.033 0.080 0.042 | pc? |
| Y CVn | C | 2430000 | 160 | 2008.9 | 6.88 | 0.071 0.096 0.049 | pcs, * |
| AW Cyg | C | 2431500 | 209: | 2289: | 6.40 | 0.084 0.091 0.081 | pcs:, * |
| BC Cyg | SG | 2437500 | 698.8 | 3459.6 | 4.95 | 0.128 0.171 0.010 | pc? |
| U Del | M | all | 119.0 | 1162.8 | 9.77 | 0.211 0.257 0.153 | pcs |
| RY Dra | C | 2432500 | 276.7: | 1135.6: | 4.10 | 0.108 0.137 0.064 | pcs, * |
| TX Dra | M | 2431702 | 77.5 | 711.8 | 9.18 | 0.080 0.193 0.101 | pcs:, dsp |
| RW Eri | M | all | 91.4 | 952.0 | 10.42 | 0.148 0.172 0.126 | pcs: |
| Z Eri | M | 2430000 | 78.5 | 692.4 | 8.82 | 0.065 0.197 0.080 | pc? |
| TU Gem | C | all | 214.6 | 2413.7 | 11.25 | 0.093 0.101 0.097 | pcs: |
| g Her | M | 2430000 | 87.6 | 878.7 | 10.03 | 0.164 0.222 0.132 | pcs, * |
| X Her | M | 2430240 | 176.6 | 1185.3 | 6.71 | 0.060 0.134 0.047 | pc? |
| V Hya | C | all | 531.4 | 6907.4 | 13.00 | 1.132 1.160 1.092 | * |
| RV Lac | M | all | 70.0 | 632.6 | 9.04 | 0.320 0.453 0.261 | pcst |
| Y Lyn | M | all | 134.7 | 1258.7 | 9.34 | 0.322 0.398 0.149 | pcst |
| W Ori | C | 2430000 | 210.7 | 2335.1 | 11.08 | 0.197 0.213 0.176 | pc? |
| SU Per | SG | 2432500 | 469.0 | 3355.7 | 7.16 | 0.115 0.122 0.111 | pc? |
| 4 Ser | M | all | 111 | 1151.2 | 13.51 | 0.104 0.117 0.071 | pcsa, *: |
| ST UMa | M | 2430000 | 90.3 | 623.1 | 6.90 | 0.070 0.117 0.041 | pc? |
| V UMi | M | 2430644 | 72.9 | 757.3 | 18.7 | 0.078 0.103 0.031 | pcs:, * |