22institutetext: Department of Physics, National University of Singapore, 2 Science Drive 3, 117551, Singapore
22email: pengkian@physics.org (PKT); phyck@nus.edu.sg (CK)
Characterization of very narrow spectral lines
with
temporal intensity interferometry
Abstract
Context. Some stellar objects exhibit very narrow spectral lines in the visible range additional to their blackbody radiation. Natural lasing has been suggested as a mechanism to explain narrow lines in Wolf-Rayet stars. However, the spectral resolution of conventional astronomical spectrographs is still about two orders of magnitude too low to test this hypothesis.
Aims. We want to resolve the linewidth of narrow spectral emissions in starlight.
Methods. A combination of spectral filtering with single-photon-level temporal correlation measurements breaks the resolution limit of wavelength-dispersing spectrographs by moving the linewidth measurement into the time domain.
Results. We demonstrate in a laboratory experiment that temporal intensity interferometry can determine a 20 MHz wide linewidth of Doppler-broadened laser light, and identify a coherent laser light contribution in a blackbody radiation background.
Conclusions.
Key Words.:
Instrumentation: Interferometers – Line: Identification – Techniques: Spectroscopic1 Narrow emission lines and astrophysical lasers
Some spectral lines in the visible range emitted from stellar systems like Car have a linewidth that is hard to resolve with high resolution () astronomical spectrographs like the Keck High Resolution Echelle Spectrometer (Griest et al., 2010). This suggests either very low temperatures of the emission medium, or a different mechanism like stimulated emission, which can lead to optical emission much narrower than the participating atomic or molecular transition (Schawlow & Townes, 1958). Following first laboratory demonstrations of maser and laser radiation (Maiman, 1960; Javan et al., 1961) and the detection of strong interstellar microwave emission from molecular gas clouds (Weaver et al., 1965), natural non-visible lasers from astrophysical sources were proposed to be responsible for this emission (Menzel, 1970; Varshni & Nasser, 1986).
Natural stellar laser candidates in the visible range are expected to have a spectral linewidth around 10 MHz (Johansson & Letokhov, 2005; Dravins & Germanà, 2008; Roche et al., 2012) that cannot be resolved by conventional astronomical spectrographs. Therefore, alternative spectroscopical techniques like heterodyne spectroscopy (Hale et al., 2000; Sonnabend et al., 2005; Dravins & Germanà, 2008) or, as we investigate in this paper, temporal photocorrelation spectroscopy, may help to better understand the nature of these narrow emission lines or even verify experimentally the presence of a natural lasing mechanism in the visible range.
2 Intensity interferometry for time domain spectroscopy
Intensity interferometry was used to investigate the spatial coherence properties of starlight to infer their angular diameter (Hanbury-Brown, 1974), but first demonstration experiments were carried out on spectral lines from a Mercury gas discharge lamp (Hanbury-Brown & Twiss, 1958). In essence, normalized intensity correlations
| (1) |
are recorded as a function of the time difference by evaluating photodetection events from detectors observing the same light source. For stationary light of a single polarization, the normalized intensity correlation is related to the normalized (electrical) field correlation (Mandel & Wolf, 1995) via
| (2) |
The Wiener-Khinchin theorem (Wiener, 1930; Khinchin, 1934) links the field correlation to the spectral power density through a Fourier transform :
| (3) |
Therefore – within the limits of reconstructing the phase of the complex from via (2) – it is possible to extract information about the spectral power density of the light source from a measured intensity correlation . A narrow spectral distribution of width will result in a with a characteristic time scale .
The width of narrow spectral lines can therefore be measured in the time domain, overcoming the resolving power of wavelength-dispersive instruments like spectrographs or narrow-band interference filters. Note, however, that this does not allow determination of the absolute spectral position of a line, since a frequency shift of a narrow distribution results in a complex oscillating term in , but leaves unchanged due to the modulus in (2).
In stellar light sources, narrow spectral lines tend to appear against a large background of blackbody radiation. A direct measurement of the second order correlation function is therefore difficult, because the signal is dominated by the blackbody contribution with a very short coherence time on the order of s. Therefore, adequate preliminary filtering has to suppress the thermal background to a level that time domain spectroscopy can be carried out. It is also necessary that the light exhibits some non-Poissonian intensity fluctuations, since for light with Poissonian statistics, e.g. coherent laser light, the intensity correlation is flat () (Glauber, 1963) and has no structure that would reveal any spectral properties.
In this work, we simulate the characteristic spectrum of natural stellar laser candidates in the visible range by combining phase-randomized artificially Doppler-broadened laser light with spectrally wide blackbody radiation. We then characterize the narrow spectral line by time-resolved intensity interferometry after passing the composite light through a diffraction grating and two etalons to suppress the blackbody contribution.
3 Experimental Setup
Our experimental setup is illustrated in Fig. 1.
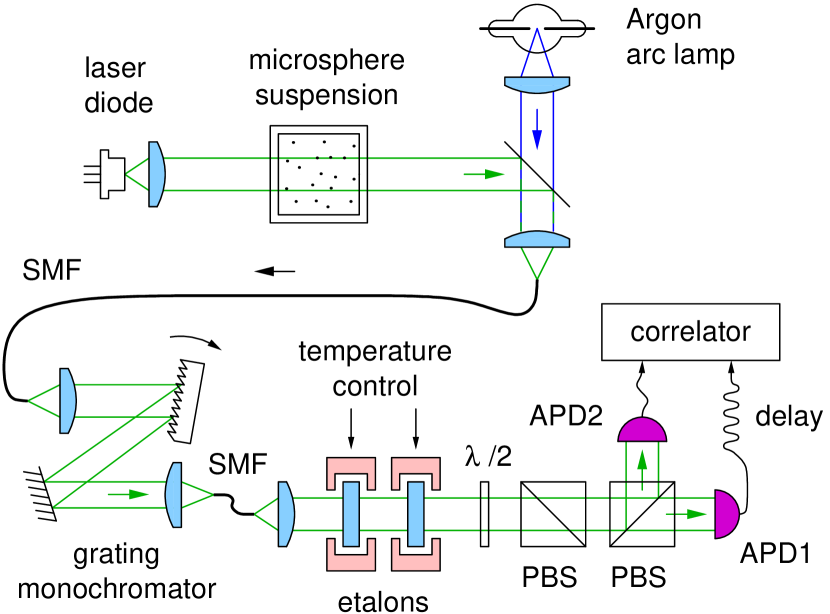
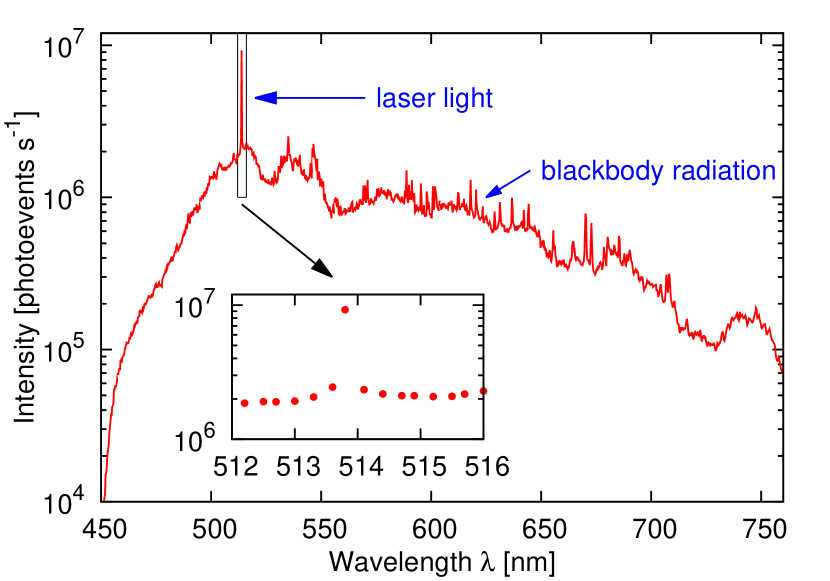
Composite test light is prepared by combining light from a laser diode (Osram PL520, mW) at a wavelength of =513.8 nm with blackbody radiation from an Argon arc lamp with an effective blackbody temperature of around 6000 K on an uncoated microscope glass slide. This combines approximately 4 % of the incident laser light with 92 % of the Argon arc lamp output. The resulting spectrum recorded with a grating spectrometer of approximately 0.12 nm resolution is shown in Fig. 2.
The very narrowband laser light is Doppler-broadened by passing it through a cuvette containing a suspension of standard mono-disperse polystyrene microspheres of 0.2 m diameter in water, following Dravins et al. (2015). These microspheres serve as scattering centers undergoing Brownian motion at room temperature. The resultant phase randomization causes the laser light to exhibit pseudo-thermal photon bunching behavior (Martienssen & Spiller, 1964; Arecchi, 1965; Scarl, 1966, 1968; Estes et al., 1971; Hard et al., 1977). The coherence properties of light leaving the suspension depend on the temperature of the suspension, the viscosity (ratio of water to microspheres), and beam focus (Dravins & Lagadec, 2014); these parameters were not fully characterized, but a combination of a beam waist of roughly 1 mm, with beads-concentration of approximately 0.1% solids [weight/volume] at room temperature (23 degrees Celsius) lead to Doppler-broadened light we could investigate with our technique.
The microsphere suspension with its milky appearance reduces the intensity of the laser light by over two orders of magnitude, which is too low to allow proper identification against the blackbody radiation background in a spectral measurement with our grating spectrometer.
To identify the laser light admixture to the blackbody radiation, the test light is first coupled into a single mode fibre (Thorlabs 460HP). After collimation, the light passes through a monochromator based on a reflective diffraction grating (1200 lines/mm, blazed for 500 nm). The monochromator is calibrated to the 546.1 nm line from a Mercury discharge lamp where it shows a transmission bandwidth (full width at half maximum, FWHM) of about 0.12 nm.
A second single mode fiber enforces spatial coherence again, before the light passes through a pair of temperature-tuned plane-parallel solid etalons made of fused silica (Suprasil311) with a refractive index =1.4616, and coatings of a nominal reflectivity % at . This corresponds to an estimated finesse . The etalons have thicknesses of =0.5 mm and =0.3 mm, corresponding to a free spectral range of 205 GHz and 342 GHz, respectively. Their temperatures are stabilized to overlap the transmission maxima at the laser wavelength. Both etalons, in conjunction with the diffraction grating, suppresses most of the blackbody background (Tan et al., 2014), transmitting only an optical bandwidth GHz (FWHM), corresponding to a coherence time ns. This filter combination has an effective spectral resolving power fo about , which is comparable to current astronomical spectrographs (Griest et al., 2010).
The filtered light is polarized by a first polarizing beam splitter (PBS), and distributed by a second PBS into a pair of actively quenched Silicon avalanche photodetectors (APD) with a timing jitter of about 40 ps (Tan et al., 2016). Photodetection rates are balanced by rotating the first PBS which is preceeded by a half wave plate to maximize the count rates. Coincidence photoevents are recorded using a fast digital oscilloscope. The photodetectors exhibit a dark count rate of 50 events/sec, predominantly from the detector thermal noise, which is negligible in the subsequent coincidence measurements. The coincidence histograms were normalized to obtain a for large , because the oscilloscope had an unknown dead time for histogram processing that made a direct normalization impossible.
4 Identifying Emission Linewidth
In a first experiment, we want to measure the linewidth of the laser light that was Doppler-broadened by random scattering in the microsphere suspension on a background of blackbody radiation. Both broadened laser light and blackbody radiation resulted in about photoevents per second each behind the filter stack formed by gratings, etalons and polarization filters.
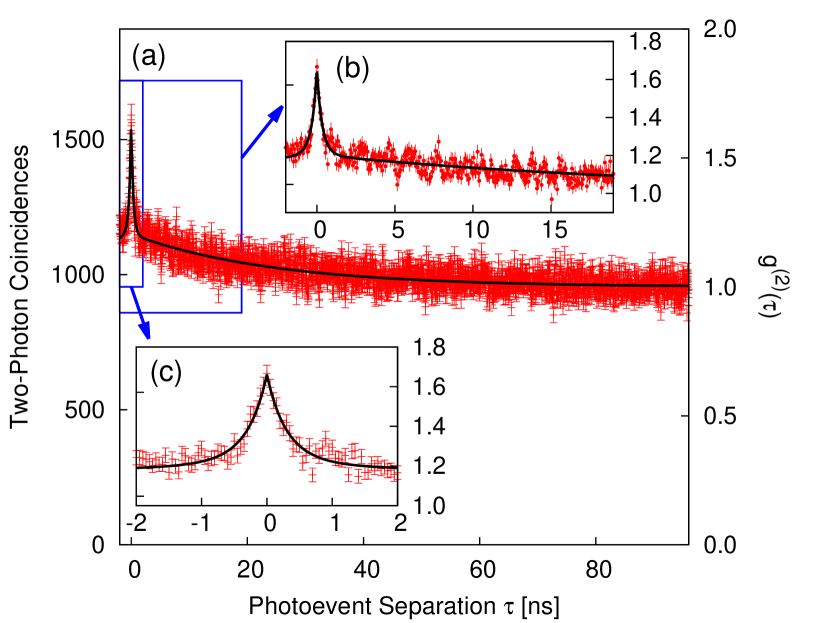
The histogram of two-photon coincidences as a function of photodetection event separation is shown in Fig. 3, with a total of coincidences recorded for -2 ns 96 ns. For time differences ¡1 ns, the sharp peak due to filtered blackbody radiation is visible, while on a longer time scale, the Doppler-broadened laser contribution due to phase randomization in the microsphere suspension leads to photon bunching with a slower decay constant.
A single Lorentzian frequency distribution
| (4) |
around a center frequency with a linewidth (FWHM) of leads via (2) and (3) to a normalized correlation function
| (5) |
For a mixed spectral distribution , the intensity correlation function can be obtained in a similar way. If the two contributions from blackbody and laser light are assumed to be mutually incoherent, the spectral power densities and can be added,
| (6) |
and the resulting intensity correlation is given by
| (7) |
with indicating the inverse Fourier transform. Assuming now two Lorentzian distributions and according to (4) with amplitudes , , coherence times , , and center frequencies , , respectively, the Fourier transformation can easily be carried out, leading to
For , the oscillating term vanishes, and (4) becomes a sum of three exponential decays on top of that can readily explain the correlation function in Fig. 3. There, the decay for large is dominated by the larger coherence time . The small peak near is a combination of two fast decays, one given by the correlation of the blackbody contribution alone, the other one by the mixed term with about twice the decay time for . A fit of the observed correlation function to the model (4) over photoevent separations of leads to ns, ns, , and . However, the relatively large reduced variance indicates that model (4) is too simple, and does e.g. not capture the oscillatory contributions in the measured visible in Fig. 3(b). The long coherence time corresponds to a linewidth of MHz, comparable to the ones predicted for natural stellar lasers (Dravins & Germanà, 2008).
The described technique thus allows linewidth measurements of extremely narrow spectral lines, limited only by the ability to record a sufficiently large number of photons to construct a coincidence histogram. The upper bound of a linewidth measurement with this technique is given by the time resolution of the photodetectors and time-tagging mechanism (in our case a few GHz). However, the phase uncertainty of , if inferred from in (2), requires further assumptions for a direct reconstruction of a spectrum via (3).
5 Identifying Coherent Light
In a second experiment, we try to identify the presence of coherent laser emission by a quantitative evaluation of the photobunching signature . For this, we remove the microsphere suspension, and record the temporal correlation measurement for different admixture levels of attenuated laser radiation to a blackbody radiation background of about photoevents/sec after the filter stack. Assuming a Lorentzian spectral distribution (4), the fit of the observed second order correlation leads to a a coherence time =0.310.01 ns, in agreement with obtained from the fit in the first experiment.
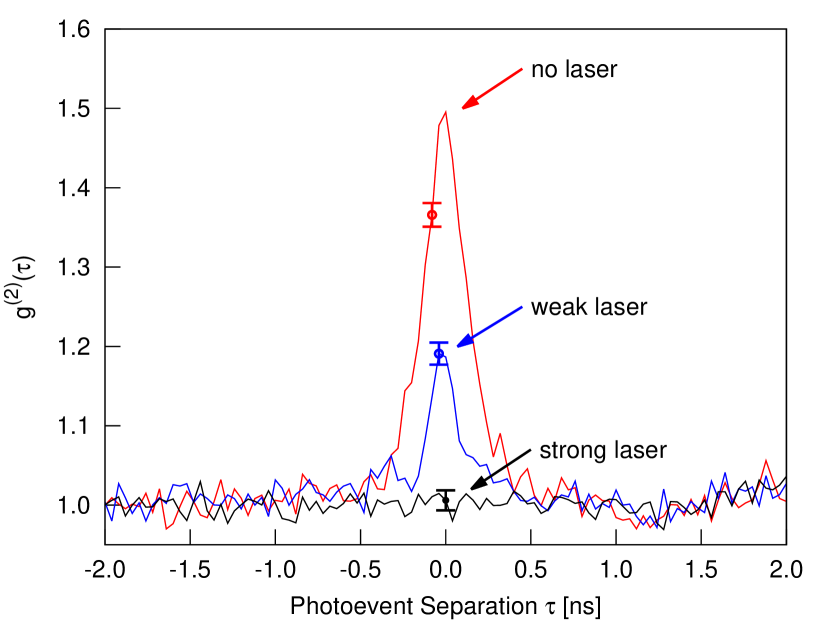
The results are shown in Fig. 4. Without any laser light contribution, a detector-limited blackbody temporal bunching signature of approximately is observed, compatible with the transmission bandwidth around 3.2GHz of the etalon stack at central wavelength and the timing jitter of the avalanche photodetectors (Tan et al., 2016).
For a weak laser contribution ( photoevents/sec) on top of a blackbody background, the temporal photon bunching signal is reduced to , indicating a sub-thermal photon bunching signature. This means that even the presence of small contributions of coherent light is revealed by the reduction of the thermal photon bunching signature expected from the filtered blackbody component.
For the third trace in Fig. 4, the laser light contribution is over two orders of magnitude stronger than the filtered blackbody contribution, corresponding to the power ratio used to obtain the spectrum in Fig. 2. The timing correlation appears constant within the statistical uncertainty, without an observable temporal photon bunching signature from the blackbody contribution.
The last trace resembles a typical photodetection correlation observed photodetectors exposed to wideband radiation, like in the traditional experiments of Hanbury-Brown & Twiss (1958), but with a significant difference: since the optical bandwidth of the detected radiation is narrower than the inverse detector timing uncertainty, the reduction of a photobunching signal can be interpreted as a signature of a light source with sub-thermal statistics, e.g. due to contributions of coherent light from a lasing mechanism.
6 Summary
Time-resolved second order correlation spectroscopy was used to identify the presence of very narrow-band light on a thermal background. The linewidth of pseudo-thermal light could be determined that was generated by phase-randomization in a multiple scattering process, similar to light from an ensemble of emitters without a fixed phase relationship, like a gas cloud excited by a nearby star. Temporal intensity interferometry offers a spectral resolution of at least a few 10 MHz for emission lines, exceeding by far that of contemporary astrophysical spectrographs (Griest et al., 2010).
Also, an identification of sub-thermal photon statistics can be carried out with the presented technique indicating a possible optical lasing mechanism, and therefore help to better understand the very narrow spectral features of stellar light sources even in presence of a strong blackbody radiation background.
Acknowledgements.
We acknowledge the support of this work by the National Research Foundation and the Ministry of Education in Singapore, partly through the Academic Research Fund MOE2012-T3-1-009.References
- Arecchi (1965) Arecchi, F. T. 1965, Phys. Rev. Lett., 15, 912
- Dravins & Germanà (2008) Dravins, D. & Germanà, C. 2008, in The Universe At Sub-Second Timescales, ed. D. Phelan, O. Ryan, & A. Shearer (USA: AIP), 284
- Dravins & Lagadec (2014) Dravins, D. & Lagadec, T. 2014, Proc. SPIE, 9146, 91460Z
- Dravins et al. (2015) Dravins, D., Lagadec, T., & Nunẽz, P. D. 2015, Nat. Commun., 6, 6852
- Estes et al. (1971) Estes, L. E., Narducci, L. M., & Tuft, R. A. 1971, J. Opt. Soc. Am., 61, 1301
- Glauber (1963) Glauber, R. 1963, Phys. Rev., 131, 2766
- Griest et al. (2010) Griest, K., Whitmore, J. B., Wolfe, A. M., et al. 2010, ApJ, 708, 158
- Hale et al. (2000) Hale, D. D. S., Bester, M., Danchi, W. C., et al. 2000, ApJ, 537
- Hanbury-Brown (1974) Hanbury-Brown, R. 1974, The Intensity Interferometer: Its Application To Astronomy (London ; New York: Taylor & Francis ; Halsted Press), 184
- Hanbury-Brown & Twiss (1958) Hanbury-Brown, R. & Twiss, R. Q. 1958, Proc. Roy. Soc., 243, 291
- Hard et al. (1977) Hard, R., Zeh, R., & Allen, R. D. 1977, J. Cell Sci, 23, 335
- Javan et al. (1961) Javan, A., Bennett, W. R., & Herriott, D. R. 1961, Phys. Rev. Lett., 6, 106
- Johansson & Letokhov (2005) Johansson, S. & Letokhov, V. S. 2005, New Astronomy, 10, 361
- Khinchin (1934) Khinchin, A. 1934, Mathematische Annalen, 109, 604
- Maiman (1960) Maiman, T. H. 1960, Nature, 187, 493
- Mandel & Wolf (1995) Mandel, L. & Wolf, E. 1995, Optical Coherence and Quantum Optics (Cambridge University Press)
- Martienssen & Spiller (1964) Martienssen, W. & Spiller, E. 1964, Am. J. Phys, 32, 919
- Menzel (1970) Menzel, D. H. 1970, in Proceedings of IAU Colloquia No.2 Commission 36, Vol. 332, Spectrum Formation in Stars with Steady-State Extended Atmospheres, ed. H. G. Groth & P. Wellmann, IAU, 134
- Roche et al. (2012) Roche, P. F., Colling, M. D., & Barlow, M. J. 2012, MNRAS, 427, 581
- Scarl (1966) Scarl, D. B. 1966, Phys. Rev. Lett., 17, 663
- Scarl (1968) Scarl, D. B. 1968, Phys. Rev., 175, 1661, issue 5
- Schawlow & Townes (1958) Schawlow, A. L. & Townes, C. H. 1958, Phys. Rev, 112, 1940
- Sonnabend et al. (2005) Sonnabend, G., Wirtz, D., Vetterle, V., & Schieder, R. 2005, A&A, 435, 1181
- Tan et al. (2016) Tan, P. K., Chan, A. H., & Kurtsiefer, C. 2016, MNRAS, 457, 4291
- Tan et al. (2014) Tan, P. K., Yeo, G. H., Poh, H. S., Chan, A. H., & Kurtsiefer, C. 2014, ApJ, 789, L10
- Varshni & Nasser (1986) Varshni, Y. P. & Nasser, R. M. 1986, Astrophysics and Space Science, 125, 341
- Weaver et al. (1965) Weaver, H., Williams, D. R., Dieter, N., & Lum, W. 1965, Nature, 208, 29
- Wiener (1930) Wiener, N. 1930, Acta Mathematica, 55, 117