Reconstruction of Solar Subsurfaces by Local Helioseismology
Stanford University, Stanford, CA 95305, USA
E-mail: sasha@bbso.njit.edu
Reconstruction of Solar Subsurfaces by Local Helioseismology
Abstract
Local helioseismology has opened new frontiers in our quest for understanding of the internal dynamics and dynamo on the Sun. Local helioseismology reconstructs subsurface structures and flows by extracting coherent signals of acoustic waves traveling through the interior and carrying information about subsurface perturbations and flows, from stochastic oscillations observed on the surface. The initial analysis of the subsurface flow maps reconstructed from the five years of SDO/HMI data by time-distance helioseismology reveals the great potential for studying and understanding of the dynamics of the quiet Sun and active regions, and the evolution with the solar cycle. In particular, our results show that the emergence and evolution of active regions are accompanied by multi-scale flow patterns, and that the meridional flows display the North-South asymmetry closely correlating with the magnetic activity. The latitudinal variations of the meridional circulation speed, which are probably related to the large-scale converging flows, are mostly confined in shallow subsurface layers. Therefore, these variations do not necessarily affect the magnetic flux transport. The North-South asymmetry is also pronounced in the variations of the differential rotation (’torsional oscillations’). The calculations of a proxy of the subsurface kinetic helicity density show that the helicity does not vary during the solar cycle, and that supergranulation is a likely source of the near-surface helicity.
1 Introduction
Observations of solar oscillations provide a unique opportunity to obtain information about the structure and dynamics of the solar interior beneath the visible surface. The oscillations with a characteristic period of five minutes represent acoustic waves stochastically excited by the turbulent convection in a shallow subsurface layer. The excitation mechanism has not been completely understood. However, recent numerical simulations have shown that the waves can be excited due to the interaction of turbulent vortex tubes ubiquitously generated in the intergranular lanes (Kitiashvili et al, 2011). These stochastic waves produce chaotic oscillation patterns on the solar surface. However, a spectral analysis of the time series of these patterns reveals that most of the oscillation power is concentrated in a set of normal modes (Fig. 1a). These modes represent standing acoustic waves trapped in the subsurface layers by their reflection between the sharp density gradient near the surface, and the increasing sound speed in the interior. The depth of the inner reflection depends on the horizontal wavelength of the oscillations. The horizontal wavelength, , is usually represented in terms of the spherical harmonic degree, . The oscillation frequency is expressed in terms of cyclic frequency . In the diagram shown in Figure 1a, the lowest ridge represents the surface gravity mode (-mode). The other ridges are acoustic modes of various radial order , which is equal to the number of nodes along the radius. This number is higher for higher frequency ridges. The time-series of solar oscillations have been obtained almost uninterruptedly since 1995 from the ground-based network GONG and space mission SOHO (Solar and Heliospheric Observatory) and SDO (Solar Dynamics Observatory). The oscillation frequencies are routinely measured from 72- and 108-day time series by fitting the modal lines which are used for inferring variations of the sound speed, asphericity, and differential rotation rate. This approach called ‘global helioseismology’ has provided important information about the structure, composition and dynamics of the solar interior. In particular, it was led to the discovery of a sharp radial gradient of the differential rotation at the base of the convection zone (Kosovichev, 1996a), the so-called tachocline, the near-surface rotational shear layer(Schou et al, 1998), subsurface zonal flows migrating with the solar activity cycle(Kosovichev and Schou, 1997). Recent analysis of the high-degree oscillation modes revealed a sharp gradient of the sound speed in a narrow 30-Mm deep layer just beneath the solar surface (Reiter et al, 2015). This layer (called ‘leptocline’, (Godier and Rozelot, 2001)) presumably plays an important role in the solar dynamo (Pipin and Kosovichev, 2011).
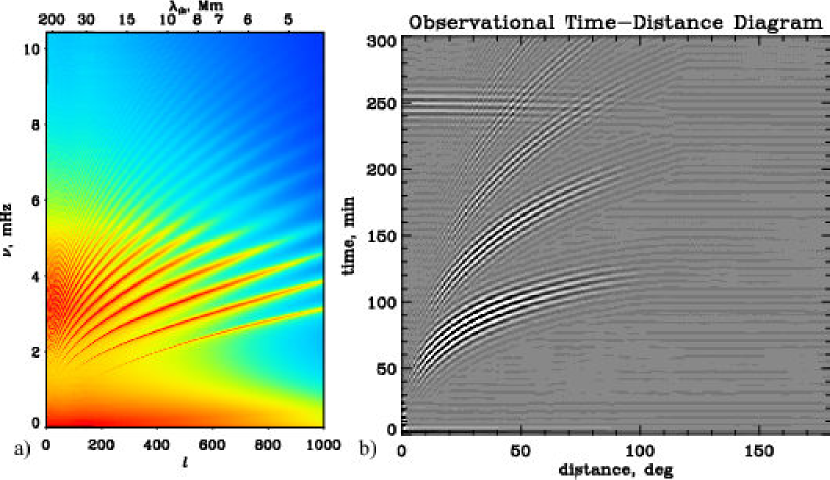
It is important to note that while the oscillation power spectrum extends into the high-frequency region (10 mHz and higher), only the ridge parts with the frequency below the acoustic cut-off frequency (which is approximately at 5.2 mHz) represent the normal modes. The higher frequency parts correspond to so-called ‘pseudo-modes’ . The pseudo-modes are formed by interference between the waves traveling from the excitation sources directly to the surface and the waves which come to the same surface location after reflection in the interior. The pseudo-mode ridges are close to the mode ridges (so that the ridges look continuous) because the excitation sources are located very close to the surface where the oscillations are observed. The pseudo-mode frequencies depend on details of the excitation mechanism and on the wave interaction with the solar atmosphere. Therefore, so-far, only the normal modes have been used for the reconstruction of solar subsurfaces. The primary restriction of global helioseismology is that it can only reconstruct the azimuthally averaged properties of the interior. This is not sufficient for the understanding of the solar dynamics and magnetism.
The three-dimensional structure of the solar subsurfaces can be reconstructed by techniques of local helioseismology. One of these techniques, called ‘ring-diagram analysis’ (Gough and Toomre, 1983) is based on measuring frequency shifts in local (typically degrees) areas, and uses the global helioseismology description of the mode frequency sensitivity to local sound-speed variations and flows. This techniques allows us to reconstruct the solar subsurfaces with relatively low spatial resolution in shallow regions. The reconstruction with higher spatial resolution and much deeper in the interior can be achieved by methods based on extracting coherent wave signals and measuring variations of the wave travel times or phase shift. These techniques called time-distance helioseismology (Duvall et al, 1993) and acoustic holography (Lindsey and Braun, 2000) employ cross-covariance functions of solar oscillations instead of the power spectral analysis. The discovery that coherent signals, such as wave packets, can be extracted from the cross-covariance functions of the stochastic solar oscillations (Fig. 1b) was made by Duvall (Duvall et al, 1993). This approach was then developed in helioseismology, terrestrial seismology, and other disciplines, and in broader applications is called ‘ambient noise imaging’. The foundation of this approach is based on the property of cross-covariance functions to represent wave signals corresponding to point sources. Roughly speaking the cross-covariance function can be considered as the Green’s function of the solar wave equation. In real solar conditions this is only an approximation because of the limited frequency bandwidth of solar oscillations and inhomogeneities of the solar structures and distribution of the stochastic sources. A complete theory of this approach of helioseismology has not been developed. It requires extensive studies of wave interaction with turbulence, flows and magnetic field. Nevertheless, the initial results based on relatively simple descriptions of wave propagation have provided important insights into the three-dimensional structures and flow patterns of the solar subsurfaces. The primary focus of these studies is mapping the flow patterns associated with the solar cycle, and formation and evolution of active regions.
In the current state of local helioseismology the systematic errors as well as effects of the stochastic realization noise have not been fully investigated. These studies require substantial effort for modeling the wave dynamics in realistic solar conditions, and require 3D MHD simulations on large supercomputer systems. The validation and testing of the time-distance technique have been performed by comparing the helioseismic inversions in the shallowest layer with the surface flows obtained by a local correlation tracking technique (Liu et al, 2013), and through the analysis and inversion of numerical simulation data for subsurface flows and sound-speed variations (Birch et al, 2011; Hartlep et al, 2013; Parchevsky and Kosovichev, 2009; Parchevsky et al, 2014). The testing for regions with strong magnetic field has not yet been completed. However, the simulations of the wave propagation in sunspot models showed that one of the primary effects in sunspot regions is the wave reflection from deeper layers, compared to the quiet-Sun regions, where the plasma parameter, , the ratio of the gas pressure to magnetic pressure, is equal to unity (this layer also corresponds to the deeper photospheric surface of sunspots, known as the Wilson depression). Below the Wilson depression level the gas pressure dominates, and the helioseismic acoustic waves behave like fast MHD waves: the wave speed becomes anisotropic, and also depends on the temperature stratification beneath sunspots. The magnetic and temperature effects have not been separated in the wave-speed inversion results (Kosovichev et al, 2000). This is an important task of local helioseismology. One of the difficulties is that the limited computer power has not allowed to simulated the sunspot models sufficiently large and deep for the helioseismology testing, so that the wave properties are not affected by the boundary conditions of the simulations. A comparison of the wave-speed inversions obtained for a sunspot regions by the time-distance and ring-diagram techniques (see (Kosovichev, 2012; Kosovichev et al, 2011) and references therein) shows a good qualitative agreement: both inversions show a two-layer structure with a layer of reduced wave speed beneath the surface followed by a layer of an increased wave speed. However, the depth of these layers is different, perhaps, because of the drastically different spatial resolution, and different contributions of magnetic field. A comparison of the time-distance and acoustic holography inversion results has been performed by using artificial simulation data (Birch et al, 2011; Parchevsky et al, 2014).
2 Time-Distance Helioseismology from SDO
This brief review presents recent results obtained by the helioseismology reconstructions of subsurface flows in the near-surface layer and development of active regions. The results are obtained by analyzing inversions for subsurface flows from the SDO Joint Science Operations Center (JSOC) at Stanford University (Scherrer et al, 2012). The JSOC data analysis pipeline provides 3D maps of solar flows covering almost the whole disk (within 60 degrees from the disk center) in the range of depths from 0 to 30 Mm, every 8 hours.
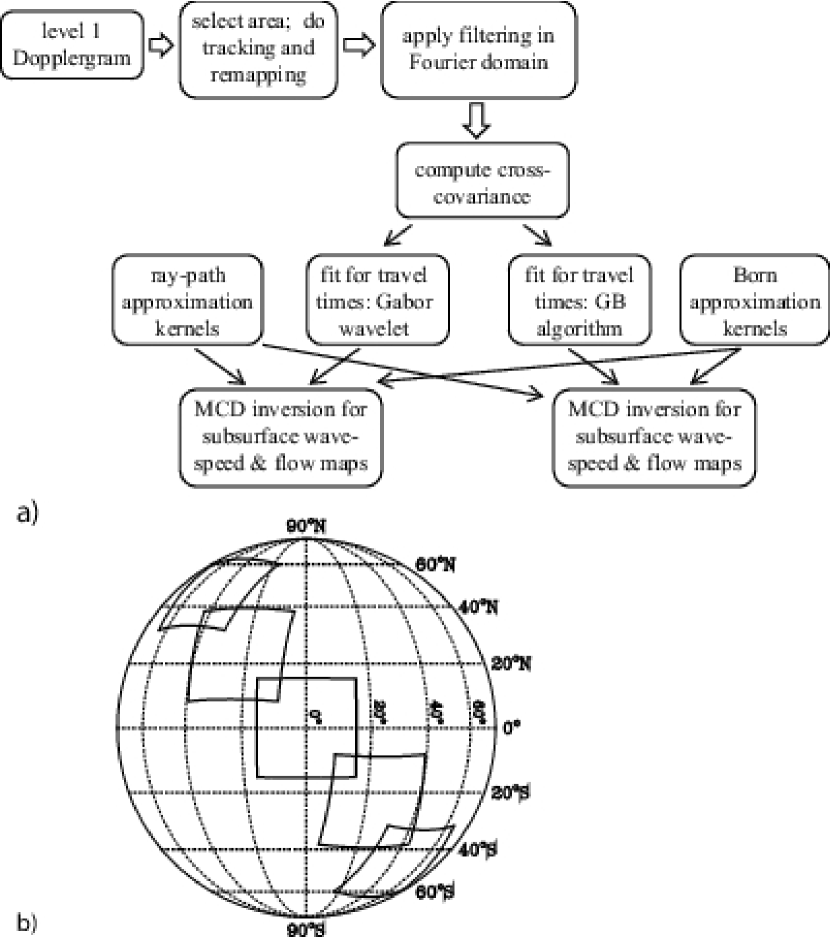
The time-distance helioseismology pipeline (Fig. 2a) developed by the Stanford group(Couvidat et al, 2012; Zhao et al, 2012) utilizes two different methods for measuring the acoustic travel times: 1) the method of fitting the Gabor wavelet to the cross-covariance function, which provides measurements of both the phase and group travel times (Kosovichev and Duvall, 1997) and 2) the method of calculating the travel-time shift relative to a reference cross-covariance function(Gizon and Birch, 2002), usually calculated for a quiet-Sun region. The two sets of the travel times are calculated independently for 11 travel distances, for the same 25 areas covering the solar disk (Fig. 2b), and for the same 8-hour intervals. Then, the travel times are used for reconstruction of subsurface flows in 11 subsurface layers in the depth ranges:1 - 3, 3 - 5, 5 - 7, 7 - 10, 10 - 13, 13 - 17, 17 - 21, 21 - 26, 26 - 30, and 30 - 35 Mm, and with the horizontal spatial sampling of 0.12 degrees (1.5 Mm) .
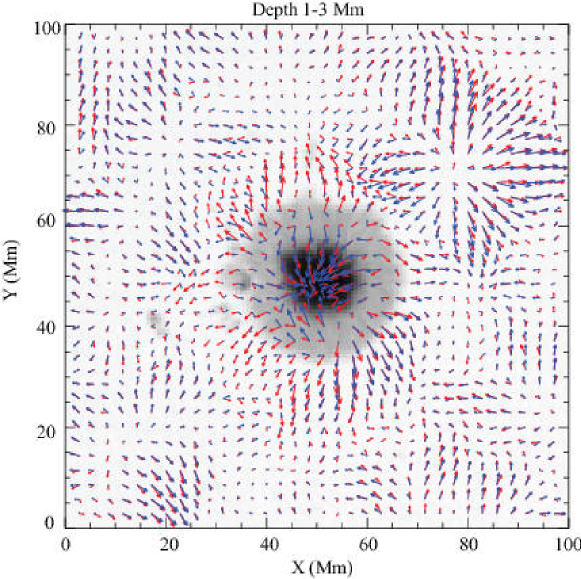
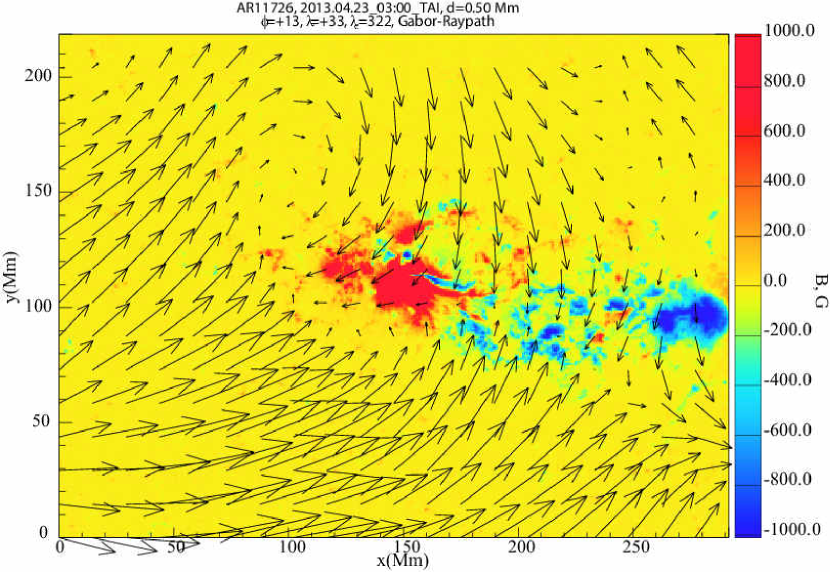
The inversions are performed by using two different methods for calculating the travel-time sensitivity functions: 1) the ray-path approximation (Kosovichev, 1996b; Kosovichev and Duvall, 1997) and 2) the first Born approximation (Birch and Kosovichev, 2000, 2001; Birch et al, 2001, 2004; Birch and Gizon, 2007). The inversions are performed using the Multi-Channel Deconvolution (MCD) technique (Jacobsen et al, 1999) for the two independent travel time measurements using the two types of the sensitivity kernels. Therefore, the pipeline output consists of four sets of subsurface flow maps for the same areas on the Sun (Zhao et al, 2012). This allows the comparison of the different approaches and estimate potential systematic errors. The reconstruction of subsurface flows has also been tested through analysis and inversion of numerical simulation results as well as by the comparison of the flow maps obtained by the different techniques, and also by comparing the inversion results in the shallowest layer with the surface flows measured by the feature correlation tracking techniques (Liu et al, 2013). Figure 3 illustrates the comparison of the flow maps below a sunspot region, obtained by using two different techniques for measuring the travel times and two different models for the travel-time sensitivity functions. The results show that the agreement is quite good everywhere except the areas close to the sunspot. As discussed in the Introduction, the effects of a strong magnetic field and large perturbations of the thermodynamic structure have not been fully investigated. Solving this problem requires more studies of systematic uncertainties using realistic numerical simulations. Nevertheless, the currently available inferences shed light on the intriguing dynamics of the solar interior.
3 Subsurface Flows and Effects of Solar Activity
An example of the reconstructed subsurface flow maps is illustrated in Fig. 4a, which shows the distribution of the divergence of the horizontal flow velocity in the depth range 1-3 Mm. The primary feature covering the whole surface is supergranulation. The outflows of a few hundred m/s in the supergranulation cells are represented by light dot-like features. However, the examination of these maps shows that in the in the vicinity of magnetic active regions (shown in Fig. 4b), the supergranulation pattern is substantially suppressed. The flow pattern beneath and around sunspots represents a complicated combination of converging flows towards the sunspot centers (displayed as dark dots in the divergence map) surrounded by outflows (represented as white rings). Such a pattern, similar to the flows shown in Figures 3 and 5, has been previously studied using SOHO/MDI and Hinode data (Zhao et al, 2001, 2009, 2010). A new feature of the SDO/HMI analysis is that the HMI data allow us to reconstruct the flows in a shallow subsurface layer, and match these to the directly observed surface flows. This agreement provides more confidence in the helioseismic inferences.
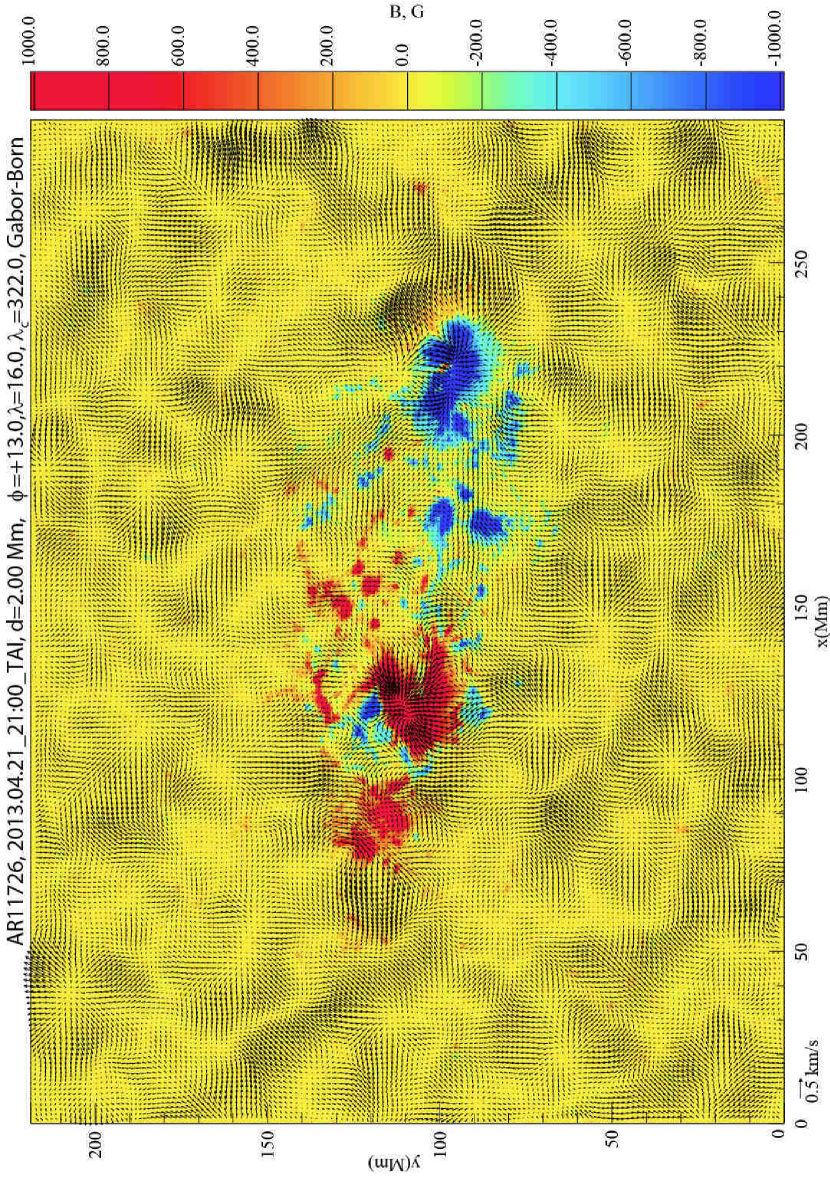
Figure 5 shows a portion of the horizontal velocity map around an emerging active region NOAA 11726, during its development phase. This is the largest active region observed by the HMI instrument during the first five years of operation. The flow velocities are shown by arrows, and the photospheric magnetogram is represented by the color map. Such flow maps are obtained with one-hour sampling, although each map requires eight-hour time series of Dopplergrams for the helioseismology analysis. The analysis of these maps indicates that the converging flows beneath the sunspots are developed simultaneously with the sunspot formation, as was previously found from analysis of the SOHO/MDI data (Kosovichev and Duvall, 2006; Kosovichev, 2009), and, probably, is closely associated with the mechanism of the sunspot formation. At the same time, large-scale diverging flows are developed around the active region, and are probably related to the well-known phenomenon of the surface ‘moat’ flow.
Outside the active region the flow pattern is mostly represented by supergranulation which, however, is clearly disturbed by the presence of the active region. It is interesting that the spatial averaging of these flow maps reveals a large-scale pattern of converging flows occupying a surrounding area which is significantly larger than the active region (Fig. 6). Such converging flows with the characteristic speed of about 50 m/s were first discovered by the ring-diagram technique (Haber et al, 2003). The origin of these flows is not understood, but our analysis shows that these flows are formed and stable only when the active region is fully developed, and, thus, they are not associated with the emergence of magnetic flux and formation of the active region.
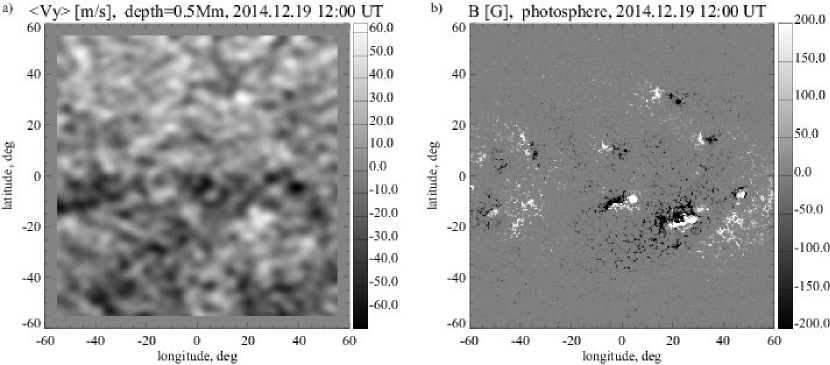
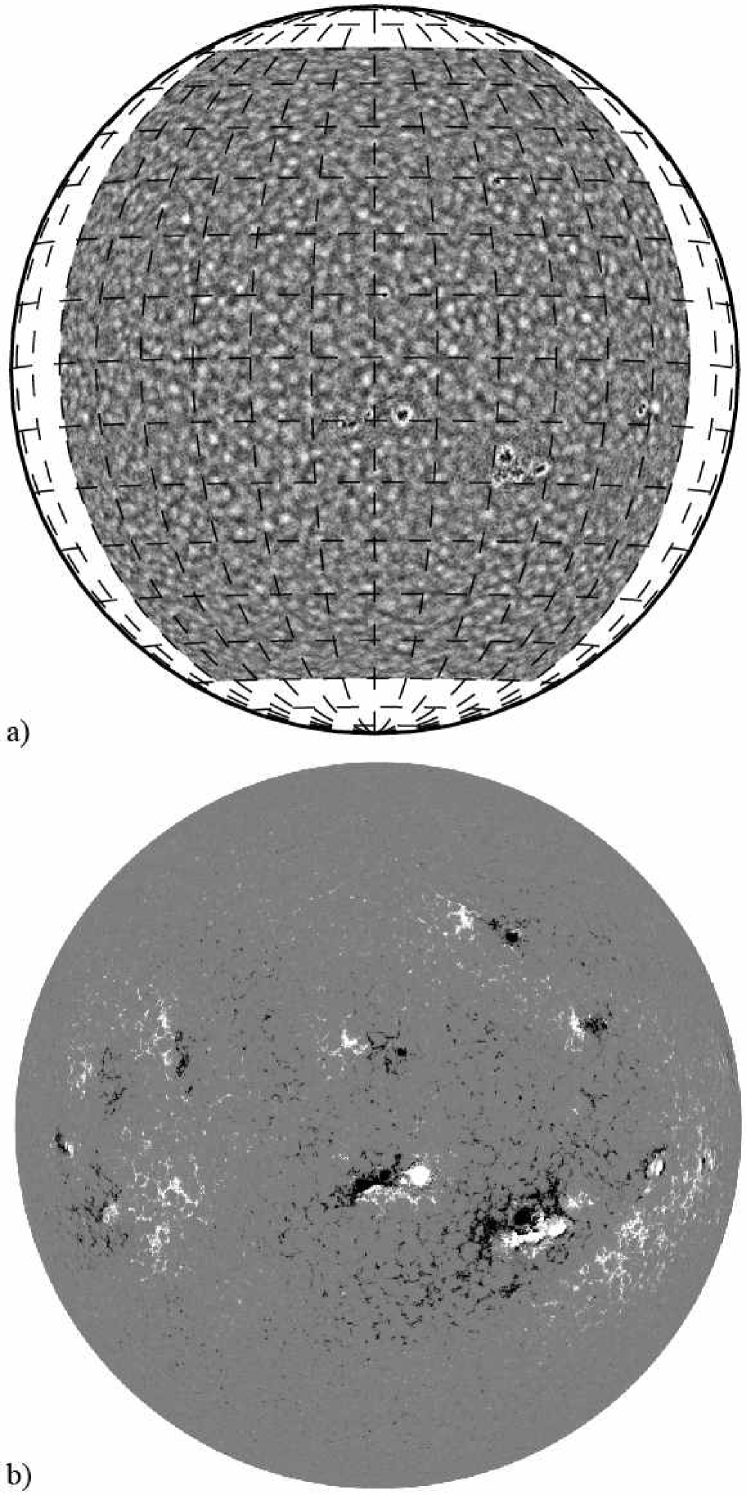
The large-scale converging flows around active regions play an important role in the solar-cycle evolution of the meridional circulation (Haber et al, 2002; Zhao and Kosovichev, 2004). The meridional circulation can be calculated from the reconstructed subsurface flow maps by averaging the North-South component of the flow velocity. Figure 8a shows a map of the North-South velocity component smoothed with a 5-degree Gaussian window.
The appearance of the poleward trends in each hemisphere is apparent. It is interesting that the meridional circulation can be detected in a single flow map, but it is also important that the flow pattern correlates with the surface magnetic field map shown in Fig. 8b. The variations can be interpreted as caused by the large-scale converging flows around active regions. However, the strongest variations in this flow map seem to be in the areas of decaying active regions. Thus, it is important to investigate the formation and evolution of the converging flows during the whole evolution of active regions, from their formation to decay.
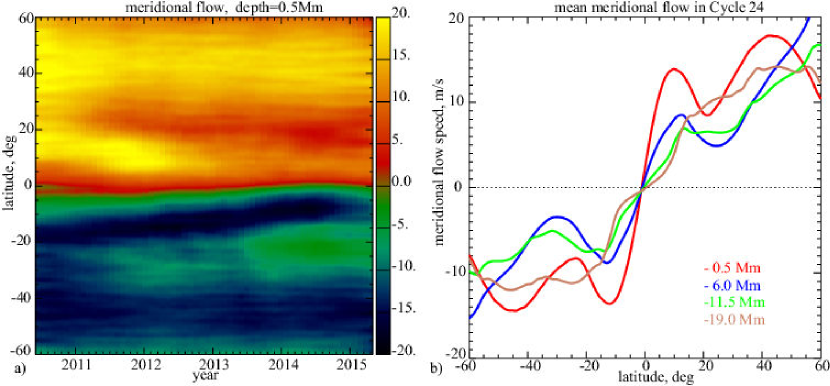
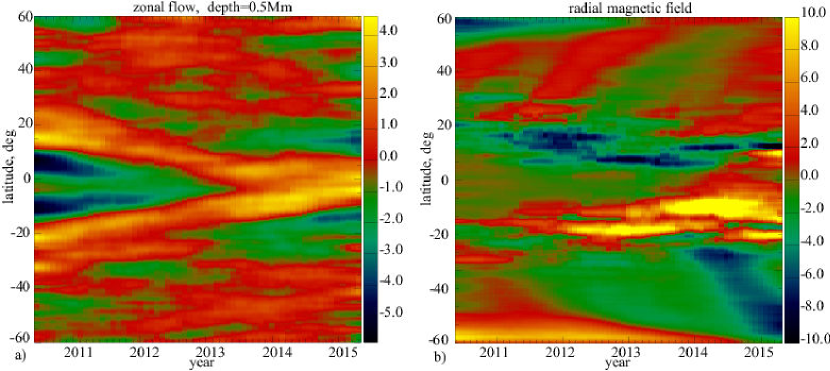
The evolution of meridional circulation is obtained by averaging the North-South velocity component over longitude and one-month periods, and displaying the averages in the form of a time-latitude diagram (Fig. 8a). This diagram shows that the evolution of the subsurface meridional circulation correlates with the magnetic activity in each hemisphere. At the beginning of the current cycle most active regions emerged in the Northern hemisphere, where we see a strong variation of the meridional circulation speed: a sharp increase at low latitudes (in the 10-20 deg interval) and a decrease at mid latitudes (in the 20-30 deg range). A similar variation in the Southern hemisphere is observed in 2014-15 when most magnetic activity was in the South (Fig. 9b).
Such variations of the meridional circulation may affect the magnetic flux transport and the polar magnetic field polarity reversal. However, this link has not been fully established (Švanda et al, 2007a, b, 2008). Figure 8b shows the variation of the mean (averaged over the whole period) meridional circulation profile with depth. It appears that at a depth of Mm the latitudinal variations are significantly reduced, and at the depth of Mm almost entirely disappear. Therefore, if the large-scale magnetic flux is anchored at this depth or lower then its transport is not affected by the meridional flow variations.
Solar-cycle variations of the differential rotation are also of great interest for the understanding of the mechanisms of solar activity. These variations, known as ‘torsional oscillation’, have been detected from the surface Doppler-shift maps (Howard and Labonte, 1980; Ulrich, 2001), and by global (Kosovichev and Schou, 1997) and local (Zhao and Kosovichev, 2004) helioseismology. The high-resolution flow maps from SDO/HMI provide new opportunities for investigating the detailed structure and evolution of these flows. Figure 9a shows the time-latitude diagram of variations of the differential rotation during the five years of the SDO/HMI observations. These variations are relative to the mean differential rotation profile averaged for the whole period, and smoothed with a one-year window to remove the orbital variations. As it was established before, the zonal flow closely correlates with the magnetic butterfly diagram (Fig. 9b). However, our results also show the North-South asymmetry of the flows, which follows the asymmetry of the magnetic activity.
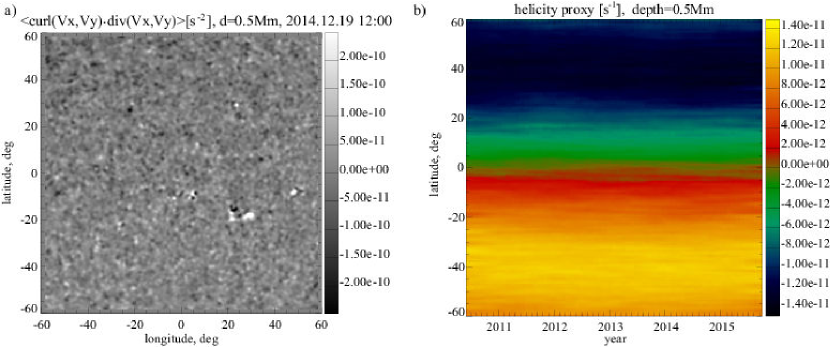
The flows maps allow us to investigate other important properties of the subsurface dynamics of the Sun, which previously were not accessible. For illustration, in Figure 10a we show a map of the kinetic helicity proxy calculated as , where is the horizontal velocity component. By looking at this map one can notice that the Northern hemisphere is darker than the Southern hemisphere, and that the asymmetry is particularly pronounced in the supergranulation cells. After the longitudinal and time averaging of the individual helicity proxy maps we obtain the time-latitude diagram (Fig. 10b), which shows that the kinetic helicity does not vary on this time scale. This result puts constraints on the dynamo theories, and also shows that the supergranulation flows are likely a primary source of the near-surface helicity.
4 Conclusion
The initial analysis of the subsurface flow maps reconstructed from the five years of SDO/HMI data by time-distance helioseismology reveals the great potential for studying and understanding the dynamics of the quiet-Sun and active regions, and the evolution with the solar cycle. In particular, our results show that the emergence and evolution of active regions are accompanied by multi-scale flow patterns. Beneath the sunspot, during their formation, we observe appearance of flows converging towards the sunspot center. and also the ’moat’-like flows diverging from the active region in the surrounding regions. On the larger scale, revealed by averaging the high-resolution flow maps, we find a pattern of flows converging towards the active region. This pattern is formed when the active region is fully developed. On the global-Sun scale, the flow maps allow us to investigate the structure and evolution of the meridional flows. In particular, we find that the meridional flows display the North-South asymmetry closely correlating with the magnetic activity. The latitudinal variations of the meridional circulation speed, which are probably related to the large-scale converging flows, are mostly confined in a shallow subsurface layers. Therefore, these variations do not necessarily affect the magnetic flux transport. The North-South asymmetry is also pronounced in the variations of the differential rotation (’torsional oscillation’). The calculations of a proxy of the subsurface kinetic helicity density show that the helicity does not vary during the solar cycle, and that the supergranulation is a likely source of the near-surface helicity. These initial results are obtained from the analysis of a small sample of flow maps produced by the SDO/HMI time-distance helioseismology pipeline. Further detailed investigations are required for understanding the complicated subsurface dynamics of the Sun.
Acknowledgment
This work was supported by the CNRS, and NASA grants NNX09AJ85G and NNX14AB70G .
References
- Birch and Gizon (2007) Birch AC, Gizon L (2007) Linear sensitivity of helioseismic travel times to local flows. Astronomische Nachrichten 328:228, DOI 10.1002/asna.200610724, 1002.2338
- Birch and Kosovichev (2000) Birch AC, Kosovichev AG (2000) Travel time sensitivity kernels. Solar Phys. 192:193–201, DOI 10.1023/A:1005283526062, URL http://adsabs.harvard.edu/abs/2000SoPh..192..193B
- Birch and Kosovichev (2001) Birch AC, Kosovichev AG (2001) The born approximation in time-distance helioseismology. In: Wilson A, Pallé PL (eds) SOHO 10/GONG 2000 Workshop: Helio- and Asteroseismology at the Dawn of the Millennium, ESA Special Publication, vol 464, pp 187–190, URL http://adsabs.harvard.edu/abs/2001ESASP.464..187B
- Birch et al (2001) Birch AC, Kosovichev AG, Price GH, Schlottmann RB (2001) The accuracy of the born and ray approximations in time-distance helioseismology. Astrophys. J. Lett. 561:L229–L232, DOI 10.1086/324766, URL http://adsabs.harvard.edu/abs/2001ApJ...561L.229B
- Birch et al (2004) Birch AC, Kosovichev AG, Duvall TL Jr (2004) Sensitivity of acoustic wave travel times to sound-speed perturbations in the solar interior. Astrophys. J. 608:580–600, DOI 10.1086/386361, URL http://adsabs.harvard.edu/abs/2004ApJ...608..580B
- Birch et al (2011) Birch AC, Parchevsky KV, Braun DC, Kosovichev AG (2011) ”hare and hounds” tests of helioseismic holography. Solar Phys. 272:11–28, DOI 10.1007/s11207-011-9799-1, URL http://adsabs.harvard.edu/abs/2011SoPh..272...11B
- Couvidat et al (2012) Couvidat S, Zhao J, Birch AC, Kosovichev AG, Duvall TL, Parchevsky K, Scherrer PH (2012) Implementation and comparison of acoustic travel-time measurement procedures for the solar dynamics observatory/helioseismic and magnetic imager time - distance helioseismology pipeline. Solar Phys. 275:357–374, DOI 10.1007/s11207-010-9652-y, URL http://adsabs.harvard.edu/abs/2012SoPh..275..357C
- Duvall et al (1993) Duvall TL Jr, Jefferies SM, Harvey JW, Pomerantz MA (1993) Time-distance helioseismology. Nature 362:430–432, DOI 10.1038/362430a0
- Gizon and Birch (2002) Gizon L, Birch AC (2002) Time-distance helioseismology: The forward problem for random distributed sources. Astrophys. J. 571:966–986, DOI 10.1086/340015
- Godier and Rozelot (2001) Godier S, Rozelot JP (2001) A new outlook on the ‘differential theory’ of the solar quadrupole moment and oblateness. Solar Phys. 199:217–229, DOI 10.1023/A:1010354901960, URL http://adsabs.harvard.edu/abs/2001SoPh..199..217G
- Gough and Toomre (1983) Gough DO, Toomre J (1983) On the detection of subphotospheric convective velocities and temperature fluctuations. Solar Phys. 82:401–410, DOI 10.1007/BF00145579
- Haber et al (2002) Haber DA, Hindman BW, Toomre J, Bogart RS, Larsen RM, Hill F (2002) Evolving submerged meridional circulation cells within the upper convection zone revealed by ring-diagram analysis. Astrophys. J. 570:855–864, DOI 10.1086/339631
- Haber et al (2003) Haber DA, Hindman BW, Toomre J (2003) Interaction of solar subsurface flows with major active regions. In: Sawaya-Lacoste H (ed) GONG+ 2002. Local and Global Helioseismology: the Present and Future, ESA Special Publication, vol 517, pp 103–108
- Hartlep et al (2013) Hartlep T, Zhao J, Kosovichev AG, Mansour NN (2013) Solar wave-field simulation for testing prospects of helioseismic measurements of deep meridional flows. Astrophys. J. 762:132, DOI 10.1088/0004-637X/762/2/132, URL http://adsabs.harvard.edu/abs/2013ApJ...762..132H, %****␣kosovichev_LNP2015.tex␣Line␣425␣****1209.4602
- Howard and Labonte (1980) Howard R, Labonte BJ (1980) The sun is observed to be a torsional oscillator with a period of 11 years. Astrophys. J. Lett. 239:L33–L36, DOI 10.1086/183286
- Jacobsen et al (1999) Jacobsen B, Moller I, Jensen J, Efferso F (1999) Multichannel deconvolution, mcd, in geophysics and helioseismology. Physics and Chemistry of the Earth A 24:215–220, DOI 10.1016/S1464-1895(99)00021-6
- Kitiashvili et al (2011) Kitiashvili IN, Kosovichev AG, Mansour NN, Wray AA (2011) Excitation of acoustic waves by vortices in the quiet sun. Astrophys. J. Lett. 727:L50, DOI 10.1088/2041-8205/727/2/L50, URL http://adsabs.harvard.edu/abs/2011ApJ...727L..50K, 1011.3775
- Kosovichev (1996a) Kosovichev AG (1996a) Helioseismic constraints on the gradient of angular velocity at the base of the solar convection zone. Astrophys. J. Lett. 469:L61, DOI 10.1086/310253, URL http://adsabs.harvard.edu/abs/1996ApJ...469L..61K
- Kosovichev (1996b) Kosovichev AG (1996b) Tomographic imaging of the sun’s interior. Astrophys. J. Lett. 461:L55, DOI 10.1086/309989, URL http://adsabs.harvard.edu/abs/1996ApJ...461L..55K
- Kosovichev (2009) Kosovichev AG (2009) Photospheric and subphotospheric dynamics of emerging magnetic flux. Space Sci. Rev. 144:175–195, DOI 10.1007/s11214-009-9487-8, URL http://adsabs.harvard.edu/abs/2009SSRv..144..175K, 0901.0035
- Kosovichev (2012) Kosovichev AG (2012) Local helioseismology of sunspots: Current status and perspectives. Solar Phys. 279:323–348, DOI 10.1007/s11207-012-9996-6, URL http://adsabs.harvard.edu/abs/2012SoPh..279..323K
- Kosovichev and Duvall (2006) Kosovichev AG, Duvall TL (2006) Active region dynamics. Space Sci. Rev. 124:1–12, DOI 10.1007/s11214-006-9112-z, URL http://adsabs.harvard.edu/abs/2006SSRv..124....1K
- Kosovichev and Duvall (1997) Kosovichev AG, Duvall TL Jr (1997) Acoustic tomography of solar convective flows and structures. In: Pijpers FP, Christensen-Dalsgaard J, Rosenthal CS (eds) SCORe’96 : Solar Convection and Oscillations and their Relationship, Astrophysics and Space Science Library, vol 225, pp 241–260, URL http://adsabs.harvard.edu/abs/1997ASSL..225..241K
- Kosovichev and Schou (1997) Kosovichev AG, Schou J (1997) Detection of zonal shear flows beneath the sun’s surface from f-mode frequency splitting. Astrophys. J. Lett. 482:L207–L210, DOI 10.1086/310708, URL http://adsabs.harvard.edu/abs/1997ApJ...482L.207K
- Kosovichev et al (2000) Kosovichev AG, Duvall TL Jr, Scherrer PH (2000) Time-distance inversion methods and results - (invited review). Solar Phys. 192:159–176, DOI 10.1023/A:1005251208431, URL http://adsabs.harvard.edu/abs/2000SoPh..192..159K
- Kosovichev et al (2011) Kosovichev AG, Basu S, Bogart R, Duvall TL Jr, Gonzalez-Hernandez I, Haber D, Hartlep T, Howe R, Komm R, Kholikov S, Parchevsky KV, Tripathy S, Zhao J (2011) Local helioseismology of sunspot regions: Comparison of ring-diagram and time-distance results. Journal of Physics Conference Series 271(1):012005, DOI 10.1088/1742-6596/271/1/012005, URL http://adsabs.harvard.edu/abs/2011JPhCS.271a2005K, 1011.0799
- Lindsey and Braun (2000) Lindsey C, Braun DC (2000) Basic principles of solar acoustic holography - (invited review). Solar Phys. 192:261–284, DOI 10.1023/A:1005227200911
- Liu et al (2013) Liu Y, Zhao J, Schuck PW (2013) Horizontal flows in the photosphere and subphotosphere of two active regions. Solar Phys. 287:279–291, DOI 10.1007/s11207-012-0089-3
- Parchevsky and Kosovichev (2009) Parchevsky KV, Kosovichev AG (2009) Numerical simulation of excitation and propagation of helioseismic mhd waves: Effects of inclined magnetic field. Astrophys. J. 694:573–581, DOI 10.1088/0004-637X/694/1/573, URL http://adsabs.harvard.edu/abs/2009ApJ...694..573P, 0806.2897
- Parchevsky et al (2014) Parchevsky KV, Zhao J, Hartlep T, Kosovichev AG (2014) Verification of the helioseismology travel-time measurement technique and the inversion procedure for sound speed using artificial data. Astrophys. J. 785:40, DOI 10.1088/0004-637X/785/1/40, URL http://adsabs.harvard.edu/abs/2014ApJ...785...40P
- Pipin and Kosovichev (2011) Pipin VV, Kosovichev AG (2011) The subsurface-shear-shaped solar dynamo. Astrophys. J. Lett. 727:L45, DOI 10.1088/2041-8205/727/2/L45, URL http://adsabs.harvard.edu/abs/2011ApJ...727L..45P, 1011.4276
- Reiter et al (2015) Reiter J, Rhodes EJ Jr, Kosovichev AG, Schou J, Scherrer PH, Larson TP (2015) A method for the estimation of p-mode parameters from averaged solar oscillation power spectra. Astrophys. J. 803:92, DOI 10.1088/0004-637X/803/2/92, URL http://adsabs.harvard.edu/abs/2015ApJ...803...92R, 1504.07493
- Scherrer et al (2012) Scherrer PH, Schou J, Bush RI, Kosovichev AG, Bogart RS, Hoeksema JT, Liu Y, Duvall TL, Zhao J, Title AM, Schrijver CJ, Tarbell TD, Tomczyk S (2012) The helioseismic and magnetic imager (hmi) investigation for the solar dynamics observatory (sdo). Solar Phys. 275:207–227, DOI 10.1007/s11207-011-9834-2, URL http://adsabs.harvard.edu/abs/2012SoPh..275..207S
- Schou et al (1998) Schou J, Antia HM, Basu S, Bogart RS, Bush RI, Chitre SM, Christensen-Dalsgaard J, Di Mauro MP, Dziembowski WA, Eff-Darwich A, Gough DO, Haber DA, Hoeksema JT, Howe R, Korzennik SG, Kosovichev AG, Larsen RM, Pijpers FP, Scherrer PH, Sekii T, Tarbell TD, Title AM, Thompson MJ, Toomre J (1998) Helioseismic studies of differential rotation in the solar envelope by the solar oscillations investigation using the michelson doppler imager. Astrophys. J. 505:390–417, DOI 10.1086/306146, URL http://adsabs.harvard.edu/abs/1998ApJ...505..390S
- Ulrich (2001) Ulrich RK (2001) Very long lived wave patterns detected in the solar surface velocity signal. Astrophys. J. 560:466–475, DOI 10.1086/322524
- Švanda et al (2007a) Švanda M, Kosovichev AG, Zhao J (2007a) Speed of meridional flows and magnetic flux transport on the sun. Astrophys. J. Lett. 670:L69–L72, DOI 10.1086/524059, URL http://adsabs.harvard.edu/abs/2007ApJ...670L..69S, 0710.0590
- Švanda et al (2007b) Švanda M, Zhao J, Kosovichev AG (2007b) Comparison of large-scale flows on the sun measured by time-distance helioseismology and local correlation tracking. Solar Phys. 241:27–37, DOI 10.1007/s11207-007-0333-4, URL http://adsabs.harvard.edu/abs/2007SoPh..241...27S, astro-ph/0701717
- Švanda et al (2008) Švanda M, Kosovichev AG, Zhao J (2008) Effects of solar active regions on meridional flows. Astrophys. J. Lett. 680:L161–L164, DOI 10.1086/589997, URL http://adsabs.harvard.edu/abs/2008ApJ...680L.161S, 0805.1789
- Zhao and Kosovichev (2004) Zhao J, Kosovichev AG (2004) Torsional oscillation, meridional flows, and vorticity inferred in the upper convection zone of the sun by time-distance helioseismology. Astrophys. J. 603:776–784, DOI 10.1086/381489, URL http://adsabs.harvard.edu/abs/2004ApJ...603..776Z
- Zhao et al (2001) Zhao J, Kosovichev AG, Duvall TL Jr (2001) Investigation of mass flows beneath a sunspot by time-distance helioseismology. Astrophys. J. 557:384–388, DOI 10.1086/321491, URL http://adsabs.harvard.edu/abs/2001ApJ...557..384Z
- Zhao et al (2009) Zhao J, Kosovichev AG, Sekii T (2009) Subsurface structures and flow fields of an active region observed by hinode. In: Lites B, Cheung M, Magara T, Mariska J, Reeves K (eds) The Second Hinode Science Meeting: Beyond Discovery-Toward Understanding, Astronomical Society of the Pacific Conference Series, vol 415, p 411, URL http://adsabs.harvard.edu/abs/2009ASPC..415..411Z
- Zhao et al (2010) Zhao J, Kosovichev AG, Sekii T (2010) High-resolution helioseismic imaging of subsurface structures and flows of a solar active region observed by hinode. Astrophys. J. 708:304–313, DOI 10.1088/0004-637X/708/1/304, URL http://adsabs.harvard.edu/abs/2010ApJ...708..304Z, 0911.1161
- Zhao et al (2012) Zhao J, Couvidat S, Bogart RS, Parchevsky KV, Birch AC, Duvall TL, Beck JG, Kosovichev AG, Scherrer PH (2012) Time-distance helioseismology data-analysis pipeline for helioseismic and magnetic imager onboard solar dynamics observatory (sdo/hmi) and its initial results. Solar Phys. 275:375–390, DOI 10.1007/s11207-011-9757-y, URL http://adsabs.harvard.edu/abs/2012SoPh..275..375Z, 1103.4646