Superconducting Energy Scales and Anomalous Dissipative Conductivity in
Thin Films of Molybdenum Nitride
Abstract
We report investigations of molybdenum nitride (MoN) thin films with different thickness and disorder and with superconducting transition temperature 9.89 K 2.78 K. Using terahertz frequency-domain spectroscopy we explore the normal and superconducting charge carrier dynamics for frequencies covering the range from 3 to 38 cm-1 (0.1 to 1.1 THz). The superconducting energy scales, i.e. the critical temperature , the pairing energy , and the superfluid stiffness , and the superfluid density can be well described within the Bardeen-Cooper-Schrieffer theory for conventional superconductors. At the same time, we find an anomalously large dissipative conductivity, which cannot be explained by thermally excited quasiparticles, but rather by a temperature-dependent normal-conducting fraction, persisting deep into the superconducting state. Our results on this disordered system constrain the regime, where discernible effects stemming from the disorder-induced superconductor-insulator transition possibly become relevant, to MoN films with a transition temperature lower than at least 2.78 K.
I Introduction
The fundamental statement of the Anderson theorem Anderson (1959) that superconductivity is insensitive to non-magnetic disorder has been contested in recent years: experiments revealed that thin films of strongly disordered superconductors close to the mobility edge exhibit a massively reduced superconducting transition temperature compared to modestly disordered or clean films, and can actually become zero at a critical disorder. Here, the system undergoes a transition from a coherent many-body ground state composed of delocalized Cooper pairs and thermally activated quasiparticle states (a superconductor) to a ground state where the quasiparticle states are incoherent and localized (an insulator) presumably without an intermediate ground state of incoherent but delocalized quasiparticle states (a metal) Gantmakher and Dolgopolov (2010); Lin et al. (2015). This transition from superconductor to insulator (SIT) has become both a paradigm for a quantum phase transition Sachdev (2011) tuned by a non-thermal control parameter such as disorder or structural granularity and a rich host of intriguing phenomena such as a spatially dependent energy gap Sacépé et al. (2008); Kamlapure et al. (2013), a notable peak in the magnetoresistance Baturina et al. (2005, 2007), scaling Lemarié et al. (2013) and vortex-charge-duality behavior Ovadia et al. (2013), enhanced fluctuations at the resistive transition Liu et al. (2011); Mondal et al. (2011), and a peculiar gapped density of states above Sacépé et al. (2010, 2011); Mondal et al. (2013); Chockalingam et al. (2009). Owing to their unique properties such as a small electron diffusion coefficient and a low charge carrier density, extremely thin disordered superconductors also play a key role in advanced applications such as superconducting nanowire single photon detectors (SNSPDs) Natarajan et al. (2012); Ilin et al. (2012); Henrich et al. (2012).
| Name | d (nm) | (nm) | () | T (K) | 2 (cm-1) | ns(0) | J(0) (K) | (0) (m) | ||
|---|---|---|---|---|---|---|---|---|---|---|
| MoN120 | 8.4 | 3.1 | 3.20 | 2.02 | 2.78 | 7.21 | 3.73 | 0.76 | 14.0 | 1.93 |
| MoN200 | 12.2 | 6.7 | 2.93 | 3.07 | 4.22 | 10.38 | 3.56 | 1.97 | 52.7 | 1.20 |
| MoN300 | 15.1 | 9.7 | 1.61 | 6.99 | 7.50 | 16.44 | 3.15 | 5.79 | 192.0 | 0.70 |
| MoN400 | 17.4 | 11.6 | 1.34 | 10.1 | 8.26 | 20.28 | 3.52 | 3.52 | 134.5 | 0.90 |
| MoN800 | 29.6 | 15.7 | 1.26 | 13.04 | 9.89 | 23.24 | 3.41 | 9.57 | 621.9 | 0.54 |
One of the most intriguing open and fundamental questions concerns the mechanism of the SIT: Is it the loss of Cooper pairs or the loss of the coherent superfluid that suppresses towards the SIT? The answer to this question is hidden in the disorder-evolution of the superconducting energy scales, i.e. the pairing amplitude and the superfluid stiffness , which is a measure for the robustness of the superfluid phase-coherence against fluctuations. The lesser of both scales determines . In order to address this question, we employ optical measurements in the THz frequency range which have turned out to be a powerful approach to access and of thin-film superconductors Pracht et al. (2016) as just one asset of optical spectroscopy in this context Steinberg et al. (2008); Pfuner et al. (2009); Xi et al. (2010); Driessen et al. (2012); Scheffler et al. (201). Our material of choice for the present study are thin films of disordered molybdenum nitride (MoN), where the SIT has not yet been observed, the suppression of with decreasing thickness and increasing electrical resistivity , however, resembles well-established SIT systems such as NbN, InO, or TiN.
II Samples and Experiment
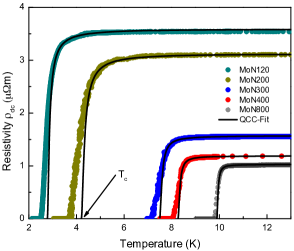
Bulk MoN is a conventional superconductor with a up to 12 K Marchand et al. (1999); Bull et al. (2004). In this work, we study several thin polycrystalline films of different thickness ranging from 8.4 to 29.6 nm with a roughness of less than 3 nm Groll et al. (2014); Klug et al. (2013); Proslier et al. (2011). The average grain size increases from 3.1 to 15.7 nm going from the thinnest (8.4 nm) to the thickest (29.6 nm) film. The crystal sizes were extracted from XRD measurements using the Scherrer formula that relates the diffraction peak width to the crystallite size. The films are grown by atomic layer deposition (ALD) on mm2 (001)-silicon substrates covered with a native oxide layer. The residue chlorine concentration (from the MoCl5 precursor used) is negligible and varies between 0.2 and 0.5% as found from Rutherford back-scattering and x-ray photo-electron measurements, respectively, and does not depend on . With decreasing we observe an increase of dc-transport resistivity and a concomitant reduction of from 9.89 to 2.78 K, see Table 1. With decreasing thickness we found a reduction of the product of Fermi wave-vector and electron mean free-path quantifying the effective degree of disorder for films grown on quartz substrates, which are from the structural and electronic point of view identical with films grown on silicon as shown by X-ray diffraction and transport measurements. Consequently, one is free to use decreasing values of and , or increasing values for as descriptive measures of growing disorder. We note, however, that this selective assignment is not assured a priori and may not apply for films beyond this work. Throughout this paper, we refer to the samples as MoNx, where x is the number of ALD cycles, which governs the film thickness. We measured the dc-transport resistivity in four-point geometry, and extract as fit parameter within the theory of quantum corrections to conductivity (QCC), capturing the superconducting fluctuations as it has been established previously Sacépé et al. (2010); Baturina et al. (2012). The resistive transitions of all samples measured are plotted in Fig. 1. We observe a broadening of the transition with decreasing thickness and , which suggests an increase of superconducting fluctuations as expected for increasing disorder. Fluctuations of the Aslamazov-Larkin type are most prominent, while the other corrections Sacépé et al. (2010); Baturina et al. (2012) play a minor role. A closer examination, however, reveals resistive tails, which cannot be accounted for by QCC fluctuations, as shown in Fig. 1, but may result from structural inhomogeneity Benfatto et al. (2009), as discussed below. Apart from transport measurements, we performed optical spectroscopy to measure the complex transmission for frequencies 3 to 38 cm-1 (0.1 to 1.1 THz) utilizing a Mach-Zehnder interferometer equipped with backward-wave oscillators as tunable sources of continuous and monochromatic THz radiation and a Golay-cell or 4He-bolometer as detectors. With a home-built optical 4He-cryostat we performed measurements down to 1.7 K Pracht et al. (2016); Hering et al. (2007). For more experimental details, see Ref. Kozlov and Volkov (1998); Dressel et al. (2008); Pracht et al. (2013).
III Methods
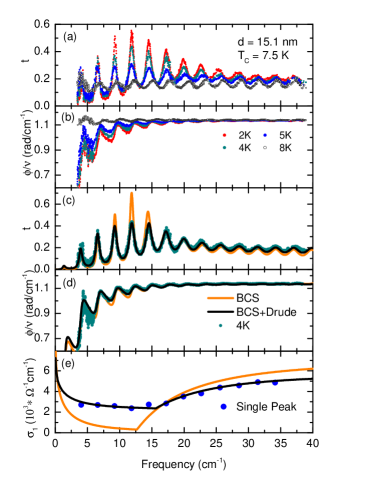
Typical spectra of transmission amplitude and phase shift normalized to frequency (relative phase shift), where = is the frequency, of a MoN sample measured in the normal and superconducting states are shown in Fig. 2(a) and (b). The pronounced oscillation pattern stems from multiple reflections inside the substrate, which acts as Fabry-Pérot resonator Pracht et al. (2013). While this pattern is constant in the normal state, it changes drastically below , which calls for a strong frequency dependence of the optical properties of the film. To model the particular behavior of and , we use the Fresnel equations for multiple reflections, where the thickness and dielectric function of substrate (s) and thin film (f) directly enter
| (1) | |||||
| (2) |
Equivalently, this can be expressed in terms of the dynamical conductivity , which is directly related to via
| (3) |
with the permittivity of the vacuum.
To disentangle the properties of substrate and film, a bare substrate was measured beforehand and its optical parameters were determined to be and independent of frequency and temperature in the range studied in this work. In what follows, we will neglect the superscripts in and always refer to the conductivity of the MoN film.
IV Results
IV.1 Anomalous dissipative conductivity
We first focus on the normal state at a temperature slightly above and the regime of superconducting fluctuations. Here, we find and of all samples to be well described by and of a normal metal, i.e. by the Drude (D) formula Dressel and Gruener (2002)
| (4) | |||||
| (5) |
where is the dc-transport conductivity, the scattering time and the scattering rate. Fig. 2 displays the raw and of a representative sample with K. Apart from the pronounced Fabry-Pérot oscillations, both and at 8 K are dispersionless, which is in agreement with a scattering rate at frequencies much higher than the studied spectral range. The same result is found for all samples and the corresponding values of are shown in Table 1.
For a conventional BCS superconductor below in the dirty limit, follows the Mattis-Bardeen (MB) equations Mattis and Bardeen (1958), which describe the dynamics of both the superfluid condensate and the thermally excited quasiparticles
| (6) | |||||
| (7) | |||||
where the function and are
| (8) | ||||
| (9) |
and is the superconducting energy gap, and are the effective carrier mass and charge, () is the Heaviside step function, is the total chemical potential, the superfluid density, and the dc-transport conductivity right above . Usually, any finite dissipative conductivity in the SC state is attributed to unpaired quasiparticles and captured by the second term in Eq. (6), so that using the notation from above. For the MoN thin films under study, however, a model based on Eq. (6) turns out to be insufficient. If we do not restrict ourselves to weak-coupling SC, the only free parameter in Eq. (6) is , whose variation alone does not lead to a reasonable fit, see the orange curve in Fig. 2. The strongest deviation appears at frequencies around , where the actual transmission amplitude is considerably smaller than the fit. This implies that in addition to the thermally excited quasiparticles another dissipative channel is present. While various complex mechanisms leading to finite in-gap absorption in disordered SC have been recently addressed in both theory Swanson et al. (2014); Cea et al. (2014, 2015) and experiment Crane et al. (2007); Bachar et al. (2014); Sherman et al. (2015), here, we can model and reasonably well by simply adding a Drude contribution to the MB dynamics
| (10) |
where the normal-state values of and in Eqs. (4) and (5) are replaced by and . We note that for a vanishing dc-transport resistance it is sufficient to have a single percolative superconducting path bypassing normal-conducting ones, whereas an optical measurement is still sensitive to non-superconducting areas because here the dissipation integrated over the entire volume is probed. Fig. 2(c) and (d) exhibits and exemplary at K in the superconducting state together with a fit to Fresnel equations with charge carrier dynamics described by Eq. (10). In this particular case, a (frequency-independent) Drude behavior with cm and (meaning that the scattering rate =1/ is considerable higher than the spectral range of the present study, and is negligibly small) fits and very well.
K. The solid lines are fits to Eq. (6) and (7).
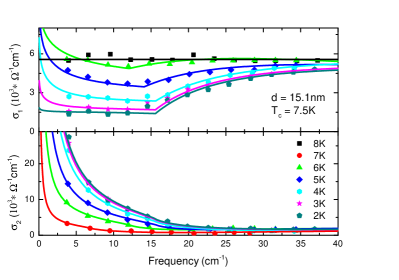
The conductivity offset is more obvious when looking directly at of the film rather than and . To obtain and , we employ a single-peak analysis and fit and in a narrow window around each Fabry-Pérot resonance by the Fresnel equations Pracht et al. (2013). For each Fabry-Pérot resonance located at a frequency we obtain a pair or or, equivalently, with a frequency dependence that is not restricted to any particular microscopic model such as Eqs. (4)-(7). Fig. 3 displays and of the same sample shown in Fig. 2 obtained from the single-peak analysis for various temperatures . The additional Drude contribution is obvious in the dissipative conductivity, where, in this particular case, the measured does not fall below cm even at our lowest temperature of 2 K. This is in disagreement with a conventional superconductor, where at one would expect almost no dissipation inside the spectral gap.
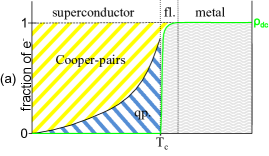
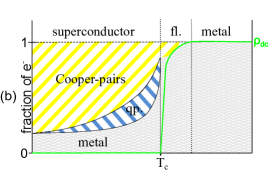
The behavior of charge carriers in a conventional superconductor is sketched in FIG. 4(a), where only Cooper-pairs and thermally excited quasiparticles are present below . However, in our MoN films, we find charge carriers with metallic properties even below . Thus we suggest a model for superconducting MoN featuring metallic states below as it is sketched in FIG. 4(b).
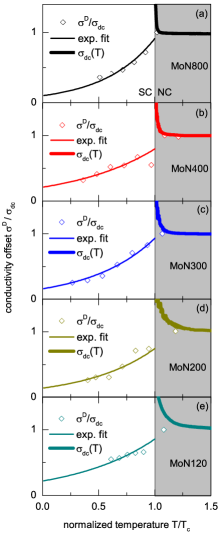
It is important to stress that this phenomenon is not restricted to a single film, but turns out to be a general feature of all MoN films studied, and furthermore, the temperature-dependence of can be fitted by a phenomenological function
| (11) |
Fig. 5 displays of all samples studied in this work together with fits by Eq. (11). Values of the fit parameters and we listed in Table 2. Neither nor render a discernible thickness dependence.
| sample | ||
|---|---|---|
| MoN120 | ||
| MoN200 | ||
| MoN300 | ||
| MoN400 | ||
| MoN800 |
One conceivable explanation attributes the dissipative contribution to intrinsic inhomogeneity. The assigned is the mean-field temperature, where superconducting percolation across the sample sets in, while separate regions may become superconducting already at a higher critical temperature. Similarly, some regions may remain normal-conducting down to temperatures well below . As temperature drops, more and more regions eventually become superconducting, and the remaining dissipative contribution shrinks. Indeed, thin films of TiN and NbN with only marginal disorder and no structural inhomogeneity do not show a finite contribution in the superconducting state Pracht et al. (2012, 2013). Note, that this inhomogeneity does not necessarily require structural inhomogeneities, but may result from homogeneous disorder leading to an electronically inhomogeneous state as it was shown directly Sacépé et al. (2008); Kamlapure et al. (2013) and indirectly Sacépé et al. (2010); Mondal et al. (2011, 2013) for similar thin films of TiN and NbN. In addition Benfatto et al. (2009), an inhomogeneous superfluid density, as it may result from either structural or electronic inhomogeneity, causes anomalous tails in the temperature dependence of the dc resistivity that themselves cannot be attributed to superconducting or Berezinskii-Kosterlitz–Thouless type fluctuations. As shown in Fig. 1, we indeed observe such resistive tails for all samples, which cannot be captured by fluctuations. Given that this tail is present irrespective of thickness calls for an intrinsic structural inhomogeneity rather than emergent electronic inhomogeneity usually relevant only at strong disorder near the superconductor-insulator transition Sacépé et al. (2008); Kamlapure et al. (2013); Sacépé et al. (2010); Mondal et al. (2011, 2013). The ALD growth of MoN thin films generally initiates with the growth of a 1-2 nm layer of Mo2N before MoN growth sets in. The enhancement of absolute dissipative conductivity with increasing MoN film thickness suggests that the ubiquitous 1-2 nm Mo2N layer does not serve as explanation for the anomalous dissipation but may only contribute a small universal offset.
IV.2 Pairing amplitude, superfluid density, and
superfluid stiffness
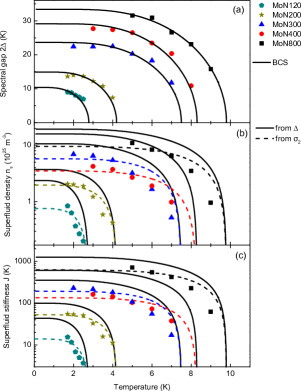
We now turn to the superconducting contribution in Eq. (10), and the energy scales, i.e. pairing energy and superfluid stiffness , and the superfluid density , which we extract from within Mattis-Bardeen theory. We obtain by fitting by Eq. (6) and (10), where enters as threshold energy of pair-breaking, the spectral gap . In Fig. 6(a) we plot the temperature evolution of for all samples together with a fit to the universal BCS behavior of obtained by solving the self-consistency equationLikharev (1979)
| (12) |
where with are the Matsubara frequencies. The good agreement between theory and experiment allows to extrapolate and calculate the ratio , see Table 1, which is close to the weak-coupling prediction of 3.53 for all samples. The second energy scale, , is closely related to , which, on the one hand, withdraws from direct access being the weight of the function in the superfluid response of Eq. (6). On the other hand, the superfluid condensate dominates [ and therefore, following Kramers-Kronig relations, also determines at small, but finite frequencies. Considering the Kramers-Kronig transform for the superfluid contribution to
| (13) |
one finds the relation
| (14) |
using and . Fig. 6(b) displays of all samples versus temperature obtained from Eq. (14). The dashed lines are fits to the two-fluid approximationDressel and Gruener (2002), and also here the good agreement between theory and experiment allows to reliably extrapolate at zero temperature. Starting with the thinnest film, rises as thickness increases. With the BCS temperature-dependence of ,
| (15) |
inserted into Eq. (14) one readily obtains
| (16) |
which explains the rise of with increasing thickness by the simultaneous increase of and decrease of . A calculation of via Eq. (16) and as obtained from , leads to the solid lines in Fig. 6(b) and an overestimation of the superfluid density. This can be understood as natural consequence of the dissipative offset: While a constant value of below does not change the location of the pair-breaking absorption threshold in and consequently leaves unaffected, the actual superfluid density is reduced by the number of metallic electrons not participating in the superfluid state. Therefore, considering the preservation of the spectral weight, the value of obtained directly from should be smaller than the one calculated from .
Fig. 6(c) displays the superfluid stiffness as calculated from via Benfatto et al. (2009)
| (17) |
with the superconducting penetration depth and the film thickness. While the temperature dependence of and is identical up to a numerical factor, the latter quantity has the dimension of energy and can be compared to the other relevant energy scales. The good agreement of , and with the BCS theory and extensions thereof down to our most-disordered sample constrains the regime where effects stemming from the SIT become relevant to samples with even lower K. Fig. 7 displays the zero-temperature extrapolations of the superconducting energy scales, , and as function of resistivity (film thickness). For better comparison, all scales are expressed in units of temperature.
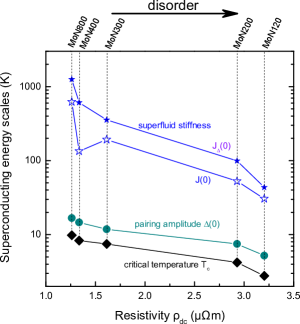
With increasing , all energy scales show a clear decrease, which is strongest for . This behavior is in agreement with the Mattis-Bardeen theory, where is related to via
| (18) |
where the additional factor causes the stronger reduction. Nevertheless, we find for all films in agreement with an amplitude-driven transition, where superconductivity ceases when the pairing amplitude becomes zero at , i.e. due to the loss of pairing rather than phase-coherence. The mismatch between as calculated from and , see Fig. 7, is a direct consequence of the dissipative conductivity .
V Conclusion
We studied the dynamical conductivity of a series of disordered MoN thin films with different thickness (and resistivity ) ranging from 8.4 to 29.6 nm by means of THz spectroscopy and electrical transport, and extracted the pairing amplitude , the superfluid density , and the superfluid stiffness within BCS theory. The temperature dependence of , and is well described within the conventional theory and the evolution with suggests superconductivity to cease at due to the loss of pairing rather than phase coherence. The real part shows an anomalous dissipative contribution in the superconducting state that cannot be accounted for by ordinary quasiparticle dynamics within the Mattis-Bardeen (MB) theory. This frequency-independent contribution is found for all MoN samples under study and is suppressed with decreasing temperature. In addition, the superfluid density calculated from is smaller than predicted by MB theory for corresponding pairing amplitude. Together with tails in the resistivity curves below , all these findings suggest the presence of normal-conducting regions surviving into the globally superconducting state, possibly due to structural inhomogeneity, as explanation of the anomalous optical properties. The agreement of the superconducting properties with the BCS and MB theory holds for all samples, which restricts effects stemming from the SIT to samples with lower than at least 2.78 K. Our characterization of superconducting MoN thin films is of interest for the development of applications such as microwave resonators Göppl et al. (2008); Scheffler et al. (2013); Singh et al. (2014); Ohya et al. (2014) or ultra-sensitive photon detection Natarajan et al. (2012); Gao et al. (2012); Szypryt et al. (2015) and it can serve as reference for studies on other superconductors where the role of inhomogeneity is presently discussed Gantmakher and Dolgopolov (2010); Lin et al. (2015); Stewart et al. (2007); Eley et al. (2012); Han et al. (2014); Biscara et al. (2013). At the same time, further studies using local probes, e.g. scanning tunneling microscopy, are highly desirable to test the idea of inhomogeneous superconductivity on MoN thin films.
We acknowledge discussion with Lara Benfatto, Ina Schneider, and Christoph Strunk. U.S.P. thanks the Studienstiftung des Deutschen Volkes for financial support. J.A.K. and T.P. acknowledge support from the Department of Energy, Office of Sciences, Office of High Energy Physics, Early Career Award FWP 50335.
References
- Anderson (1959) P. W. Anderson, J. Phys. Chem. Solids 11, 26 (1959).
- Gantmakher and Dolgopolov (2010) V. F. Gantmakher and V. T. Dolgopolov, Phys.-Usp. 53, 1 (2010).
- Lin et al. (2015) Y.-H. Lin, J. Nelson, and A. Goldman, Physica C 514, 130 (2015).
- Sachdev (2011) S. Sachdev, Quantum Phase Transitions, 2nd ed. (Cambridge University Press, 2011).
- Sacépé et al. (2008) B. Sacépé, C. Chapelier, T. I. Baturina, V. M. Vinokur, M. R. Baklanov, and M. Sanquer, Phys. Rev. Lett. 101, 157006 (2008).
- Kamlapure et al. (2013) A. Kamlapure, T. Das, S. C. Ganguli, J. B. Parmar, B. S., and P. Raychaudhuri, Sci. Rep. 3, 2979 (2013).
- Baturina et al. (2005) T. I. Baturina, J. Bentner, C. Strunk, M. R. Baklanov, and A. Satta, Physica B , 359 (2005).
- Baturina et al. (2007) T. I. Baturina, A. Y. Mironov, V. M. Vinokur, M. R. Baklanov, and C. Strunk, Phys. Rev. Lett. 99, 257003 (2007).
- Lemarié et al. (2013) G. Lemarié, A. Kamlapure, D. Bucheli, L. Benfatto, J. Lorenzana, G. Seibold, S. C. Ganguli, P. Raychaudhuri, and C. Castellani, Phys. Rev. B 87, 184509 (2013).
- Ovadia et al. (2013) M. Ovadia, D. Kalok, B. Sacépé, B., and D. Shahar, Nat. Phys. 9, 415 (2013).
- Liu et al. (2011) W. Liu, M. Kim, G. Sambandamurthy, and N. P. Armitage, Phys. Rev. B 84, 024511 (2011).
- Mondal et al. (2011) M. Mondal, A. Kamlapure, M. Chand, G. Saraswat, S. Kumar, J. Jesudasan, L. Benfatto, V. Tripathi, and P. Raychaudhuri, Phys. Rev. Lett. 106, 047001 (2011).
- Sacépé et al. (2010) B. Sacépé, B., C. Chapelier, T. I. Baturina, V. M. Vinokur, M. R. Baklanov, and M. Sanquer, Nat. Commun. 1, 140 (2010).
- Sacépé et al. (2011) B. Sacépé, T. Dubouchet, C. Chapelier, M. M. Sanquer M.Sanquer, D. Shahar, M. Feigel’man, and L. Ioffe, Nat. Phys. 7, 239 (2011).
- Mondal et al. (2013) M. Mondal, A. Kamlapure, S. C. Ganguli, J. Jesudasan, V. Bagwe, L. Benfatto, and P. Raychaudhuri, Sci. Rep. 3, 1357 (2013).
- Chockalingam et al. (2009) S. P. Chockalingam, M. Chand, A. Kamlapure, J. Jesudasan, A. Mishra, V. Tripathi, and P. Raychaudhuri, Phys. Rev. B 79, 094509 (2009).
- Natarajan et al. (2012) C. M. Natarajan, M. G. Tanner, and R. H. Hadfield, Supercond. Sci. Tech. 25, 063001 (2012).
- Ilin et al. (2012) K. Ilin, M. Hofherr, D. Rall, M. Siegel, A. Semenov, A. Engel, K. Inderbitzin, A. Aescherbach, and A. Schilling, J. Low Temp. Phys. 167, 809 (2012).
- Henrich et al. (2012) D. Henrich, S. Dörner, M. Hofherr, K. Il’in, A. Semenov, E. Heintze, M. Scheffler, M. Dressel, and M. Siegel, J. Appl. Phys. 112, 074511 (2012).
- Proslier et al. (2011) T. Proslier, J. Klug, N. Becker, J. Elam, and M. Pellin, ECS Transactions 41 (2), 237 (2011).
- Pracht et al. (2016) U. S. Pracht, N. Bachar, L. Benfatto, G. Deutscher, E. Farber, M. Dressel, and M. Scheffler, Phys. Rev. B 93, 100503 (2016).
- Steinberg et al. (2008) K. Steinberg, M. Scheffler, and M. Dressel, Phys. Rev. B 77, 214517 (2008).
- Pfuner et al. (2009) F. Pfuner, L. Degiorgi, V. M. Vinokur, T. I. Baturina, and M. R. Baklanov, New J. Phys. 11, 113017 (2009).
- Xi et al. (2010) X. Xi, J. Hwang, C. Martin, D. B. Tanner, and G. L. Carr, Phys. Rev. Lett. 105, 257006 (2010).
- Driessen et al. (2012) E. F. C. Driessen, P. C. J. J. Coumou, R. R. Tromp, P. J. de Visser, and T. M. Klapwijk, Phys. Rev. Lett. 109, 107003 (2012).
- Scheffler et al. (201) M. Scheffler, M. M. Felger, M. Thiemann, D. Hafner, K. Schlegel, M. Dressel, K. S. Ilin, M. Siegel, S. Seiro, C. Geibel, and F. Steglich, Acta IMEKO 4, 47 (201).
- Marchand et al. (1999) R. Marchand, F. Tessier, and F. J. DiSalvo, J. Mater. Chem. 9, 297 (1999).
- Bull et al. (2004) C. L. Bull, P. F. McMillan, E. Soignard, and K. Leinenweber, J. Solid State Chem. 177, 1488 (2004).
- Groll et al. (2014) N. R. Groll, J. A. Klug, C. Cao, S. Altin, H. Claus, N. G. Becker, J. F. Zasadzinski, M. J. Pellin, and T. Proslier, Appl. Phys. Lett. 104, 092602 (2014).
- Klug et al. (2013) J. Klug, N. G. Becker, N. R. Groll, C. Cao, M. S. Weimer, M. J. Pellin, J. F. Zasadzinski, and T. Proslier, Appl. Phys. Lett. 103, 211602 (2013).
- Baturina et al. (2012) T. I. Baturina, S. V. Postolova, A. Y. Mironov, A. Glatz, M. R. Baklanov, and V. M. Vinokur, EPL 97, 017012 (2012).
- Benfatto et al. (2009) L. Benfatto, C. Castellani, and T. Giamarchi, Phys. Rev. B 80, 214506 (2009).
- Hering et al. (2007) M. Hering, M. Scheffler, M. Dressel, and H. v. Löhneysen, Phys. Rev. B 75, 205203 (2007).
- Kozlov and Volkov (1998) G. Kozlov and A. Volkov, Top. Appl. Phys. 74, 51 (1998).
- Dressel et al. (2008) M. Dressel, N. Drichko, B. Gorshunov, and A. Pimenov, IEEE J. Sel. Top. Quantum Electron. 14, 399 (2008).
- Pracht et al. (2013) U. S. Pracht, E. Heintze, C. Clauss, D. Hafner, R. Bek, D. Werner, S. Gelhorn, M. Scheffler, M. Dressel, D. Sherman, B. Gorshunov, K. S. Il’In, D. Henrich, and M. Siegel, IEEE Trans. Terahertz Sci. Technol. 3, 269 (2013).
- Dressel and Gruener (2002) M. Dressel and G. Gruener, Electrodynamics of Solids (Cambridge University Press, 2002).
- Mattis and Bardeen (1958) D. C. Mattis and J. Bardeen, Phys. Rev. 111, 412 (1958).
- Swanson et al. (2014) M. Swanson, Y. L. Loh, M. Randeria, and N. Trivedi, Phys. Rev. X 4, 021007 (2014).
- Cea et al. (2014) T. Cea, D. Bucheli, G. Seibold, L. Benfatto, J. Lorenzana, and C. Castellani, Phys. Rev. B 89, 174506 (2014).
- Cea et al. (2015) T. Cea, C. Castellani, G. Seibold, and L. Benfatto, Phys. Rev. Lett. 115, 157002 (2015).
- Crane et al. (2007) R. W. Crane, N. P. Armitage, A. Johansson, G. Sambandamurthy, D. Shahar, and G. Grüner, Phys. Rev. B 75, 094506 (2007).
- Bachar et al. (2014) N. Bachar, U. S. Pracht, E. Farber, M. Dressel, G. Deutscher, and M. Scheffler, J. Low Temp. Phys. 179, 83 (2014).
- Sherman et al. (2015) D. Sherman, U. S. Pracht, B. Gorshunov, S. Poran, J. Jesudasan, M. Chand, P. Raychaudhuri, M. Swanson, N. Trivedi, A. Auerbach, M. Scheffler, and M. Dressel, Nat. Phys. 11, 188 (2015).
- Pracht et al. (2012) U. S. Pracht, M. Scheffler, M. Dressel, D. Kalok, C. Strunk, and T. Baturina, Phys. Rev. B 86, 184503 (2012).
- Likharev (1979) K. K. Likharev, Rev. Mod. Phys. 51, 101 (1979).
- Göppl et al. (2008) M. Göppl, A. Fragner, M. Baur, R. Bianchetti, S. Filipp, J. M. Fink, P. J. Leek, G. Puebla, L. Steffen, and A. Wallraff, J. Appl. Phys. 104, 113904 (2008).
- Scheffler et al. (2013) M. Scheffler, K. Schlegel, C. Clauss, D. Hafner, C. Fella, M. Dressel, M. Jourdan, J. Sichelschmidt, C. Krellner, C. Geibel, and F. Steglich, Phys. Status Solidi B 250, 439 (2013).
- Singh et al. (2014) V. Singh, B. H. Schneider, S. J. Bosman, E. P. J. Merkx, and G. A. Steele, Appl. Phys. Lett. 105, 222601 (2014).
- Ohya et al. (2014) S. Ohya, B. Chiaro, A. Megrant, C. Neill, R. Barends, Y. Chen, J. Kelly, D. Low, J. Mutus, P. J. J. O’Malley, P. Roushan, D. Sank, A. Vainsencher, J. Wenner, T. C. White, Y. Yin, B. D. Schultz, C. J. Palmstrøm, B. A. Mazin, A. N. Cleland, and J. M. Martinis, Supercond. Sci. Tech. 27, 015009 (2014).
- Gao et al. (2012) J. Gao, M. R. Vissers, M. O. Sandberg, F. C. S. da Silva, S. W. Nam, D. P. Pappas, D. S. Wisbey, E. C. Langman, S. R. Meeker, B. A. Mazin, H. G. Leduc, J. Zmuidzinas, and K. D. Irwin, Appl. Phys. Lett. 101, 142602 (2012).
- Szypryt et al. (2015) P. Szypryt, B. Mazin, B. Bumble, H. Leduc, and L. Baker, IEEE Trans. Appl. Supercond. 25, 1 (2015).
- Stewart et al. (2007) M. D. Stewart, A. Yin, J. M. Xu, and J. M. Valles, Science 318, 1273 (2007).
- Eley et al. (2012) S. Eley, S. Gopalakrishnan, P. M. Goldbart, and N. Mason, Nat. Phys. 8, 59 (2012).
- Han et al. (2014) Z. Han, A. Allain, H. Arjmandi-Tash, K. Tikhonov, M. Feigel’man, B. Sacépé, B., and V. Bouchiat, Nat. Phys. 10, 380 (2014).
- Biscara et al. (2013) J. Biscara, N. Bergeal, S. Hurand, C. Feuillet-Palma, A. Rastogi, R. C. Budhani, M. Grilli, S. Caprara, and J. Lesueur, Nat Mater 12, 542 (2013).