Study of spin-phonon coupling and magnetic field induced spin reorientation in polycrystalline multiferroic
Abstract
The present work reports the preparation of polycrystalline multiferroic (GdFO) and characterization with x-ray diffraction (XRD), magnetization, temperature dependent Raman spectroscopy, temperature and magnetic field dependent Mssbauer spectroscopy measurements. The sample is found to be phase pure from Rietveld refinement of XRD pattern. The Mssbauer spectra measured in the presence of external magnetic field show the signatures of field induced spin reorientation transition, which are corroborated by magnetization measurements. From the temperature dependent variation of internal hyperfine field, Nel transition temperature () of 672.50.2 K and critical exponent () of 0.3330.003 is obtained. Temperature dependent (300 - 760 K) Raman spectroscopy measurements show the signatures of spin-phonon coupling and local structural re-arrangement across .
pacs:
75.85.+t , 76.80.+yI Introduction
In recent years, multiferroic / magneto-electric (ME) materials are the subject of active research because of rich physics they exhibit and also various potential applications Prellie et al. [2005], Cheong and Mostovoy [2007], Ramesh and Spaldin. [2007], Rao et al. [2012]. Multiferroic materials show electric and magnetic ordering simultaneously with a coupling between the two order parameters and therefore offer an extra degree of freedom in device design Prellie et al. [2005], Cheong and Mostovoy [2007], Ramesh and Spaldin. [2007], Rao et al. [2012]. In order to have considerable ME coupling it is reported that magnetism induced polarization is more favorable Prellie et al. [2005], Cheong and Mostovoy [2007], Ramesh and Spaldin. [2007]. Rare-earth ortho-ferrites ( with R being rare-earth ion) comes under this category of multiferroic materials Rao et al. [2012].
In general, compounds crystallize in orthorhombic distorted () perovskite structure with centro-symmetric space group Pbnm and exhibits - , - and - magnetic exchange interactions resulting in various magnetic transitions viz., paramagnetic to antiferromagnetic (AFM) ordering of ions (Nel transition ()), spin-reorientation transition of ions () and magnetic ordering of rare-earth ions White. [1969], Treves. [1962]. In almost all of compounds, the weak ferromagnetic moment reorients from the orthorhombic a axis at low temperatures to the c axis at high temperatures. This temperature induced spin flop is known as spin-reorientation transition (SRT) i.e., a transition in which spins reorient from one crystallographic axis to another. For example, exhibits paramagnetic to weak ferromagnetic transition corresponding to at about 645 K, SRT of spins from canted AFM to collinear AFM state at about 62 K below which the weak ferromagnetism disappears and finally AFM ordering of at low temperatures ( 4 K) Zhou et al. [2014]. Similarly (GdFO) exhibits paramagnetic to weak ferromagnetic transition corresponding to at about = 660 K and AFM ordering of below 2.5 K Tokunaga et al. [2009], Zhou et al. [2014]. It is to be noted that temperature induced SRT is not observed in GdFO, but rather it exhibits magnetic field induced SRT phenomena and the critical field required to induce SRT is found to be temperature dependent Durbin et al. [1977].
Recently, Tokunaga et al., have reported that single crystal (GdFO) exhibits not only a weak ferromagnetism but also a ferroelectric ground state and demonstrated the mutual controllability of the two order parameters Tokunaga et al. [2009]. The appearance of FE ordering is explained in terms of the exchange interaction between the Gd and Fe spins. Similarly is another rare-earth ortho-ferrite which is recently reported to exhibit magnetic field induced ferroelectricity and large ME coupling at about 4 K in single crystal form. The phenomena is explained in terms of exchange-striction between adjacent and layers with the respective layered antiferromagnetic (AFM) components Y.Tokunaga et al. [2008]. However, FE polarization is reported in the weak ferromagnetic region ( T ) of polycrystalline without applying external magnetic field which suggests that the rare earth magnetic ordering is not essential for FE but weak ferromagnetism is sufficient Rajeswaran et al. [2013]. Similarly, spin-canting induced improper FE and spontaneous magnetization is reported in another rare-earth orthoferrite viz., , whose origin is being debated Lee et al. [2011], Johnson et al. [2012], Kuo et al. [2014]. Therefore, the role of these magnetic transitions on the occurrence of FE ordering and hence multiferroic nature in these compounds is yet to be clearly established.
Mssbauer spectroscopy is a unique technique to study different magnetic transitions such as temperature and magnetic field induced SRT phenomena N and C [1971]. But most of the Mssbauer literature deals with the study of single crystal compounds, in which there exists a well defined angular relation between spins and the incident gamma rays, either as a function of temperature or applied magnetic fields Durbin et al. [1977], O.Nikolov et al. [1995]. It may be noted because of the fact that there is a random distribution of spins in polycrystals, there is a possibility of missing these kind of transitions when explored using high field Mssbauer spectroscopy. Probably because of this, the high field Mssbauer spectroscopy has been used only for limited AFM polycrystals such as goethite (-FeOOH), haematite (), barium ferrite etc., to study SRT phenomena Chappert [1974], Pankhurst and Pollard. [1990], Pankhurst [1991]. However, as most of recent literature on compounds deal with the polycrystalline state of the samples Zhou et al. [2014], Rajeswaran et al. [2013], it would be required to explore the SRT phenomena in polycrystals too using suitable techniques and in the present work we show that low temperature high magnetic field Mssbauer spectroscopy gives the signatures of SRT in polycrystalline .
Other aspect that is being recently reported is the role of spin-phonon coupling in stabilizing the FE ordering in similar compounds i.e., rare-earth chromites / manganites ( or ). For example, Ferreira et al., reported spin phonon coupling as the origin of multiferroicity in Ferreira et al. [2009]. Mandal et al., reported the spin-phonon coupling in Mn doped P et al. [2011]. Bhadram et al., reported the Raman spectroscopy measurements of different orthochromites and concluded that the spin-phonon coupling is observed only for those cases in which the rare-earth ion is magnetic and concluded that spin-phonon coupling play important role in inducing FE ordering in type of compounds Bhadram et al. [2013]. Therefore, study of phonons is expected to give the information regarding spin-phonon coupling, which has been argued to play important role in stabilizing the multiferroic ordering Ferreira et al. [2009], P et al. [2011]. Temperature dependent Raman spectroscopy across the transition temperatures is considered to be an effective tool to probe structural transitions, spin-phonon, spin-lattice coupling etc., in different materials Ferreira et al. [2009], P et al. [2011], Bhadram et al. [2013].
In view of the above mentioned issues, in the present work we report the preparation of polycrystalline (GdFO) and the study of magnetic field induced SRT using low temperature high magnetic field Mssbauer, spin-phonon coupling using temperature dependent Raman spectroscopy, bulk magnetization measurements.
II Experimental
Polycrystalline (GdFO) is prepared with the conventional solid state route. X-ray diffraction (XRD) measurements are carried out using D8-Discover system of M/s Brucker equipped with Cu-K radiation. The dc-magnetization measurements were carried out using Quantum Design 14 Tesla PPMS-VSM. The Mssbauer measurements were carried out in transmission mode with a (Rh) radioactive source in constant acceleration mode using a standard PC-based Mssbauer spectrometer equipped with a WissEl velocity drive. Velocity calibration of the spectrometer was carried out with a natural iron absorber at room temperature. For the low temperature and high magnetic field measurements, the sample was placed inside a Janis superconducting magnet. The direction of the external field is parallel to gamma rays. For high temperature (300 - 683 K) Mssbauer measurements, the sample, in argon gas flow, is placed inside a specially designed Mssbauer furnace (MF-1100) with a temperature accuracy of about C. Raman spectra were recorded in back-scattering geometry using Jobin Yvon Horibra LABRAM spectrometer using He-Ne laser of 632.8nm as the excitation source. High temperature Raman measurements were carried out in THMS600 sample stage of Linkam Scientific instruments Ltd.
III Results and Discussions
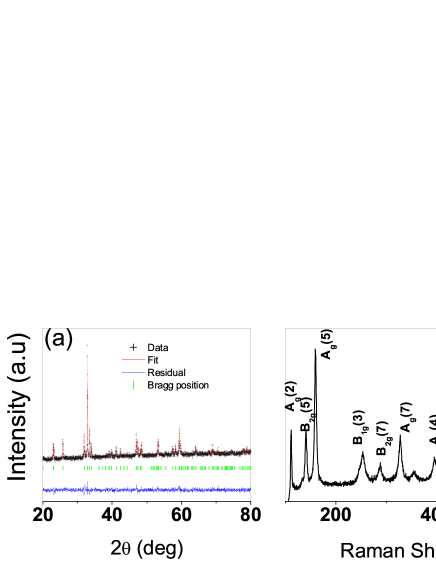
Figure-1(a) show the x-ray diffraction (XRD) pattern of the prepared GdFO sample along with Rietveld refinement. The XRD is fitted with Rietveld refinement, considering orthorhombic structure with Pbnm space group using FullProf software J. [1993]. The XRD data confirms the single phase of the prepared sample and the refined lattice parameters viz., a=0.536 0.001 nm, b=0.562 nm and c=0.768 nm, match well with literature Zhou et al. [2014]. Figure-1(b) show the room temperature Raman spectrum of the prepared GdFO sample along with the identified Raman modes. Experimentally observed Raman modes are assigned to the corresponding phonon mode with the help of lattice dynamical calculations reported earlier Venugopalan et al. [1985], Gupta and Ashdhir [1999]. According to the group theory, the irreducible representation for compounds is given by = in which 24 are Raman-active modes, 28 are infrared modes and 8 are inactive modes Venugopalan et al. [1985], Gupta and Ashdhir [1999], Bhadram et al. [2013]. The observed Raman modes of GdFO match closely with the recently reported Raman data of GdFO and also the other compounds Du et al. [2010], Wiglusz et al. [2015]. After confirming the single phase of the prepared sample, detailed measurements viz., temperature and magnetic field dependent bulk magnetization, Mssbauer and temperature dependent Raman spectroscopy are carried out on the prepared sample.
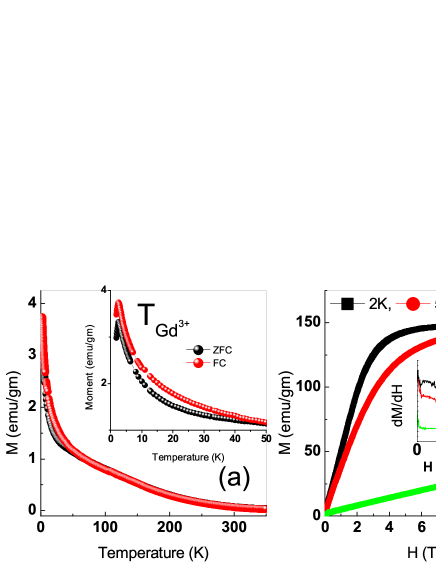
Figure-2(a) show the temperature dependent magnetization (M-T) data of the sample measured in 500 Oe field under zero-field cooling (ZFC) and field cooling (FC) protocol. One can clearly see the signatures of magnetic ordering of ions at about 2.5 K as shown in the inset of figure-2(a). Figure-2(b) shows the M-H data measured at different temperatures. The data measured at 100 K is linear till the highest field i.e., 14 Tesla, which is typically the case for antiferromagnetic samples. However, a change of curvature i.e., non-linear magnetization response is observed for the M-H data measured at 5 and 2 K. One can understand these observations in terms of magnetic field induced spin re-orientation transition (SRT). In literature, the spin-flop field is taken as the field at which a maximum appears in the derivative of M and H curves as shown in inset of Figure-2(b) Zysler et al. [2003]. At 5 K the transition seems to occur over a wide range of fields as compared to 2 K and also the transition at 2 K is taking place relatively at lower fields as compared to 5 K data. It is to be noted that spin-flop transition field would depend upon strength of exchange interaction and anisotropy field. The present results can be understood by realizing that at low temperatures (2 K) the magnetic ordering of ions essentially amplifies the effect of applied magnetic field on the SRT phenomena. Further, to study the SRT phenomena and AFM-PM transition, temperature and field dependent Mssbauer measurements are carried out as discussed below.
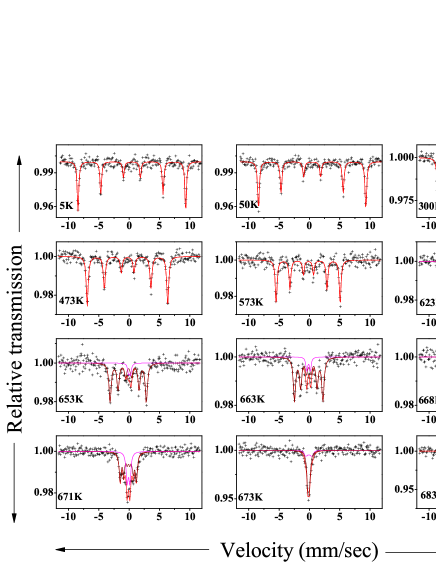
Mssbauer spectroscopy gives the information about the magnetic interactions like spin reorientation, spin canting, magnetic ordering, order-disorder transitions etc., unambiguously N and C [1971]. In order to investigate the temperature dependence of the iron sublattice magnetization, a systematic study of Mssbauer spectroscopy was carried out in the temperature (5-683 K) range and with external applied magnetic field at low temperatures. Figure-3 show the temperature dependent Mssbauer spectra of the prepared GdFO sample. Mssbauer spectra show six line pattern even at room temperature, which is consistent with the fact that the of GdFO is reported to be around 660 K Zhou et al. [2014]. The observed Mssbauer data is similar to that of Eibschutz et al Eibschutz et al. [1967]., in which Mssbauer spectra of several orthoferrites is reported. The Mssbauer data covering wide range of temperatures i.e., below and above is fitted by Eibschutz et al., considering only one site as orthoferrites are expected to have only one type crystallographic iron site Eibschutz et al. [1967]. The same methodology is used in the present work. The observed Mssbauer spectra along with the fitting using NORMOS-SITE software at specified temperatures are shown in Figure-3. All the spectra up to 573 K are fitted with single six-line pattern. However between 623-673 K the data is well fitted with one sextet and one doublet indicating the co-existence of magnetic ordering and paramagnetic behavior, which might be associated with the critical fluctuations near the transition temperature Eibschutz et al. [1967]. At 683 K the Mossbauer spectrum is fitted with only paramagnetic doublet indicating the Nel transition of Fe-sublattice from antiferromagnetic ordering to paramagnetic ordering. Obtained values of hyperfine parameters like internal magnetic hyperfine field (), isomer shift (IS), quadrupole splitting (QS) with the temperature match with the literature Eibschutz et al. [1967]. The obtained as a function of temperature is plotted in Figure-4.
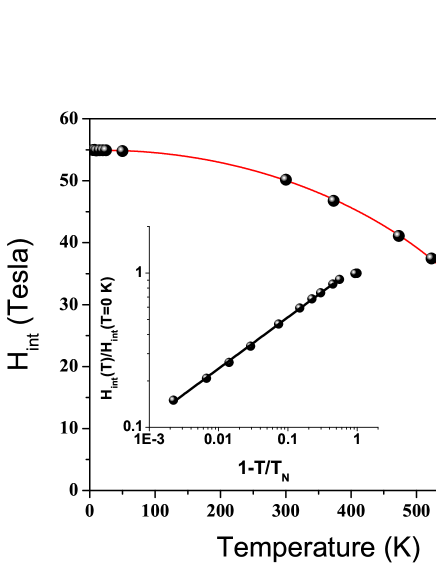
For temperatures not sufficiently close to transition temperature, the temperature dependence of is given by (T)/() = B [1+A +O ], where t=1-T/, is the critical exponent for spontaneous magnetization, A is the correction-to-scaling amplitude and is the correction-to-scaling exponent Simopoulos et al. [1999]. The least square fit of the data as shown in Figure-4, resulted in the estimation of parameters viz., as 672.50.2 K and value of 0.3150.002, () of 55.1 Tesla and is fixed at 0.55. The obtained value of matches reasonably with the reported value of GdFO Zhou et al. [2014]. However, the value of critical exponents are expected to be meaningful and accurate, if they are estimated from the region close to transition. The temperature dependence of in the vicinity of transition temperatureEibschutz et al. [1967], Blaauw and van der Woude [1973] is often described by the formula (T) () . Plot of (T) / () versus 1-T/ on a double logarithmic scale yields a straight line as shown in the inset of Figure-4. The straight line fit to the data in the region of 1-T/ 0.55 gives the value of the critical exponent as 0.3330.003. The obtained indicates that the temperature dependence of internal hyperfine fields in GdFO follows the one-third law found in three-dimensional (3D) Heisenberg magnets. It is to be noted that the importance of estimation of critical exponents in multiferroic materials has recently been highlighted Scott. [2011], Poirier and Laliberte [2007], Sharma et al. [2012]. Since Mssbauer measurements are basically zero external magnetic field measurements, the obtained value of is expected to be more realistic as compared to that obtained from bulk magnetization measurements Scott. [2011], Poirier and Laliberte [2007], Sharma et al. [2012].
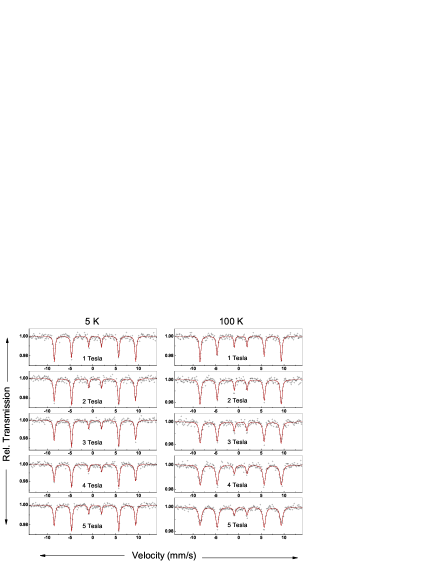
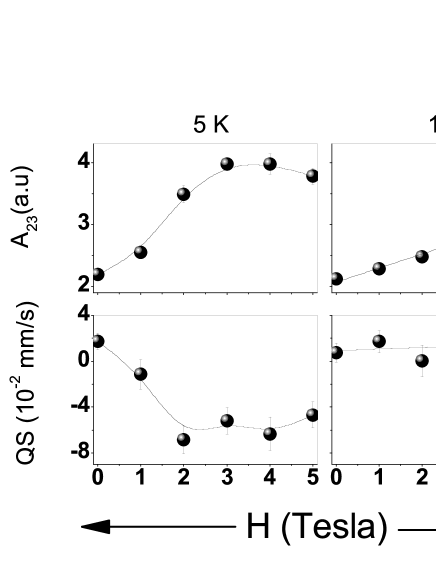
Figure-5 shows the Mssbauer spectra measured at 5 and 100 K under the application of external magnetic field, to study the field induced SRT phenomena. Mssbauer spectra contain information on the spin direction viz., angle between the spins and the gamma-ray beam (), which determines the relative intensity of the m=0 lines in the magnetic spectrum according to the relation 3: 4 /(1 + ): 1 in thin absorber limit N and C [1971]. It is to be noted that AFM materials with the application of external magnetic field () display a wide variety of phase transitions in addition to AFM-PM transition at the Nel temperature. If is applied along the easy axis of magnetization of a uniaxial AFM below Nel temperature, after a certain critical field depending on the anisotropy of the sample a first-order phase transition occurs and the spins rotate in a direction perpendicular to , which is known as spin-flop transition. With further increase of , the spins tip toward each other and exhibit a second-order phase transition to a phase (spin-parallel) in which the spins are parallel to the easy magnetization axis. The spin-flop transition is characterized by a sextet with an effective field of and m=0 lines with maximum intensity, whereas the spin-parallel phase is characterized by a sextet with an effective field of and zero intensity of m=0 lines Chappert [1974]. Many reports are published in single crystal compounds, in which there exists a well defined angular relation between spins and the incident gamma rays, either as a function of temperature or applied magnetic fields exhibiting the variation of intensity of m=0 lines taken as a finger print for the SRT phenomena Durbin et al. [1977].
In the present sample, one can also see that there is a variation in intensity of second and fifth lines of Mssbauer sextet i.e., lines corresponding to m=0 transition as a function of applied external field (Figure-5). This feature is often denoted by (area ratio of second and third lines) in a given sextet and is expected to be around 2.0 for polycrystalline sample corresponding to random spin orientation in zero applied magnetic field N and C [1971]. In view of the noticeable intensity variation of the m=0 lines as a function of applied magnetic field, the Mssbauer data of the present study is fitted by keeping parameter as free variable and the obtained variation is shown in Figure-6. One can clearly see that variation resembles with that of M-H data as shown in figure-2(b). Quadrupole splitting (QS) is the other hyperfine parameter which gives information about SRT. In the magnetically ordered state, the presence of QS is usually treated as a small perturbation on the magnetically split nuclear energy levels given as , where I=3/2, e is the electron charge, Q is nuclear quadrupole moment, is the electric field gradient (EFG) component in the direction of quantization of nuclear moment i.e., the direction of N and C [1971], Eibschutz et al. [1967]. Therefore, for SRT in which spins reorient from one crystallographic axis to another, the QS is expected to change sign. This phenomena is observed in various single crystal samples such as Ho doped O.Nikolov et al. [1995]. In the present work also as shown in Figure-6, the variation of QS mimics the variation of indicating the field induced SRT in polycrystalline GdFO.
Therefore, the non-linear M-H data at 5 K is essentially due to the magnetic field induced SRT phenomena. The critical fields required to induce the SRT phenomena are quite different in polycrystalline GdFO as compared to single crystal GdFO as reported by Durbin et al Durbin et al. [1977]. For the single crystal GdFO at 4.2 K the magnetic field required to induce SRT is about 1.2 Tesla, whereas magnetic fields of more than about 3 Tesla are required to induce SRT at 5 K as shown in the present work. Also the SRT with field at a given temperature is found to be broad as evident from dM/dH curves shown in Figure-2(b). One can understand these features in terms of the polycrystalline nature of the sample as is differently oriented relative to crystal axes of different small single crystalline particles in polycrystals. In the case of single crystal AFM, the is expected to be perfectly aligned with the easy anisotropy axis and hence resulting in a sharp SRT at a critical field approximately given by , where and are the exchange energy and anisotropy energy respectively. However, for polycrystalline samples one expects the angle () between the and the easy axis is evenly distributed between 0 and , there would be a distribution of resulting in a broad transition Pankhurst and Pollard. [1990], Pankhurst [1991]. Another consequence of polycrystalline nature is the different value of critical field for SRT as compared to single crystals. Morup suggested that critical field for the spin-flop transition () will be enhanced for antiferromagnetic microcrystals due to the presence of uncompensated moments Morup [1985]. Recently, Kumar et al., studied the spin-flop transition in polycrystalline AFM samples considering an isotropic distribution of values and concluded that the polycrystalline sample has a range of spin-flop transitions at cos = , which explains the higher values of required for spin-flop as compared to single crystal AFM samples Kumar et al. [2013].
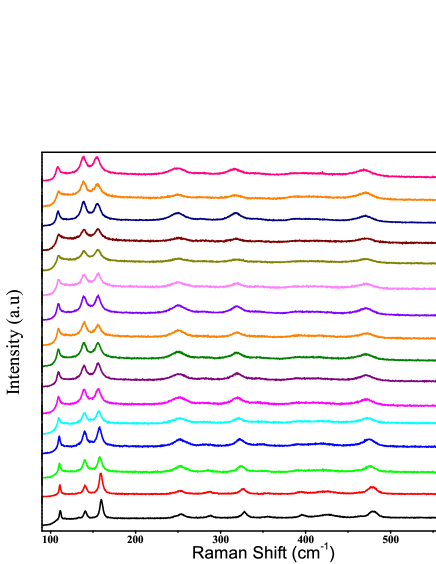
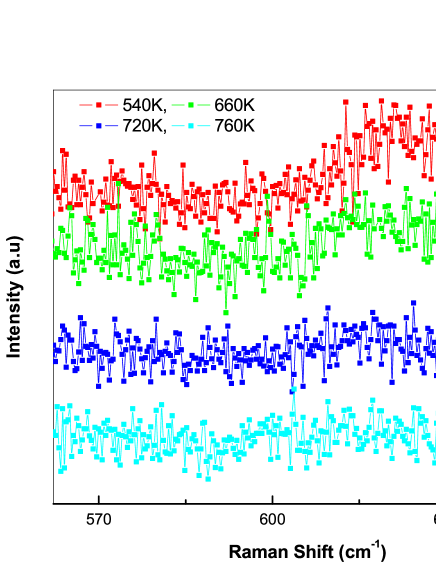
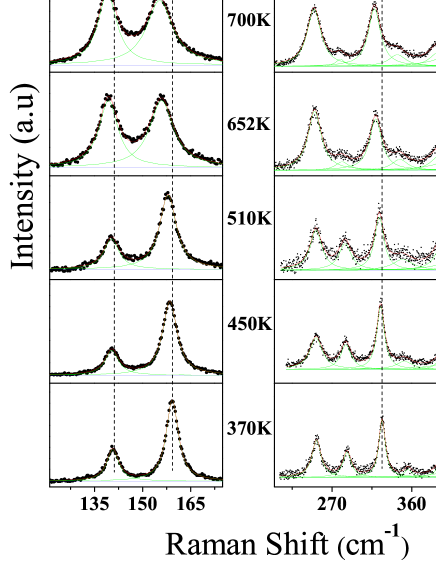
Further, in order to study the behavior of phonons across the antiferromagnetic to paramagnetic transition (i.e., ) temperature dependent (300 - 760 K) Raman measurements are carried out and the data is shown in Figure-7. With increasing temperature, almost all the modes are found to shift to lower wave-number side and becoming broad consistent with thermal expansion. It may appear that some of the modes with weak intensity are disappearing at higher temperatures, but essentially with increasing temperature the width is increasing and are merging with the background. For example as shown in Figure-8, the mode at 625 , which corresponds to in-phase stretching vibrational mode of , is found to exist even at highest temperature studied. Therefore, one can mention from Figure-7 that the overall Raman spectral signature is maintained across , which is consistent with the fact that the AFM to PM transition is not accompanied by any structural phase transition. compounds undergo a structural transformation of orthorhombic - rhombohedral -cubic at much higher temperatures as compared to Koehler et al. [1960], Selbach et al. [2012], Fossdal et al. [2004], Geller and Raccah [1970]. For example with of about 735 K undergoes the orthorhombic - rhombohedral transition at 1228 K and the rhombohedral -cubic transition is expected about 2140 K Selbach et al. [2012], Fossdal et al. [2004], Geller and Raccah [1970].
However, a closer inspection of the temperature dependent Raman spectra reveals interesting spectral changes as a function of temperature and especially in the vicinity of . The evolution of the Raman spectra with temperature in the region of interest is de-convoluted into different peaks as shown in Figure-9. From this fitting, the obtained position and width of the selected Raman modes is shown in Figure-10. It is observed that the magnitude of shift is different for different modes. For example, the mode at about 480 show large shifts (of the order of about 10 ) from above to room temperature as compared to other modes. The mode at about 140 show a shift of about only 3 . One can understand this by realizing that in compounds, it is reported that rare-earth atom vibrations play a dominant role in determining the phonon frequencies below 200 , the transition metal ions play dominant role above 350-400 and vibrations involving rare-earth and oxygen contribute in the intermediate region Bhadram et al. [2013], Udagawa et al. [1975]. With temperature change across , there can be either some volume change or contribution of spin energy to the magnetic ion () displacement resulting in large shifts Udagawa et al. [1975].
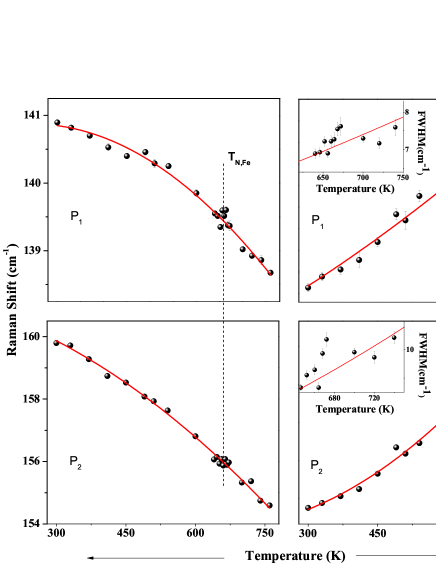

The behavior of the phonon position and phonon line-width with temperature follows the anharmonic model given by Balkanski Balkanski et al. [1983]. The equation (T) = A [1+ ] +B [1+ + ], where x=/2T, y=/3T, , A and B are fitting parameters, which takes into account of the four phonon process is considered for fitting the obtained temperature variation of mode position and width as shown in Figure-10. One can see that the data is fitted well by this model. However, for some of the modes anomaly in mode width and also subtle changes in mode position are observed across . As phonon life time (or lattice relaxation time) and line-width obey the uncertainty relation between time and energy so this anomaly near in the width of 140 can be regarded as spin-lattice coupling. Similarly anomaly near in the phonon position of 140 can be regarded as spin-phonon coupling. As mentioned above, modes at lower wave-number (140 ) corresponds to the movement of ions. Therefore, it is interesting to note that the correlation between the ions and the spin ordering exists even up to . This may throw some light on the controversy whether it is the rare-earth magnetic ordering (which takes place at temperatures below 5 K) or the weak ferromagnetic state of (which takes place below ) ions play important role in stabilizing the ferroelectric ordering in these type of compounds.
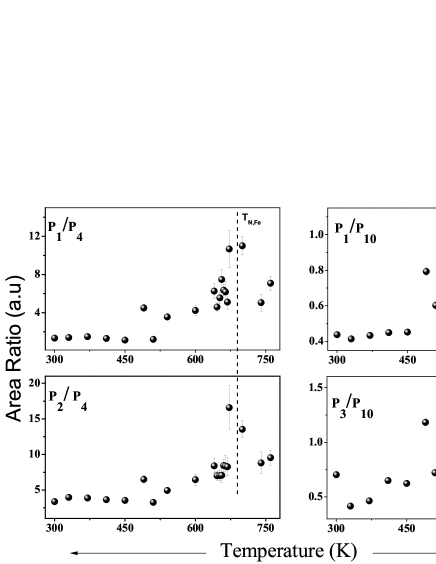
Another interesting observation from the temperature dependent Raman data is that, one can clearly see the systematic change in the intensity of modes and also the separation of modes with temperature (Figure-9). Figure-11 shows the the separation of modes at about 140, 160 (denoted as P1 and P2 in Figure-9) and at about 250, 459 (denoted as P3 and P10 in Figure-9) as a function of temperature. With increasing temperature, for both the cases the separation is found to decrease indicating the shrinking of the spectra. This is essentially due to the fact that some of the modes are shifting at a much faster rate with temperature as compared to the remaining indicating anisotropic nature of the force constants between the atoms. Also the area ratio of different modes as shown in Figure-12 exhibits an anomalous behavior close to . It is to be noted that the area of a Raman mode apart from its position and width is considered to be an effective parameter to study the vibrational dynamics in a given material. Therefore, the observed anomalous variation of area ratio of different Raman modes in the present work unambiguously indicate the presence of spin-lattice coupling in polycrystalline . In addition to this, as the observed Raman modes correspond to vibrational motion of the rare-earth and iron atoms in different directions, the observed anomalous variation close to highlight the role of magnetic ordering in inducing local structural re-arrangement which might be responsible for the observation of ferroelectric and hence multiferroic nature in these type of compounds. Recently Selbach et al., reported that there is an anisotropic thermal expansion of lattice parameters in even across and proposed that magneto-striction could be the reason Selbach et al. [2012]. Detailed temperature dependent x-ray diffraction and fine structure measurements might help in corroborating the present Raman observations of polycrystalline GdFO.
In conclusion, the Mssbauer spectra measured in the presence of external magnetic field show the signatures of field induced spin reorientation transition in polycrystalline , which are corroborated by magnetization measurements. From the temperature dependent variation of internal hyperfine field, Nel transition temperature () of 672.50.2 K and critical exponent () of 0.3330.003 is obtained. Temperature dependent (300 - 760 K) Raman spectroscopy measurements show the signatures of spin-phonon coupling and local structural re-arrangement across .
IV Acknowledgments
Thanks are due to Dr.M.Gupta and Mr.L.Behra for XRD; Dr.Alok Banerjee and Mr.Kranti Kumar for magnetization measurements .
References
- Prellie et al. [2005] W. Prellie, M. P. Singh, and P.Murugavel. J. Phys.: Condens. Matter, 17:R803, 2005.
- Cheong and Mostovoy [2007] S. W. Cheong and M. Mostovoy. Nature Mater., 6:13, 2007.
- Ramesh and Spaldin. [2007] R. Ramesh and N.A. Spaldin. Nature Mater., 6:21, 2007.
- Rao et al. [2012] C. N. R. Rao, A. Sundaresan, and Rana Saha. J. Phys. Chem. Lett., 3:2237, 2012.
- White. [1969] R. L. White. J. Appl. Phys., 40:1061, 1969.
- Treves. [1962] D. Treves. Phys. Rev., 125:1843, 1962.
- Zhou et al. [2014] Zhiqiang Zhou, Li Guo, Haixia Yang, Qiang Liu, and Feng Ye. Journal of Alloys and Compounds., 583:21, 2014.
- Tokunaga et al. [2009] Y. Tokunaga, N. Furukawa, H. Sakai, Y. Taguchi, Taka hisa Arima, and Y.Tokura. Nature Materials, 8:558, 2009.
- Durbin et al. [1977] G W Durbin, C E Johnson, and M F Thomas. J. Phys. C: Solid State Phys., 10:1975, 1977.
- Y.Tokunaga et al. [2008] Y.Tokunaga, S. Iguchi, T. Arima, and Y. Tokura. Phys. Rev. Lett, 101:097205, 2008.
- Rajeswaran et al. [2013] B. Rajeswaran, D. Sanyal, M. Chakrabarti, Y. Sundarayya, A. Sundaresan, and C. N. R. Rao. Europhys. Lett., 101:17001, 2013.
- Lee et al. [2011] Jung-Hoon Lee, Young Kyu Jeong, Jung Hwan Park, Min-Ae Oak, Hyun Myung Jang, Jong Yeog Son, and James F. Scott. Phys. Rev. Lett., 107:117201, 2011.
- Johnson et al. [2012] R. D. Johnson, N. Terada, and P. G. Radaelli. Phys. Rev. Lett., 108:219701, 2012.
- Kuo et al. [2014] C.-Y. Kuo, Y. Drees, M. T. Fernandez-Diaz, L. Zhao, L. Vasylechko, D. Sheptyakov, A. M. T. Bell, T.W. Pi, H.-J. Lin, M.-K. Wu, E. Pellegrin, S. M. Valvidares, Z.W. Li, P. Adler, A. Todorova, R. Küchler, A. Steppke, L. H. Tjeng, Z. Hu, and A. C. Komarek. Phys. Rev. Lett., 113:217203, 2014.
- N and C [1971] Greenwood N N and Gibb T C. Mossbauer Spectroscopy. London: Chapman and Hall, 1971.
- O.Nikolov et al. [1995] O.Nikolov, I. Hall, and K. W. Godfrey. J. Phys.: Condens. Matter, 7:4949, 1995.
- Chappert [1974] J. Chappert. J. Phys. Colloques, 35:C6–71, 1974.
- Pankhurst and Pollard. [1990] Q. A. Pankhurst and R. J. Pollard. J. Phys.: Condens. Matter, 2:7329, 1990.
- Pankhurst [1991] Q. A. Pankhurst. J. Phys.: Condens. Matter, 3:1323, 1991.
- Ferreira et al. [2009] W. S. Ferreira, J. Agostinho Moreira, A. Almeida, M. R. Chaves, J. P. Araújo, J. B. Oliveira, J. M. Machado Da Silva, M. A. Sá, T. M. Mendonca, P. Simeao Carvalho, J. Kreisel, J. L. Ribeiro, L. G. Vieira, P. B. Tavares, and S. Mendonça. Phys. Rev. B, 79:054303, 2009.
- P et al. [2011] Mandal P, Bhadram V. S, Sundarayya Y, Narayana C, Sundaresan A, and Rao C. N. R. Phys. Rev. Lett., 107:137202, 2011.
- Bhadram et al. [2013] V. S. Bhadram, B. Rajeswaran, A. Sundaresan, and C. Narayana. Europhysics Letters, 101:17008, 2013.
- J. [1993] Rodriguez-Carvajal J. Physica B, 192:55, 1993.
- Venugopalan et al. [1985] S. Venugopalan, M. Dutta, A. K. Ramdas, and J. P. Remeika. Phys. Rev. B., 31:1490, 1985.
- Gupta and Ashdhir [1999] H. C. Gupta and P. Ashdhir. Journal of Solid State Chemistry, 146:287, 1999.
- Du et al. [2010] Y. Du, Z. X. Cheng, X. L. Wang, and S. X. Dou. J.Appl. Phys., 107:09D908, 2010.
- Wiglusz et al. [2015] R. J. Wiglusz, K. Kordek, M. Matecka, A. Ciupa, M. Ptak, R. Pazik, P. Pohl, and D. Kaczorowski. Dalton Trans., 44:20067, 2015.
- Zysler et al. [2003] R. D. Zysler, D. Fiorani, A. M. Testa, L. Suber, E. Agostinelli, and M. Godinho. Phys. Rev. B., 68:212408, 2003.
- Eibschutz et al. [1967] M. Eibschutz, S. Shtrikman, and D. Treves. Phys. Rev., 156:562, 1967.
- Simopoulos et al. [1999] A. Simopoulos, M. Pissas, G. Kallias, E. Devlin, N. Moutis, I. Panagiotopoulos, D. Niarchos, C. Christides, and R. Sonntag. Phys. Rev. B., 59:1263, 1999.
- Blaauw and van der Woude [1973] C. Blaauw and F. van der Woude. J. Phys. C: Solid State Phys., 6:1422, 1973.
- Scott. [2011] J. F. Scott. J. Phys.: Condens. Matter., 23:022202, 2011.
- Poirier and Laliberte [2007] M. Poirier and F. Laliberte. Phys. Rev. B., 76:174426, 2007.
- Sharma et al. [2012] Kavita Sharma, V. Raghavendra Reddy, Ajay Gupta, S D Kaushik, and V Siruguri. J. Phys.: Condens. Matter., 24:376001, 2012.
- Morup [1985] S. Morup. Surf. Sci., 156:888, 1985.
- Kumar et al. [2013] M. Kumar, S. E. Dutton, R. J. Cava, and Z G Soos. J. Phys.: Condens. Matter, 25:136004, 2013.
- Koehler et al. [1960] W. C. Koehler, E. O. Wollan, and M. K. Wilkinson. Phys. Rev., 118:58, 1960.
- Selbach et al. [2012] S. M. Selbach, J. R. Tolchard, Anita Fossdal, and Tor Grande. J. Solid State Chem., 196:249, 2012.
- Fossdal et al. [2004] Anita Fossdal, Mohan Menon, Ivar Waernhus, Kjell Wiik, M. A. Einarsrud, and Tor Grande. J. Am. Ceram. Soc., 87:1952, 2004.
- Geller and Raccah [1970] S. Geller and P. M. Raccah. Phys. Rev. B., 2:1167, 1970.
- Udagawa et al. [1975] M. Udagawa, K. Kohn, N. Koshizuka, T. Tsushima, and K. Tsushima. Solid State Commun., 16:779, 1975.
- Balkanski et al. [1983] M. Balkanski, R.F. Wallis, and E. Haro. Phys. Rev. B., 28:1928, 1983.