Imaging the photoevaporating disk and radio jet of GM Aur
Abstract
Photoevaporation is probably the main agent for gas dispersal during the last stages of protoplanetary disk evolution. However, the overall mass loss rate in the photoevaporative wind and its driving mechanism are still not well understood. Here we report multi-configuration Very Large Array observations at 0.7, 3, and 5 cm towards the transitional disk of GM Aur. Our radio continuum observations allow us to image and spatially resolve, for the first time, the three main components at work in this stage of the disk evolution: the disk of dust, the ionized radio jet perpendicular to it, and the photoevaporative wind arising from the disk. The mass loss rate inferred from the flux density of the radio jet is consistent with the ratio between ejection and accretion rates found in younger objects, suggesting that transitional disks can power collimated ejections of material apparently following the same physical mechanisms as much younger protostars. Our results indicate that extreme-UV (EUV) radiation is the main ionizing mechanism of the photoevaporative wind traced by the free-free emission. The required low EUV photon luminosity of s-1 would produce a photoevaporation rate of only yr-1. Therefore, other mechanisms are required to disperse the disk in the timescale imposed by observations.
=20 \fullcollaborationName
1 Introduction
Photoevaporation, together with viscous accretion, is expected to play an important role in the dispersal of protoplanetary disks (Williams & Cieza, 2011; Alexander et al., 2014). High energy radiation – i.e. far-UV (FUV), extreme-UV (EUV), and X-ray radiation – originating at the stellar chromosphere of low-mass stars can ionize and heat the disk surface (Clarke et al., 2001; Gorti et al., 2009; Owen et al., 2010). Beyond a critical radius, the thermal energy of the heated surface becomes higher than its binding gravitational energy and the gas escapes in the form of a wind. While EUV photons produce a fully-ionized wind, X-rays can penetrate into deeper, neutral regions of the disk, creating a denser, partially-ionized photoevaporative wind (Gorti et al., 2009; Owen et al., 2011).
Although the early stages of disk evolution are dominated by viscous accretion, as the accretion rate decreases, central star-driven photoevaporation should eventually dominate over disk accretion, clearing the gas and leading the disk into the debris disk phase (Alexander et al., 2014). The timescale of gas removal and, thus, the impact of photoevaporation in the disk evolution, will strongly depend on the ionization rate reaching the disk and the mass loss rate produced by the photoevaporative winds.
So far, the primary diagnostic of disk photoevaporation has been optical and mid-IR forbidden line emission (e.g. [O I] Å and [Ne II] m) from the wind (Font et al., 2004). The redshifted side of the flow is blocked by the disk midplane, which is optically thick at these wavelengths. Therefore, the line profile is expected to be essentially narrow ( km s-1) and blueshifted by 5–7 km s-1 (Font et al., 2004), although high disk inclinations and optically thin regions in the disk (like gaps or cavities) can produce broader lines centered at the systemic velocity (Alexander, 2008). Blueshifted lines have been detected in a number of protoplanetary disks(Najita et al., 2009; Pascucci & Sterzik, 2009; Sacco et al., 2012). However, similar line profiles and luminosities can be obtained with different models (Alexander et al., 2014). Therefore, these lines cannot be used to constrain the high energy radiation responsible for the photoevaporative wind or to infer the mass loss rate in the flow (Ercolano & Owen, 2010).
Lugo et al. (2004), and more recently Avalos & Lizano (2012), proposed that free-free emission at cm wavelengths could be used as a diagnostic of disk photoevaporation in massive stars. Pascucci et al. (2012) and Owen et al. (2013) followed a similar approach focusing on central star-driven photoevaporation in low-mass stars, and proposed that cm observations could actually provide a better observational test than forbidden line observations. The free-free emission from the fully (EUV case) or partially (X-rays case) ionized disk surface is optically thin and, thus, directly proportional to the ionizing radiation reaching the disk. Since the X-ray luminosity of T Tauri stars can be directly measured, one can in principle estimate the free-free emission produced by the X-ray-ionized gas and, therefore, estimate the EUV photon luminosity impinging on the disk from the remaining observed emission. Following this idea, recent observational studies at cm wavelengths have focused on the free-free emission of protoplanetary disks in order to constrain photoevaporation models (Galván-Madrid et al., 2014; Pascucci et al., 2014). Due to their limited angular resolution, however, it is difficult to ascertain that these radio observations were not contaminated by free-free emission from an accretion-driven collimated jet. Since classical T Tauri stars present lower accretion rates than younger stellar objects, weak (or even absent) radio jet emission is expected in this type of sources. Nevertheless, thanks to the improved sensitivity of the Karl G. Jansky Very Large Array (VLA), Rodríguez et al. (2014) were recently able to resolve the emission at 3.3 cm of a relatively weak radio jet in AB Aur, a Herbig Ae star surrounded by a transitional disk.
GM Auriga is a well-known T Tauri star (140 pc, K5 spectral type, , ; Kenyon & Hartmann, 1995) surrounded by a transitional disk with a dust cavity of radius au (; Calvet et al., 2005; Hughes et al., 2009; Espaillat et al., 2010). [O I] and [Ne II] lines have been detected towards GM Aur, indicating the presence of high energy radiation reaching the disk. However, the [OI] spectrum has a very poor spectral resolution and the [NeII] spectrum shows no clear evidence of a blueshifted line peak that would confirm the presence of photoevaporation in GM Aur (Hartigan et al., 1995; Najita et al., 2009). This could indicate that the lines are tracing a bounded ionized layer of the disk (Najita et al., 2009). Alternatively, the lack of an observed blueshifted line peak could actually be due to the disk cavity, which could allow the redshifted component of the wind to be visible (Owen et al., 2013), or due to an insufficient signal-to-noise ratio in the [Ne II] spectrum. Therefore, even though observations indicate that high energy radiation is impinging on the disk surface, the presence of photoevaporation in GM Aur is still uncertain.
Here we report new sensitive high angular resolution VLA observations at 7 mm, 3 cm, and 5 cm towards the transitional disk of GM Aur, showing evidence of the presence of free-free emission from both photoevaporative winds and a radio jet.
2 Observations
Our new observations were carried out with the VLA of the National Radio Astronomy Observatory (NRAO)111The NRAO is a facility of the National Science Foundation operated under cooperative agreement by Associated Universities, Inc. using three different configurations (A, B, and C) at Q (7 mm), X (3 cm), and C (5 cm) bands. We also reduced VLA archival data at Ka, K, and C bands (see Table 1). For all the observations, 3C147 and J0438+3004 were used as the amplitude and complex gain calibrators, respectively. 3C84 was observed at Q band in order to calibrate the bandpass and delays. For the rest of the bands 3C147 was used as the bandpass calibrator. The expected uncertainty in the absolute flux calibration is .
| Project | Observing | Central | Bandwidth | On-source | ||
|---|---|---|---|---|---|---|
| Code | Date | Conf. | Band | Frequency | time | |
| (GHz) | (GHz) | (min) | ||||
| 15B-352 | 2015-Sep-28 | A | C | 6 | 4 | 39.6 |
| 2015-Sep-10 | 39.6 | |||||
| 15B-352 | 2015-Sep-26 | A | X | 10 | 4 | 38.6 |
| 2015-Sep-11 | 38.6 | |||||
| 14B-285 | 2015-May-09 | B | X | 10 | 4 | 41.8 |
| 14B-285 | 2014-Oct-16 | C | Q | 44 | 8 | 24.2 |
| 14B-285 | 2014-Oct-16 | C | X | 10 | 4 | 8.6 |
| AC982 | 2011-Jul-25 | A | C | 6 | 2 | 22.3 |
| BL175 | 2011-May-22 | BnA | C | 6 | 2 | 3.6 |
| BL175 | 2011-Apr-25 | B | C | 6 | 2 | 3.5 |
| 2011-Mar-06 | 3.6 | |||||
| AC982 | 2010-Nov-14 | C | Ka | 30.5, 37.5 | 22 | 94.5 |
| AC982 | 2010-Sep-13 | D | Ka | 32.7 | 2 | 3.0 |
| 2010-Sep-10 | 2.3 | |||||
| AC982 | 2010-Sep-11 | D | K | 21 | 2 | 24.0 |
| 2010-Aug-24 | 4.8 |
Note. — Observations from projects AC982 and BL175 were taken from the VLA archive.
Data calibration was performed using the VLA pipeline integrated in the data reduction package Common Astronomy Software Applications (CASA; version 4.3.1)222https://science.nrao.edu/facilities/vla/data-processing. After running the pipeline, we inspected the calibrated data, performed additional data flagging and re-ran the pipeline as many times as needed. Cleaned images were obtained with the CLEAN task of CASA by using the multi-scale multi-frequency deconvolution algorithm described in Rau & Cornwell (2011). In order to get a better frequency coverage we also split in frequency the observations at Q and X bands, obtaining images at 6.5 mm, 7.1 mm, 2.7 cm, and 3.3 cm.
3 Results
We have compiled the flux densities () of GM Aur at different (sub-)mm and cm wavelengths, both from our new data and from the literature (Table 3), and have constructed the spectral energy distribution (SED) shown in Fig. 1. As can be seen, the emission at cm wavelengths is above the expected contribution from the dust. The flat spectral index (, where ) between 5 and 2 cm cannot be explained with only dust emission, even assuming large (cm-sized) dust grains. By fitting the sum of two power laws to the SED from 0.89 mm to 5 cm, the emission can be explained as a combination of dust thermal () and free-free emission from ionized gas (). The positive spectral index of the spectrum between 5 and 3 cm, as well as the fact that the source at 3 cm appears to be extended, indicate that the contribution of possible non-thermal emission is negligible.
| Frequency | Wavelength | Fluxaa The uncertainties include the absolute flux calibration uncertainty. | |
|---|---|---|---|
| (GHz) | (mm) | (mJy) | Ref. |
| 480 | 0.623 | 1300300 | 2 |
| 390 | 0.769 | 850 90 | 2 |
| 375 | 0.800 | 730 70 | 1 |
| 350 | 0.856 | 640 70 | 6 |
| 337 | 0.89 | 550 70 | 7 |
| 230 | 1.3 | 170 17 | 3 |
| 230 | 1.3 | 180 30 | 6 |
| 230 | 1.3 | 173 19 | 7 |
| 141 | 2.13 | 37 4 | 5 |
| 110 | 2.72 | 21 3 | 6 |
| 108 | 2.77 | 19 3 | 4 |
| 46.0 | 6.52 | 1.42 0.18bb Previous measurements of the flux density at 7 mm, consistent within the uncertainties with our measurements, were obtained by Rodmann et al. (2006). We adopted the values obtained from our observations because they have a higher sensitivity. | 8 |
| 42.0 | 7.14 | 1.12 0.13bb Previous measurements of the flux density at 7 mm, consistent within the uncertainties with our measurements, were obtained by Rodmann et al. (2006). We adopted the values obtained from our observations because they have a higher sensitivity. | 8 |
| 37.5 | 8.0 | 0.80 0.09 | 8 |
| 32.7 | 9.17 | 0.66 0.13 | 8 |
| 30.5 | 9.8 | 0.48 0.06 | 8 |
| 21.0 | 14.3 | 0.25 0.05 | 8 |
| 11.0 | 27.25 | 0.098 0.014 | 8 |
| 9.0 | 33.3 | 0.069 0.011 | 8 |
| 6.0 | 50.0 | 0.040 0.009 | 8 |

The measured flux density at 7 mm, obtained using the full bandwidth of 8 GHz, is mJy, consistent with previous VLA observations (Rodmann et al., 2006). From our SED fit at cm wavelengths, we expect a free-free contribution at 7 mm of mJy, which represents only a of the emission at this wavelength. Thus, at 7 mm we are mainly detecting the dust emission. Our 7 mm map shows a resolved disk structure (Fig. 2a), although the angular resolution is not enough to reveal the inner cavity of radius au (Calvet et al., 2005; Hughes et al., 2009). From a Gaussian fit to the 7 mm image, we obtained a deconvolved disk size of au au (measured at the 3 level), with its major axis oriented in the NE-SW direction (PA), similar to previous studies at (sub-)mm wavelengths (Rodmann et al., 2006; Hughes et al., 2009).
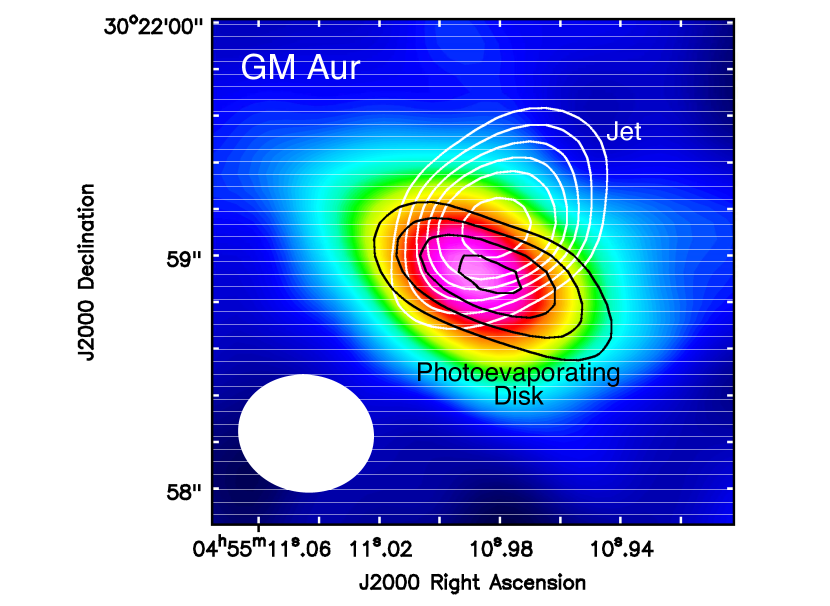
An image of the 3.0 cm emission is presented in Figure 2b. The emission shows a tripolar structure, suggesting a combination of dust emission from a disk and free-free emission from a monopolar (one-sided) radio jet perpendicular to it. This kind of morphology, with two perpendicular structures, has already been observed in other sources, such as HH 111 (Rodríguez et al., 2008) and HH 80-81 (Carrasco-González et al., 2012). In both cases, the emission was separated into two components by fitting two Gaussians to it. In the case of GM Aur, we estimate from the SED fit a dust contribution at 3.0 cm of Jy, which represents only of the detected emission at 3.0 cm. In order to check whether this flux density can account for the disk emission of GM Aur at 3.0 cm, we obtained an image of the estimated dust emission at 3.0 cm by scaling the 7 mm image with the dust spectral index obtained from the SED fit. We then subtracted this scaled image to the 3.0 cm image, which was previously convolved to have the same angular resolution as the 7 mm observations. The resulting image still showed significant emission from the disk. By fitting two Gaussians to the remaining 3.0 cm emission, we separated the source into a component with the same PA as the GM Aur disk (Jy), and another one perpendicular to it (Jy)333We note that none of the fit parameters were fixed and yet two perpendicular components were obtained. (Fig. 3). We interpret these two components to be tracing the free-free emission from a photoevaporating disk and a radio jet, respectively (see §4).
We also combined our new 5 cm observations with archival data (Table 1) to get a sensitive image (rmsJy; beam=, PA=). The image shows a compact source at the position of the star, although its size is sensitivity limited. Hence, we were not able to constrain the size of the source at this wavelength. The rest of the archival observations, at Ka and K bands, were obtained with relatively low angular resolution, so they showed an unresolved source at the position of GM Aur.
4 Discussion
The excess of free-free emission at cm wavelengths in GM Aur has been previously attributed, as well as in other transitional disks, to photoevaporative winds arising from the disk (Pascucci et al., 2012; Owen et al., 2013). Our 3.0 cm observations spatially resolve the emission, indicating the presence of two different components of free-free emission, one with the same PA as the GM Aur disk and another one perpendicular to it. The morphology of the disk component, as well as its flat spectral index between 5 and 2 cm, indeed suggests the presence of photoevaporative winds in GM Aur. However, our results indicate that a similar fraction of the free-free emission is arising from the perpendicular component, whose morphology, position and spectral index suggest that it is tracing an accretion-driven radio jet. In the following we discuss in more detail the nature of both free-free components.
4.1 Accretion-driven radio jet
As mentioned above, our 3.0 cm observations indicate the presence of a radio jet in GM Aur. A similar result was recently found in AB Aur (Rodríguez et al., 2014). Even though AB Aur is associated with a transitional disk, it has a relatively high mass accretion rate of yr-1 (Salyk et al., 2013). GM Aur, on the other hand, presents a much lower - yr-1 (Ingleby et al., 2015). Despite this difference of more than one order of magnitude, our high sensitivity observations have allowed us to detect a radio jet in GM Aur. Therefore, our results indicate that transitional disks, even those with very low mass accretion rates, may be associated with ionized jets.
From our two-Gaussian fit we estimated a flux density of Jy at 3.0 cm for the radio jet of GM Aur. Following a similar analysis to that of Rodríguez et al. (2014), we can test whether this jet follows the empirical correlation obtained by Anglada (1995) and Anglada et al. (2015) between the radio luminosity () at 3.6 cm and the bolometric luminosity (). Using for GM Aur as well as the free-free spectral index obtained in §3, the correlation predicts a flux density at 3.0 cm of Jy, which is a factor of higher than our measured value. A similar result was found by Rodríguez et al. (2014) in AB Aur, where the flux density obtained with the correlation was a factor higher than the measured value. The reason for this discrepancy is attributed to the fact that the correlation was obtained for younger sources (class 0 and I), where the bolometric luminosity is dominated by the accretion luminosity. On the contrary, in sources with transitional disks, which have much lower mass accretion rates, the luminosity is dominated by the stellar component. These results suggest that the previous correlation actually relates the accretion luminosity, traced by in very young objects, and the ejection of material, traced by the free-free emission of the radio jet.
The accretion and outflow rates can be compared applying the empirical correlation between the momentum rate of the outflow () and the radio luminosity (Anglada, 1995; Anglada et al., 2015):
| (1) |
Using our estimated flux density of Jy for the radio jet at 3.0 cm we obtain yr-1 km s-1. Assuming a jet terminal velocity of – km s-1 (Cabrit, 2007), we estimate a mass loss rate – yr-1 for the jet of GM Aur, one of the lowest mass loss rates ever obtained for a jet. Ingleby et al. (2015) measured a variable mass accretion rate in GM Aur of – yr-1 within a time span of months. Taking into account this variability in the accretion rate, as well as the observed dispersion in the empirical correlation derived by Anglada (1995) and Anglada et al. (2015), we conclude that our estimated mass loss rate for the jet of GM Aur is consistent with a ratio , typical of younger objects (Cabrit, 2007). A similar result was obtained by Rodríguez et al. (2014) for the transitional disk of AB Aur. Thus, our results indicate that, even though accretion decreases as a star evolves, the ratio between accretion rate and outflow rate in the jet remains similar, suggesting that a similar ejection mechanism persists during the whole process of star formation.
4.2 Photoevaporating Disk
Pascucci et al. (2012) studied the free-free emission at cm wavelengths produced by a photoevaporating disk assuming that the disk is heated by EUV or X-ray radiation. They obtained the following relations:
| (2) |
| (3) |
where is the flux density at 3.5 cm, is the EUV photon luminosity, and is the X-ray luminosity (Pascucci et al., 2012). Owen et al. (2013) extended this analysis with numerical calculations and obtained similar results. From equation (3), one can estimate the free-free emission produced by the X-ray-heated gas if the stellar X-ray luminosity () is known. The measured for GM Aur is erg s-1 (Güdel et al., 2010), which would produce a flux density of only Jy at 3.0 cm. This value is much lower than our estimated flux density of Jy at 3.0 cm for the free-free emission of the photoevaporating disk, which indicates that in GM Aur the photoionization of the gas cannot be only produced by X-rays, and should be mainly due to EUV radiation. Following equation (2), we obtain that a s-1 is required to account for the remaining Jy of the observed free-free emission from the photoevaporative wind in GM Aur.
Since EUV photons are highly absorbed by H, only indirect measurements of from T Tauri stars can be performed. Using forbidden line observations, EUV photon luminosities - s-1 have been inferred (Alexander et al., 2005; Espaillat et al., 2013). Recently, following Pascucci et al. (2012) prescriptions, Galván-Madrid et al. (2014) and Pascucci et al. (2014) estimated s-1 using radio observations of different transitional disks. Our estimated EUV photon luminosity for GM Aur is close to the lower limit of these latter measurements. However, none of the previous studies took into account the possible contribution of a radio jet. Our observations have allowed us to separate both components of the free-free emission, resulting in a lower but probably more accurate estimate of .
In particular, Owen et al. (2013) and Pascucci et al. (2014) estimated a higher value of s-1 for GM Aur based mostly on Arcminute Microkelvin Imager Large Array (AMI-LA) observations. Due to the low angular resolution of their observations (beam=), these authors were not able to separate the radio jet emission reported in this paper or the contribution of nearby sources that could fall within the large beam of AMI-LA from the free-free emission from the photoevaporative winds. Our 3.0 cm observations show, in fact, a nearby source ( away) with almost the same flux density as GM Aur that was not separated by the AMI-LA observations.
It is worth noting that the estimated from the observed photoionized gas actually represents the EUV radiation impinging on the disk, which could differ from the EUV radiation produced by the star. Hollenbach & Gorti (2009) showed that accretion flows and jets could significantly shield the disk from EUV and soft ( keV) X-ray radiation. According to their model, EUV and soft X-ray photons can completely cross a jet only if its mass loss rate is yr-1. In the case of GM Aur, our estimated - yr-1in the jet is above this value. This implies that the reaching the disk and, therefore, our estimated values, could be significantly lower than the produced by the star. As the accretion rate and, thus, the ejection rate of the jet decrease, the high-energy radiation impinging on the disk could increase, accelerating the photoevaporation of the disk. A larger sample of protoplanetary disks with a good determination of both and of the jet would be needed to test this scenario and its impact on the timescale of disk dispersal.
In any case, the low estimated from radio observations indicates that EUV radiation alone is probably not enough to disperse the disk in the timescale required by observations (Pascucci et al., 2014). Equation (4) in Alexander et al. (2014) can be used to estimate the mass loss rate in a fully-ionized photoevaporative wind launched purely by EUV radiation:
| (4) |
From this equation we obtain that the estimated for GM Aur would launch a photoevaporative wind with a mass loss rate of only yr-1. This value is much lower than the measured mass accretion rate of – yr-1 (Ingleby et al., 2015), suggesting that EUV photons are currently not able to release a significant amount of gas from the disk. Alternatively, X-rays can penetrate much deeper into the disk than EUV radiation and, thus, they can launch a denser, but only partially ionized, photoevaporative wind (Gorti et al., 2009; Owen et al., 2011). A quantitative estimate of the mass loss rate from X-ray photoevaporation () is still subject to significant uncertainties, since several input parameters and discrepancies between the models are not yet well understood (Alexander et al., 2014). Nonetheless, theoretical models predict mass loss rates between 1 and 2 orders of magnitude higher than those produced by EUV radiation for a star like GM Aur. Therefore, even though our results indicate that X-rays are not contributing significantly to the ionization of the photoevaporative wind, according to the models they could be responsible for most of the mass loss rate of the photoevaporating disk (Pascucci et al., 2014).
5 Summary and conclusions
We have analyzed the results of multi-configuration VLA observations at Q, Ka, K, X, and C bands towards the transitional disk of GM Aur, revealing the presence of dust thermal and free-free emission at cm wavelengths.
At 3 cm the emission presents an angularly resolved tripolar morphology that we separate into three components: the dust emission from the GM Aur disk, the free-free emission from a radio jet perpendicular to it, and the free-free emission from a photoevaporative wind arising from the disk. This is the first time that free-free emission from disk photoevaporation in a low mass star has been spatially resolved and separated from other components.
We conclude that extreme-UV (EUV) radiation is the main agent responsible for the ionization of the photoevaporative wind in GM Aur, although requiring a low photon luminosity of s-1. This low EUV photon luminosity produces a mass loss rate of only yr-1. Therefore, other mechanisms, such as X-ray photoevaporation, are required to disperse the disk in the timescale imposed by observations.
On the other hand, we estimate a mass loss rate in the radio jet in GM Aur of - yr-1, which represents one of the lowest mass ejection rates in a jet estimated so far. Nevertheless, the ratio , typical of younger protostars, seems to be valid as well for GM Aur. Therefore, our results suggest that disks with very low mass accretion rates still present collimated ejections of material, apparently following the same physical mechanisms as much younger protostars
At least in GM Aur, the cm free-free emission of the jet and the photoevaporative wind seem to be of the same order. Future radio observations aiming to study photoevaporation in the last stages of disk evolution should be cautious and try to disentangle the contribution to the observed radio emission of the dust, the jet, and the photoevaporative winds.
References
- Alexander (2008) Alexander, R. 2008, MNRAS, 391, L64
- Alexander et al. (2005) Alexander, R. D., Clarke, C. J., & Pringle, J. E. 2005, MNRAS, 358, 283
- Alexander et al. (2014) Alexander, R., Pascucci, I., Andrews, S., Armitage, P., & Cieza, L. 2014, in Protostars and Planets VI, ed. H. Beuther et al. (Tucson, AZ: Univ. Arizona Press), 475
- Andrews et al. (2013) Andrews, S. M., Rosenfeld, K. A., Kraus, A. L, Wilner, D. J. 2013, ApJ, 771, 129
- Anglada (1995) Anglada, G. 1995, RMxAC, 1, 67
- Anglada et al. (2015) Anglada, G., Rodríguez, L. F., & Carrasco-González, C. 2015, in Advancing Astrophysics with the Square Kilometre Array (AASKA14), 121
- Avalos & Lizano (2012) Avalos, M., Lizano, S. 2012, ApJ, 751, 63
- Beckwith & Sargent (1991) Beckwith, S. V. W., Sargent, A. I. 1991, ApJ, 381, 250
- Cabrit (2007) Cabrit, S. 2007, in IAU Symp. 243, Star-Disk Interaction in Young Stars, ed. J. Bouvier & I. Appenzeller (Cambridge: Cambridge Univ. Press), 203
- Calvet et al. (2005) Calvet, N., D’Alessio, P., Watson, D. M., et al. 2005, ApJ, 630, L185
- Carrasco-González et al. (2012) Carrasco-González, C., Galván-Madrid, R., Anglada, G., et al. 2012, ApJ, 752, L29
- Clarke et al. (2001) Clarke, C. J., Gendrin, A., & Sotomayor, M. 2001, MNRAS, 328, 485
- Dutrey et al. (1998) Dutrey, A., Guilloteau, S., Prato, L., et al. 1998, A&A, 338, L63
- Ercolano & Owen (2010) Ercolano, B., Owen, J. E. 2010, MNRAS, 406, 1553
- Espaillat et al. (2010) Espaillat, C., D’Alessio, P., Hernández, J., et al. 2010, 717, 441
- Espaillat et al. (2013) Espaillat, C., Ingleby, L., Furlan, E., et al. 2013, ApJ, 762, 62
- Font et al. (2004) Font, A., McCarthy, I., Johnstone, D., Ballantyne, D. R. 2004, ApJ, 607, 890
- Galván-Madrid et al. (2014) Galván-Madrid, R., Liu, H. B., Manara, C. F. 2014, A&A, 570, L9
- Gorti et al. (2009) Gorti, U., Dullemond, C. P., & Hollenbach, D. 2009, ApJ, 705, 1237
- Gorti & Hollenbach (2009) Gorti, U., & Hollenbach, D. 2009, ApJ, 690, 1539
- Güdel et al. (2010) Güdel, M., Lahuis, F., Briggs, K. R., Carr, J., et al. 2010, A&A, 519, 113
- Hartigan et al. (1995) Hartigan, P., Edwards, S., & Ghandour, L. 1995, ApJ, 452, 736
- Hollenbach & Gorti (2009) Hollenbach, D., Gorti, U. 2009. ApJ, 703, 1203
- Hughes et al. (2009) Hughes, A. M., Andrews, S. M., Espaillat, C., et al. 2009, ApJ, 698, 131
- Ingleby et al. (2015) Ingleby, L., Espaillat, C., Calvet, N., et al. 2015, ApJ, 805, 149
- Kenyon & Hartmann (1995) Kenyon, S. J., Hartmann, L. 1995, ApJS, 101, 117
- Kitamura et al. (2002) Kitamura, Y., Momose, M., Yokogawa, S., et al. 2002, ApJ, 581, 357
- Looney et al. (2000) Looney, L. W., Mundy, G., & Welch, W. J. 2000, ApJ, 529, 477
- Lugo et al. (2004) Lugo, J., Lizano, S., & Garay, G. 2004, ApJ, 614, 807
- Najita et al. (2009) Najita, J. R., Doppmann, G. W., Bitner, M. A., Richter, M. J., et al. 2009, ApJ, 697, 957
- Owen et al. (2011) Owen, J. E., Ercolano, B., Clarke, C. J. 2011, MNRAS, 412, 13
- Owen et al. (2010) Owen, J. E., Ercolano, B., Clarke, C. J., & Alexander, R. D. 2010, MNRAS, 401, 1415
- Owen et al. (2013) Owen, J. E., Scaife, A. M. M., Ercolano, B. 2013, MNRAS, 434, 3378
- Pascucci et al. (2012) Pascucci, I., Gorti, U., & Hollenbach, D. 2012 ApJ, 751, L42
- Pascucci et al. (2014) Pascucci, I., Ricci, L., Gorti, U., et al. 2014 ApJ, 795, 1
- Pascucci & Sterzik (2009) Pascucci, I., & Sterzik, M. 2009 ApJ, 702, 724
- Rau & Cornwell (2011) Rau, U., Cornwell, T. J. 2011, A&A, 532, 71
- Rodmann et al. (2006) Rodmann, J., Henning, T., Chandler, C. J., et al. 2006, A&A, 446, 211
- Rodríguez et al. (2008) Rodríguez, L. F., Torrelles, J. M., Anglada, G., Reipurth, B. 2014, AJ, 136, 1852
- Rodríguez et al. (2014) Rodríguez, L. F., Zapata, L. A., Dzib, S. A., et al. 2014, ApJL, 793, L21
- Sacco et al. (2012) Sacco, G. G., Flaccomio, E., Pascucci, I., et al. 2012, ApJ, 747, 142
- Salyk et al. (2013) Salyk, C., Herczeg, G. J., Brown, J. M., et al. 2013, ApJ, 769, 21
- Weintraub et al. (1989) Weintraub, D. A., Sandell, G., Duncan, W. D. 1989, ApJ, 340, L69
- Williams & Cieza (2011) Williams, J. P., Cieza, L. A. 2011, A&A, 49, 67