ALMA Observations of the Debris Disk of Solar Analogue Ceti
Abstract
We present 1.3 mm observations of the Sun-like star Ceti with the Atacama Large Millimeter/submillimeter Array (ALMA) that probe angular scales of (4 AU). This first interferometric image of the Ceti system, which hosts both a debris disk and possible multiplanet system, shows emission from a nearly face-on belt of cold dust with a position angle of surrounding an unresolved central source at the stellar position. To characterize this emission structure, we fit parametric models to the millimeter visibilities. The resulting best-fit model yields an inner belt edge of AU, consistent with inferences from lower resolution, far-infrared Herschel observations. While the limited data at sufficiently short baselines preclude us from placing stronger constraints on the belt properties and its relation to the proposed five planet system, the observations do provide a strong lower limit on the fractional width of the belt, with confidence. This fractional width is more similar to broad disks such as HD 107146 than narrow belts such as the Kuiper Belt and Fomalhaut. The unresolved central source has a higher flux density than the predicted flux of the stellar photosphere at 1.3 mm. Given previous measurements of an excess by a factor of at 8.7 mm, this emission is likely due to a hot stellar chromosphere.
1 Introduction
The 5.8 Gyr-old (Mamajek & Hillenbrand, 2008) main-sequence G8.5V star Ceti is the second closest (3.65 pc, van Leeuwen, 2007) Solar-type star reported to harbor both a tentative planetary system and a debris disk (after Eridani, e.g. Greaves et al., 1998; Hatzes et al., 2000). The Ceti debris disk was first identified as an infrared excess by IRAS (Aumann, 1985) and confirmed by ISO (Habing et al., 2001). Greaves et al. (2004) marginally resolved 850 m emission from the system with the James Clerk Maxwell Telescope (JCMT)/SCUBA, revealing a massive (1.2 ) disk extending to 55 AU from the star. Recent Herschel observations at 70, 160, and 250 m resolve the disk well and are best fit by a broad dust belt with an inner edge between AU and an outer edge at AU (Lawler et al., 2014). Due to its proximity and similarity to our Sun in age and spectral type, Ceti has been the object of numerous searches for planets using the radial velocity technique (e.g. Pepe et al., 2011), most of which have proved unsuccessful. Using extensive modeling and Bayesian analysis of radial velocity data from the High Accuracy Radial Velocity Planet Searcher (HARPS) spectrograph (Mayor et al., 2003; Pepe et al., 2011), the Anglo-Australian Planet Search (AAPS) on the Anglo Australian Telescope (AAT), and the High Resolution Echelle Spectrograph (HIRES) on the Keck telescope (Vogt et al., 1994), Tuomi et al. (2013) report evidence for a tightly-packed five planet system. This purported planetary system consists of five super-Earths with masses of (for orbits co-planar with the disk), semi-major axes ranging over AU, and small eccentricities, . The veracity of these planet candidates, however, remains controversial. Tuomi et al. (2013) acknowledge that the detected signals could also result from a combination of instrumental bias and stellar activity, although no further evidence is given to support these alternative interpretations. Also of note is the sub-Solar metallicity of Ceti, [Fe/H] dex (Pavlenko et al., 2012), which makes it an interesting target for exoplanet searches due to the observed higher frequency of low-mass planets around low-metallicity stars (Jenkins et al., 2013).
We present interferometric observations of the Ceti system at 1.3 mm using the Atacama Large Millimeter/submillimeter Array (ALMA). Millimeter imaging of this debris disk opens a unique window on the location and morphology of the underlying population of dust-producing planetesimals orbiting the star. While these large, kilometer-sized bodies cannot be detected directly, millimeter observations probe emission from the large dust grains produced through collisions that are not rapidly redistributed by stellar radiation and winds (Wyatt, 2006). These new ALMA observations provide limits on the disk location and width, which bear on the proposed planetary system within the disk. In Section 2, we present the ALMA observations of the Ceti system. In Section 3, we describe the analysis technique and disk model results. In Section 4, we discuss the significance of the best-fit model parameters for the dust belt inner edge, width, proposed planetary system, and the origin of a bright, unresolved central emission source.
2 Observations
The Ceti system was observed using Band 6 (1.3 mm) in December 2014 with the ALMA 12-m array. We obtained one scheduling block (SB) in good weather (PWV = 1.76 mm) with 34 antennas, with the longest baselines sampling to ( AU) resolution. These observations were complemented by two SBs taken with the Atacama Compact Array (ACA) in July 2014 to provide shorter baselines and sensitivity to emission at larger scales. For these ACA SBs, 11 operational antennas were available. The observation dates, baseline lengths, and total time on-source are summarized in Table 1. For maximum continuum sensitivity, the correlator was configured to process two polarizations in four 2 GHz-wide basebands centered at 226, 228, 242, and 244 GHz, each with 256 spectral channels. For the July SBs, the phase center was , (J2000, ICRS reference frame). The phase center for the December SB was , (J2000, ICRS reference frame). Both phase centers were chosen to be the position of Ceti at the time of the observations given its proper motion of (, ) mas yr-1 (van Leeuwen, 2007). The field of view is , given by the FWHM size of the primary beam the ALMA 12-m antennas at the mean frequency of 234 GHz.
The data from all three SBs were calibrated separately using the CASA software package (version 4.2.2). We corrected for time-dependent complex gain variations using interleaved observations of the calibrator J0132-1654. Observations of J0137-2430 were used to determine the spectral response of the system. The absolute flux calibration scale was derived from observations of Neptune, and a mean calibration was applied to all four basebands, with a systematic uncertainty of (see Butler, 2012, for a complete discussion of flux density models of Solar System bodies).
To generate a first image at the mean frequency, 234 GHz (1.3 mm), we Fourier inverted the calibrated visibilities with natural weighting and a multi-frequency synthesis with the CLEAN algorithm. To improve surface brightness sensitivity, we included a modest taper using the uvtaper parameter in CLEAN, which controls the radial weighting of visibilities in the -plane through the multiplication of the visibilities by the Fourier transform of a circular Gaussian (on-sky FWHM ). With the added taper, however, it became difficult to resolve the outer disk and the central stellar emission. For clarity, we chose to image the disk and the star separately. We isolate the disk emission by subtracting a point source model from these data using the CASA task uvsub to account for the stellar emission. To isolate the stellar component, we image with CLEAN and no taper, only including baselines longer than 40 k, where we expect the star to dominate the emission (see Section 3). We choose to account for the primary beam in our modeling (see Section 3.2) and thus do not apply a primary beam correction to any of these images.
3 Results and Analysis
3.1 Continuum Emission
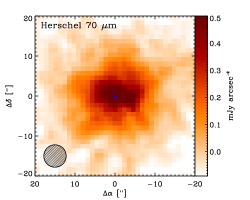
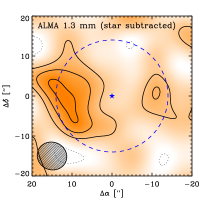
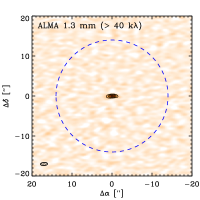
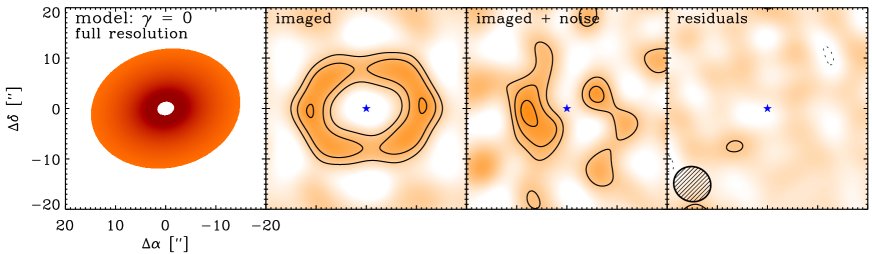
Figure 1 shows an ALMA 1.3 mm image of the Ceti disk made with the central star subtracted (middle panel) along with an image including only baselines longer than 40 k showing emission from the star and not the disk (right panel). The Herschel/PACS 70 m star-subtracted image (left panel) is shown for reference (Lawler et al., 2014). The natural weight rms noise is 30 Jy and 180 Jy for the 12-m and ACA observations, respectively. For the image showing only the stellar emission, the natural weight rms is higher, 35 Jy, since we exclude some baselines. The belt is not detected in the ACA observations given the low signal-to-noise ratio, and we only consider the 12-m data for imaging and modeling (see Section 3.2). For the 1.3 mm image of the star, the synthesized beam with natural weighting is ( AU), and position angle . To improve surface brightness sensitivity, the image of the disk makes use of a modest taper and has a synthesized beam size of ( AU), and position angle .
These 1.3 mm images reveal (1) patchy emission () from a nearly face-on (low inclination) dust disk, and (2) a bright (), unresolved central peak coincident with the expected stellar position. The disk is located ( AU) from the star with a position angle of (E of N). Reid et al. (1988) quantify the position uncertainty, of a point source given the signal-to-noise ratio, , and the synthesized beam size, : , for our observations. The position of the observed central source is coincident with the expected stellar position within this uncertainty.
3.2 Emission Modeling Procedure
We make use of the modeling scheme described in MacGregor et al. (2013, 2015). In this approach, we construct parametric models of the 1.3 mm disk emission and then compute corresponding model visibilities using a python implementation111The code used to perform this part of the analysis is open source and freely available at https:github.comAstroChemvis_sample. of the Miriad uvmodel task (Loomis et al. in prep). To determine the best-fit parameter values and their uncertainties, we employ the emcee Markov Chain Monte Carlo (MCMC) package (Foreman-Mackey et al., 2013). This affine-invariant ensemble sampler for MCMC, enables us to accurately sample the posterior probability functions of all model parameters with minimal fine-tuning. Due to the much higher rms noise of the ACA data, we choose to only fit models to the visibilities from the full 12-m ALMA array.
We model the millimeter emission of the Ceti debris disk as an axisymmetric, geometrically thin belt with an inner radius, , an outer radius, , and a radial surface brightness distribution described by a simple power law, . Here, describes the power law in radial surface density, , and temperature is assumed to follow a power law, , approximating radiative equilibrium for blackbody grains. To first order, the dust temperature also depends on the grain opacity, , where is the power law index of the grain opacity as a function of frequency, . Gáspár et al. (2012) measure , from observations of debris disks, which implies a temperature power law index of . Thus, the expected change in the temperature profile due to is much smaller than the uncertainty in our resulting model fits and we choose to ignore this effect. Furthermore, the surface density and temperature profiles are degenerate, so we assume a blackbody profile and fit only for .
We constrain the outer disk radius using previous JCMT/SCUBA observations (Greaves et al., 2004), since the parent body disk may have a different size relative to the smaller grains imaged with Herschel. While Greaves et al. (2004) suggested that the disk was highly inclined, the Herschel image (Figure 1, left panel) indicates that it is closer to face-on. The SCUBA image is therefore marginally resolved at best, so we take their derived disk radius of 55 AU as an upper limit on and allow the inner radius, , to vary. We fit for the surface density radial power law index, , within a range of to . The unresolved central peak seen in images is modeled by a central point source with flux, . We do not fit for any relative offsets of the belt center, point source position, and phase center. Models of the Herschel images derive an inclination of and position angle, (Lawler et al., 2014), and we assume that the millimeter belt emission is described by the same geometry. For all parameters, we assume uniform priors and require that the model be physically plausible: , and AU.
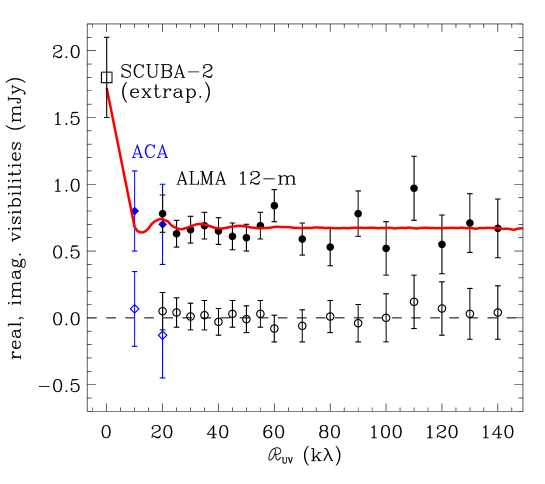
A total flux density, , provides the normalization for the belt emission. Using SCUBA on the JCMT, Greaves et al. (2004) obtain a total flux density at 850 m for the disk of mJy, including both the central star and likely contamination from background sources. Recent SCUBA-2 observations at 850 m yield a total flux density of mJy, including a contribution from the star of mJy (Holland et al., in prep.). An extrapolation of this measurement using the typical spectral index of 2.58 for debris disks at (sub)millimeter wavelengths (Gáspár et al., 2012), yields an expected flux density of the disk at 1.3 mm of mJy. This more robust single-dish flux measurement allows us to constrain the total flux density of our models with a Gaussian prior, , accounting for uncertainty in both the single-dish 850 m flux measurement and the extrapolation to 1.3 mm.
The angular scale of the Ceti debris disk is in diameter. At 1.3 mm, the half power field of view of the 12-m ALMA antennas is comparable, FWHM. Given this, we must account for the effect of the primary beam response on our model parameters. To do this, we model the ALMA primary beam as a Gaussian normalized to unity at the beam center and multiply each parametric disk model by this Gaussian beam model. Since we account for the effect of the primary beam in our modeling scheme, we choose not to apply a primary beam correction to the images shown in Figure 1 (right panels).
3.3 Results of Model Fits
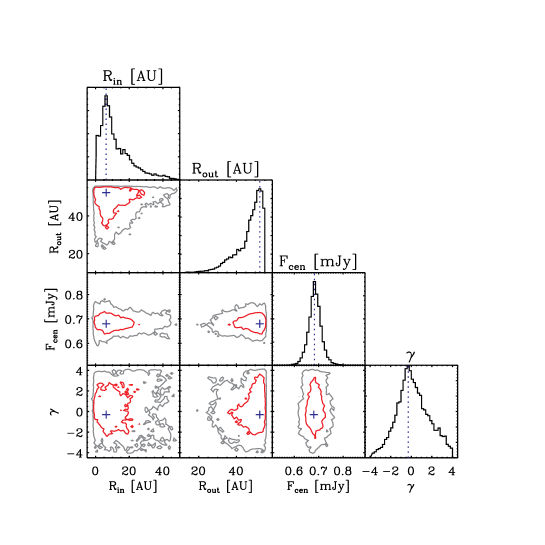
Modeling the ALMA 1.3 mm visibilities yields a final best-fit model with a reduced value of 1.1. Table 2 lists the best-fit values for each of the 5 free parameters along with their corresponding () uncertainties. The 1D (diagonal panels) and 2D (off-diagonal panels) projections of the posterior probability distributions for all parameters except the total belt flux, , are shown in Figure 2. A full resolution image of this best-fit model (with a flat surface density profile, , and the central star excluded) is shown in the leftmost panel of Figure 3. The same model convolved with the ALMA synthesized beam and imaged like the observations in Figure 1 is shown in the next two panels both without (left) and with (right) simulated random noise with an rms of 30 Jy. Including the simulated noise results in a patchy image with emission structure similar to the ALMA 1.3 mm image shown in Figure 1. In both the ALMA and model images, the most significant peaks of emission are consistent with the expectation for a slightly inclined disk with PA near . The rightmost panel of Figure 3 shows the residuals resulting from subtracting this best-fit model from the observed visibilities, again imaged with the same parameters. No significant features are evident.
The best-fit total belt flux density is mJy, constrained by the Gaussian prior taken from previous single dish flux measurements. Lawler et al. (2014) note that the SCUBA and SCUBA-2 flux densities are higher than expected given an extrapolation from the Herschel flux density measurements. This difference suggests that these earlier observations could be contaminated by the extragalactic background or that the disk could have an additional warm component. Given the limits in sensitivity of our ALMA data, the total flux density we measure is consistent with both the Herschel and SCUBA/SCUBA-2 values and we cannot distinguish between these two scenarios.
Not surprisingly, given the sensitivity limits of the ALMA data, model fitting does not provide a strong constraint on the power law index of the surface density radial profile, . With large uncertainty, this result implies a shallow surface density profile. In addition, we see a clear degeneracy between the surface density gradient, , and the disk outer radius, (e.g. Mundy et al., 1996). For very negative values of , the outer regions of the resulting belt model have low surface brightness, making it difficult to constrain the position of the outer edge. Thus, the contours shown in Figure 2 for that pair of parameters exhibit a slope, spreading out to span a wide range of possible outer radii for increasingly negative values of .
Another helpful way to visualize and compare the ALMA observations and the best-fit model is by deprojecting the real and imaginary visibilities based on the inclination, , and position angles, , of the disk major axis, as is shown in Figure 4 (see Lay et al., 1997, for a detailed description of deprojection). Essentially, the coordinates for each visibility point are defined by a distance from the origin of the plane, . To change to a deprojected, rotated coordinate system, we define an angle , where is the position angle of the disk measured east of north. The new coordinates are defined as and , where is the inclination angle of the disk. Then, the new deprojected distance is . Assuming that the disk is axisymmetric, we average the visibilities azimuthally in annuli of . For our ALMA Ceti observations, the real part of the deprojected visibilities is reasonably consistent with the prediction for a broad belt of emission, showing a central peak and several oscillations of decreasing amplitude. The constant offset from zero is the visibility signature of the unresolved central peak we see clearly in the images. The imaginary visibilities are essentially zero, indicating that there is no asymmetric structure in the disk, which is consistent with the absence of any significant residuals in Figure 3 (rightmost panel). Note that we are lacking coverage on baselines shorter than k, the region of the visibility curve with the most structure.
4 Discussion
We have obtained ALMA 1.3 mm observations of the Ceti system using both the ACA and the full 12-m array with baselines corresponding to scales of ( AU). The resulting image shows emission from an outer dust disk located ( AU) from the star surrounding an unresolved central peak. We fit parametric models to the millimeter visibilities, which included two components: (1) an outer disk with a radial surface density profile described by a power law with index , and (2) a point source at the stellar position. In the context of our simple model, this analysis provides tentative constraints on the location of the disk inner edge and the width of the disk. We now compare the model fits to previous Herschel observations and discuss implications for the geometry of the proposed inner planetary system located within the dust belt.
4.1 Location of the Disk Inner Edge and Belt Width
Our best-fit model yields an inner radius for the disk of AU, consistent with the analysis of Herschel observations that constrained the inner edge of the disk to be between 1 and 10 AU from the star (Lawler et al., 2014). For comparison, the planetary system proposed by Tuomi et al. (2013) consists of five super-Earths in a tightly-packed configuration with semi-major axes ranging over AU. Given the uncertainties on from our best-fit model, the disk could extend well into this inner planetary system ( AU) or end far beyond the outermost planet ( AU). None of the proposed planets have large enough orbital radius or mass to cause significant perturbations or clear the disk beyond 3 AU (within the range of allowed by our models). Lawler et al. (2014) use numerical simulations to show that the system would be stable with an additional Neptune-mass planet on an orbit of AU, the largest mass planet at such separations that cannot be ruled out by the radial velocity data.
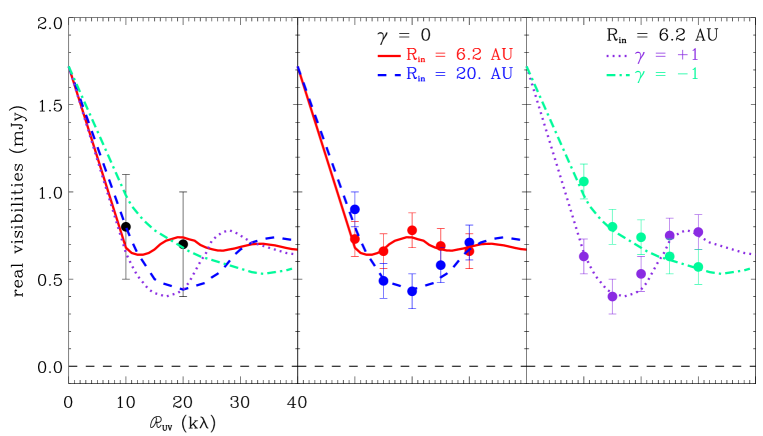
The belt position and width are strongly constrained by the location of the first null in the deprojected real visibilities (see Figure 4, MacGregor et al., 2015). Although we obtained some ACA data, the integration time was short, and the resulting sensitivity (rms Jy) at short baselines ( k) was insufficient to discriminate between disk models with inner radii of AU, the parameter space with significant implications for the proposed planetary system. New observations with shorter baselines are needed to better determine the location of the dust belt, as well as its radial surface density gradient. To demonstrate the contribution that such observations would make to our analysis, we carried out simulations of ALMA ACA observations (rms 60 Jy, using 10 antennas in the Cycle 4 setup) at 1.3 mm for a model with our best-fit AU and , and a model with AU and , all consistent with the ALMA observations presented here. Figure 5 (left panel) shows the real component of the expected complex visibilities for all four models, along with our current ACA observations. The center and right panels show the real part of simulated ACA visibilities for all four belt models compared to the expected theoretical visibility curves. These profiles are clearly different in shape, with the zero-crossing locations shifted by k and the amplitude of the oscillations differing by more than a factor of 2.
Although the ALMA observations allow for broad disk models that extend in toward the central star, they are not consistent with a narrow ring model located far from the star. The contours for the inner and outer radius in Figure 2 show the absence of any models with large and small , indicating that the disk must be broad. Indeed, we can place a strong upper limit, AU with () confidence. Given the values of and from our best-fit model, the fractional width of the Ceti disk is . If we assume that the outer belt edge at millimeter wavelengths aligns with the edge found at far-infrared wavelengths ( AU), we can place a lower limit on the belt width, AU. At confidence, . For comparison, our Solar System’s classical Kuiper Belt has a fractional width of (e.g. Hahn & Malhotra, 2005; Bannister et al., 2015), significantly more narrow. In fact, the Kuiper Belt appears to be confined between Neptune’s 3:2 and 2:1 resonances. Similarly, the Fomalhaut debris disk appears narrow with , possibly attributable to planets orbiting both interior to and exterior to the ring (Boley et al., 2012). In contrast, recent ALMA observations of the HD 107146 debris disk (Ricci et al., 2015) indicate that its belt extends from 30 AU to 150 AU (), with a break at AU. The Eridani debris disk also appears to be somewhat broader with a fractional width determined from resolved SMA observations of (MacGregor et al., 2015). The fractional width of the Ceti belt is substantially larger than both the classical Kuiper Belt and Fomalhaut. However, the Ceti belt is comparable in width to the HD 107146 disk, suggesting that it might also have a more complicated radial structure, which we are unable to resolve with these observations.
Kalas et al. (2006) discuss the implications of the observed diversity in debris disk structures in the context of scattered light observations. For a narrow belt structure, both the inner and outer edges of the disk must be maintained by gravitational perturbers such as stellar or substellar companions, or be confined by mean-motion resonances with an interior planet as is the case for our own Kuiper Belt. Without any such confinement mechanism for the outer disk edge, and since more massive planets have been ruled out around Ceti at distances approaching AU (Lawler et al., 2014), the expected structure is indeed a wide belt.
4.2 Central Component
In addition to the extended emission from an outer belt, the ALMA 1.3 mm image shows a bright, unresolved point source (see the constant positive offset on long baselines in Figure 4) at the expected position of the star with a flux density of mJy. For a G8.5V star with an effective temperature of K, an extrapolation of a PHOENIX stellar atmosphere model (Husser et al., 2013) predicts a 1.3 mm flux density of 0.60 mJy (with 5% uncertainty). Thus, the flux density of this central source is marginally higher than the expectation for the stellar photosphere at this millimeter wavelength. We note, however, that an extrapolation of the mid-infrared flux of the star, as measured by WISE at 22 m (Wright et al., 2010) and AKARI at 9 and 18 m (Ishihara et al., 2010), yields a prediction for the flux of the stellar photosphere at 1.3 mm of mJy, substantially lower than the measured 1.3 mm flux density. Our ALMA measurement is complemented by previous observations by Villadsen et al. (2014) with the Karl G. Jansky Very Large Array (VLA) at 34.5 GHz (8.7 mm) and 15.0 GHz (2.0 cm). At 8.7 mm, the measured flux density is Jy, significantly higher than the predicted photospheric flux density of 14 Jy. While the star is not detected at 2.0 cm, a robust 99% confidence upper limit is determined of Jy (model photospheric prediction of 2.5 Jy).
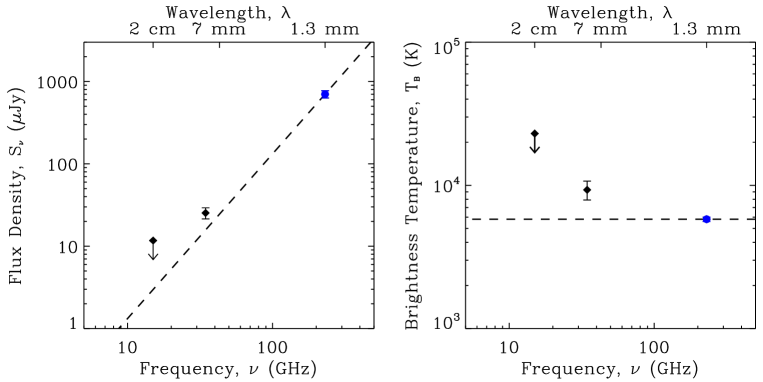
As Villadsen et al. (2014) discuss, the observed unresolved emission from Ceti at both millimeter and centimeter wavelengths plausibly arises from a hot stellar chromosphere. Similar excess emission at long wavelengths has been noted for several neighboring Sun-like stars, including Cen A and B (spectral types G2V and K2V, respectively) observed with ALMA by Liseau et al. (2015) and Eridani (spectral type K2V) observed with the Submillimeter Array (SMA) and Australia Telescope Compact Array (ATCA) by MacGregor et al. (2015). We combine our new ALMA 1.3 mm flux density with the previous VLA 8.7 mm measurement and 2 cm upper limit, and determine the Planck brightness temperature at all three wavelengths (following Liseau et al., 2013). Figure 6 shows the resulting ALMA and VLA constraints on both the flux density and the brightness temperature spectra of Ceti. We assume that the photospheric radius is comparable at optical and millimeter/centimeter wavelengths, and adopt a value of , obtained from interferometric measurements using the FLUOR instrument on the CHARA array (di Folco et al., 2007). At 1.3 mm this analysis yields K, modestly hotter than the effective temperature of K. However, at longer wavelengths, the brightness temperature diverges significantly from the photospheric prediction with K and K at 8.7 mm and 2 cm, respectively.
Additionally, the spectral index at long wavelengths of the central emission from Ceti shows the same deviation from an optically thick photosphere (spectral index of ) as is seen for Cen A and B and Eridani. Between 1.3 and 8.7 mm, the spectral index of the central peak in our observations of Ceti is (with the uncertainty in the flux scale and the modeling errors added in quadrature). For comparison, the measured spectral indices between 0.87 and 3.2 mm are 1.62 and 1.61 for Cen A and B, respectively (Liseau et al., 2015).
5 Conclusions
We observed the Ceti debris disk with ALMA at 1.3 mm with baselines that probe (4 AU) scales. These are the first observations of this nearby system with a millimeter interferometer and reveal somewhat patchy emission from a dust disk surrounding an unresolved central emission peak. In order to characterize these two emission components, we fit simple parametric models directly to the visibility data within an MCMC framework.
Our best-fit model yields an inner belt edge of AU, consistent with the analysis of previous far-infrared Herschel observations. Given the relatively low sensitivity at short baselines in the ALMA observations, we are unable to place a tighter constraint on the inner edge and its position relative to the proposed five planet system. These data, however, provide a strong lower limit on the fractional width of the belt, with confidence. This result implies that the Ceti debris disk is broad, much wider than the classical Kuiper Belt in our Solar System and more comparable to the HD 107146 debris disk (Ricci et al., 2015).
The bright central peak at the stellar position has a flux density of mJy, somewhat higher than the predicted flux of the stellar photosphere at 1.3 mm. At longer centimeter wavelengths, this excess is more significant, increasing to the photospheric prediction in VLA observations at 8.7 mm (Villadsen et al., 2014). The spectral index between these two measurements is , shallower than the expectation for an optically thick photosphere. Given the high brightness temperatures at both 1.3 and 8.7 mm, this excess emission is likely due to a hot stellar chromosphere. Similar spectra have been observed for other nearby Sun-like stars, e.g. Cen A/B and Eridani.
These first ALMA observations of the Ceti system allow us to probe the structure of the debris disk with higher resolution than previous work. However, higher sensitivity observations at shorter baselines are still needed to constrain the location of the inner edge of the dust belt more precisely. If the disk extends in towards the star, within the orbit of the outermost proposed planet, this provides strong evidence against the posited five planet system. However, if the disk inner edge is located well outside the proposed planetary system, an additional massive planet on a wide orbit may be required to clear out the central hole in the belt. Additional observations with the ACA could provide the necessary sensitivity to determine the position of the inner disk edge and its implications for an interior planetary system.
References
- Aumann (1985) Aumann, H. H. 1985, PASP, 97, 885
- Bannister et al. (2015) Bannister, M. T., Kavelaars, J. J., Petit, J.-M., et al. 2015, ArXiv e-prints, arXiv:1511.02895
- Boley et al. (2012) Boley, A. C., Payne, M. J., Corder, S., et al. 2012, ApJ, 750, L21
- Butler (2012) Butler, B. 2012, ALMA Memo Series, 594
- di Folco et al. (2007) di Folco, E., Absil, O., Augereau, J.-C., et al. 2007, A&A, 475, 243
- Foreman-Mackey et al. (2013) Foreman-Mackey, D., Hogg, D. W., Lang, D., & Goodman, J. 2013, PASP, 125, 306
- Gáspár et al. (2012) Gáspár, A., Psaltis, D., Rieke, G. H., & Özel, F. 2012, ApJ, 754, 74
- Greaves et al. (2004) Greaves, J. S., Wyatt, M. C., Holland, W. S., & Dent, W. R. F. 2004, MNRAS, 351, L54
- Greaves et al. (1998) Greaves, J. S., Holland, W. S., Moriarty-Schieven, G., et al. 1998, ApJ, 506, L133
- Habing et al. (2001) Habing, H. J., Dominik, C., Jourdain de Muizon, M., et al. 2001, A&A, 365, 545
- Hahn & Malhotra (2005) Hahn, J. M., & Malhotra, R. 2005, AJ, 130, 2392
- Hatzes et al. (2000) Hatzes, A. P., Cochran, W. D., McArthur, B., et al. 2000, ApJ, 544, L145
- Husser et al. (2013) Husser, T.-O., Wende-von Berg, S., Dreizler, S., et al. 2013, A&A, 553, A6
- Ishihara et al. (2010) Ishihara, D., Onaka, T., Kataza, H., et al. 2010, A&A, 514, A1
- Jenkins et al. (2013) Jenkins, J. S., Jones, H. R. A., Tuomi, M., et al. 2013, ApJ, 766, 67
- Kalas et al. (2006) Kalas, P., Graham, J. R., Clampin, M. C., & Fitzgerald, M. P. 2006, ApJ, 637, L57
- Lawler et al. (2014) Lawler, S. M., Di Francesco, J., Kennedy, G. M., et al. 2014, MNRAS, 444, 2665
- Lay et al. (1997) Lay, O. P., Carlstrom, J. E., & Hills, R. E. 1997, ApJ, 489, 917
- Liseau et al. (2013) Liseau, R., Montesinos, B., Olofsson, G., et al. 2013, A&A, 549, L7
- Liseau et al. (2015) Liseau, R., Vlemmings, W., Bayo, A., et al. 2015, A&A, 573, L4
- MacGregor et al. (2015) MacGregor, M. A., Wilner, D. J., Andrews, S. M., Lestrade, J.-F., & Maddison, S. 2015, ApJ, 809, 47
- MacGregor et al. (2013) MacGregor, M. A., Wilner, D. J., Rosenfeld, K. A., et al. 2013, ApJ, 762, L21
- Mamajek & Hillenbrand (2008) Mamajek, E. E., & Hillenbrand, L. A. 2008, ApJ, 687, 1264
- Mayor et al. (2003) Mayor, M., Pepe, F., Queloz, D., et al. 2003, The Messenger, 114, 20
- Mundy et al. (1996) Mundy, L. G., Looney, L. W., Erickson, W., et al. 1996, ApJ, 464, L169
- Pavlenko et al. (2012) Pavlenko, Y. V., Jenkins, J. S., Jones, H. R. A., Ivanyuk, O., & Pinfield, D. J. 2012, MNRAS, 422, 542
- Pepe et al. (2011) Pepe, F., Lovis, C., Ségransan, D., et al. 2011, A&A, 534, A58
- Reid et al. (1988) Reid, M. J., Schneps, M. H., Moran, J. M., et al. 1988, ApJ, 330, 809
- Ricci et al. (2015) Ricci, L., Carpenter, J. M., Fu, B., et al. 2015, ApJ, 798, 124
- Tuomi et al. (2013) Tuomi, M., Jones, H. R. A., Jenkins, J. S., et al. 2013, A&A, 551, A79
- van Leeuwen (2007) van Leeuwen, F. 2007, A&A, 474, 653
- Villadsen et al. (2014) Villadsen, J., Hallinan, G., Bourke, S., Güdel, M., & Rupen, M. 2014, ApJ, 788, 112
- Vogt et al. (1994) Vogt, S. S., Allen, S. L., Bigelow, B. C., et al. 1994, in Proc. SPIE, Vol. 2198, Instrumentation in Astronomy VIII, ed. D. L. Crawford & E. R. Craine, 362
- Wright et al. (2010) Wright, E. L., Eisenhardt, P. R. M., Mainzer, A. K., et al. 2010, AJ, 140, 1868
- Wyatt (2006) Wyatt, M. C. 2006, ApJ, 639, 1153
| Observation | Array | # of | Projected | Time on |
|---|---|---|---|---|
| Date | Antennas | Baselines (m) | Target (min) | |
| 2014 Jul 7 | ACA | 11 | 5.8 | |
| 2014 Jul 16 | ACA | 11 | 33.9 | |
| 2014 Dec 15 | 12-m | 34 | 41.4 |
| Parameter | Description | Best-fit | 68% Confidence Interval |
|---|---|---|---|
| Belt inner radius (AU) | |||
| Belt outer radius (AU) | |||
| Belt flux density (mJy) | |||
| Central source flux (mJy) | |||
| Belt surface density power law index |