Far-infrared line spectra of active galaxies from the Herschel/PACS Spectrometer: the complete database
Abstract
We present a coherent database of spectroscopic observations of far-IR fine-structure lines from the Herschel/PACS archive for a sample of 170 local AGN, plus a comparison sample of 20 starburst galaxies and 43 dwarf galaxies. Published Spitzer/IRS and Herschel/SPIRE line fluxes are included to extend our database to the full – spectral range. The observations are compared to a set of Cloudy photoionisation models to estimate the above physical quantities through different diagnostic diagrams. We confirm the presence of a stratification of gas density in the emission regions of the galaxies, which increases with the ionisation potential of the emission lines. The new [O IV]/ [O III] vs [Ne III]/ [Ne II] diagram is proposed as the best diagnostic to separate: i) AGN activity from any kind of star formation; and ii) low-metallicity dwarf galaxies from starburst galaxies. Current stellar atmosphere models fail to reproduce the observed [O IV]/ [O III] ratios, which are much higher when compared to the predicted values. Finally, the ( [Ne III]+ [Ne II])/( [S IV]+ [S III]) ratio is proposed as a promising metallicity tracer to be used in obscured objects, where optical lines fail to accurately measure the metallicity. The diagnostic power of mid- to far-infrared spectroscopy shown here for local galaxies will be of crucial importance to study galaxy evolution during the dust-obscured phase at the peak of the star formation and black-hole accretion activity (). This study will be addressed by future deep spectroscopic surveys with present and forthcoming facilities such as JWST, ALMA, and SPICA.
1 Introduction
Rest-frame mid- to far-infrared (IR) spectroscopy is a unique tool to study dust-enshrouded galaxies and, in particular, to disentangle the emission originated by star-forming activity from that originated by accretion onto supermassive black holes in the nuclei of active galaxies (e.g. Spinoglio & Malkan, 1992). Optical/UV lines provide access only to relatively unobscured gas, hampering our ability to investigate the physics in obscured regions. The extinction is however negligible in the mid- to far-IR range, which contains several lines that provide information of the physical conditions even for heavily obscured gas (see Tables 1 and 2). Therefore, mid- to far-IR lines are the key to investigate not only “star formation” in galaxies, but in general all the processes in the majority of galaxies that occur in a dust-embedded phase, and thus are hidden to optical studies. In the dark side of star formation and active galactic nuclei (AGN) activity we find critical aspects of these phenomena: e.g. deeply buried active nuclei, the onset of the star formation and AGN feeding and feedback through gas inflow and outflow. These processes have a major impact on galaxy evolution but cannot be addressed from an optical/UV perspective.
The potential of mid- to far-IR spectroscopy was already proven by the Infrared Space Observatory (ISO; Kessler et al., 1996), using the Short Wavelength Spectrometer (SWS; de Graauw et al., 1996) and the Long Wavelength Spectrometer (LWS; Clegg et al., 1996). As mid- and far-IR fine-structure emission lines are sensitive to the physical conditions of the interstellar medium (ISM), these transitions can be used to investigate its different phases (e.g. Sturm et al., 2000; Negishi et al., 2001; Spinoglio et al., 2005) and characterise the primary spectrum of the ionising radiation (e.g. Alexander et al., 1999). ISO enabled the development of the first IR diagnostics to separate the AGN, the ISM, and the stellar contributions (e.g. Sturm et al., 2002; Brauher et al., 2008), and shed light on the nature of ultra-luminous IR galaxies (ULIRGs; Genzel et al., 1998).
The full exploitation of the mid-IR window was possible thanks to the InfraRed Spectrograph (IRS; Houck et al., 2004) on-board the Spitzer Space Telescope (Werner et al., 2004). The study of large samples of galaxies including ULIRGs, Quasars, Seyfert galaxies, radio, and starburst galaxies (Armus et al., 2007; Tommasin et al., 2010; Veilleux et al., 2009; Brandl et al., 2006; Bernard-Salas et al., 2009) showed, e.g., the ability of the [Ne V] and the [O IV] lines, associated to high-density and high-excitation photoionised gas (, I.P. ), to investigate: i) the inner part of the narrow-line region (NLR) and identify optically-hidden AGN (Armus et al., 2007); ii) the AGN contribution in ULIRGs (Veilleux et al., 2009); iii) the AGN nature of radio-galaxies (Haas et al., 2005; Leipski et al., 2009); iv) the power of the extinction-free density tracers in the – range based on the [S III] and the [Ne V] lines (Tommasin et al., 2008, 2010); v) star formation tracers based, e.g., on [Ne II] and [Ne III] (Ho & Keto, 2007), or polycyclic aromatic hydrocarbon (PAH) features (O’Dowd et al., 2009; Sargsyan & Weedman, 2009); vi) the warm molecular gas traced by H2 lines (e.g. Tommasin et al., 2008; Baum et al., 2010); vii) the extreme ultraviolet (EUV) spectra of AGN revealed by high-ionisation fine-structure IR lines (Meléndez et al., 2011).
In the far-IR, the Herschel Space Observatory (Pilbratt et al., 2010) provided a large gain in spectroscopic sensitivity when compared to ISO, allowing to access this spectral range for a larger number of galaxies in the nearby Universe. The Photoconductor Array Camera and Spectrometer (PACS; Poglitsch et al., 2010) and the Spectral and Photometric Imaging REceiver Fourier-transform spectrometer (SPIRE; Griffin et al., 2010; Naylor et al., 2010) sampled the – and – ranges, respectively. This spectral region covers the main cooling lines of photo-dissociation regions (PDR), [O I] and [C II], which provide information of the cold neutral gas (Tielens & Hollenbach, 1985), as well as the high-J CO transitions (Kamenetzky et al., 2014, 2015), allowing the investigation of the excitation of molecular gas; the fine-structure lines of [O I] and [N II] as tracers of the IR luminosity and star formation rate in ULIRGs (Farrah et al., 2013); the origin of [C II] emission, mainly associated to the PDR (Spinoglio et al., 2015, hereafter S15); X-ray dissociation regions (XDR; Spinoglio et al., 2012b).
The aim of the present study is to extend for the first time, with a statistical approach, the spectroscopic work done by Spitzer in the mid-IR to the longer wavelengths using Herschel. Taking advantage of the Herschel scientific archive, we extended the previous study presented in S15, limited to a sample of 26 Seyfert galaxies, to a total sample of 170 active galaxies, and a comparison sample of 20 starburst galaxies and 43 dwarf galaxies – the latter taken from the Dwarf Galaxy Survey (Madden et al., 2013). Of particular interest is the development of the diagnostics that will be exploited by future IR observatories, e.g. the James Webb Space Telescope (JWST; Gardner et al., 2006) and the SPace Infrared telescope for Cosmology and Astrophysics (SPICA; Swinyard et al., 2009) for galaxies up to the peak of the star formation rate density (SFRD) at , but also the Atacama Large Millimeter/submillimeter Array (ALMA) for far-IR rest-frame observations of galaxies at high-redshift (). The combination of mid- and far-IR lines expands the possible diagnostics to, e.g., the [O IV]/ [O III] ratio (hereafter [O IV]25.9/ [O III]88) that has been proposed as a powerful diagnostic to discriminate AGN from star formation activity (S15). The larger statistics in the present work allow us to perform a more robust analysis of the diagnostics already tested in S15, including new line ratios sensitive to metallicity and ionisation (Nagao et al., 2011, 2012). We include in this work the results on the “compact sample” of 43 dwarf galaxies presented by Cormier et al. (2015) to investigate how strong star formation activity in low-metallicity environments can be well separated from either AGN and “normal” starburst galaxies through mid- and far-IR line ratios. A set of Cloudy photoionisation models were developed using AGN and starburst galaxies as ionisation sources in order to interpret the behaviour of the observed line ratios and their dependence on density, ionisation parameter, and metallicity.
The text is organised as follows. The selection of the sample of galaxies is explained in Section 2, Section 3 presents the data reduction and describes the catalogs taken from the literature and included in our study, the Cloudy photoionisation models are described in Section 4, the results of this work are detailed in Section 5, and the main conclusions are summarised in Section 6. Due to the large dataset and associated tables needed to show the results of this study, the majority of the latter appear in their complete form only in the online version of this journal.
2 Sample of galaxies
2.1 AGN sample
We have assembled the largest sample of active galaxies with far-IR spectroscopy by Herschel/PACS that was possible from the Herschel scientific archive (Table 6), in spite of the fact that the Herschel mission did not observe, during its 3.5 years operational life any systematic and statistically complete sample of active galaxies.
To do so, we have selected all objects in the Véron-Cetty & Véron (2010) active galaxies catalog that are classified either as QSO or Seyfert galaxies that have been detected with a in at least one of the Herschel/PACS spectral lines in Table 1. The far-IR spectra of these objects were completed with published fine-structure mid-IR emission lines from Spitzer/IRS detected with (see Section 3.2), mostly in the high-resolution mode (hereafter HR) and in a few cases in low-resolution mode (hereafter LR). These galaxies belong to the following original catalogues: the third and fourth Cambridge catalogues of radio sources (3C and 4C, respectively; Edge et al., 1959; Pilkington & Scott, 1965), the European Southern Observatory ESO/Uppsala survey of the Southern Hemisphere (Holmberg et al., 1974), the Fairall catalogue of galaxies (Fairall, 1977), the New General Catalogue and the Index Catalogues (NGC and IC, respectively; Dreyer, 1888, 1895), the Infrared Astronomical Satellite (IRAS) point source and faint source catalogues (Helou & Walker, 1988; Moshir & et al., 1990), the Markarian catalogue (Markarian et al., 1989), the Morphological Catalog of Galaxies (MCG; Vorontsov-Vel’Yaminov & Arkhipova, 1962), the Parkes Radio Sources Catalogue (PKS; Wright & Otrupcek, 1990), the Palomar-Green Catalog of Ultraviolet-Excess Stellar Objects (PG; Green et al., 2009), the Uppsala General Catalogue of Galaxies (UGC; Nilson, 1973), the catalogue of southern peculiar galaxies and associations (AM; Arp & Madore, 1987), the atlas of peculiar galaxies (Arp; Arp, 1966), and the Zwicky catalog of galaxies (Zwicky & et al., 1996).
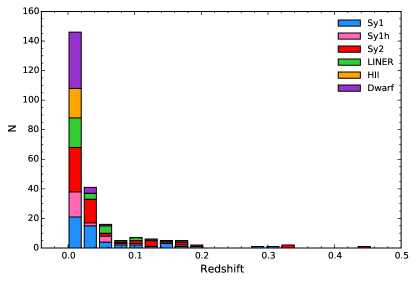
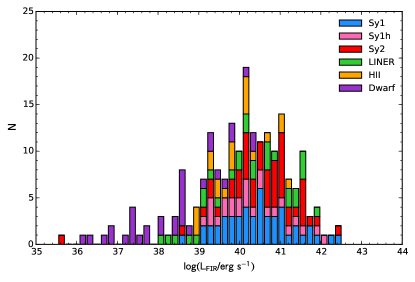
This AGN sample includes a total of 170 galaxies: 54 Seyfert 1 galaxies (S1), 26 Seyfert 1 galaxies with hidden broad-line regions (S1h; broad lines detected in their IR and/or polarised light spectra), 57 Seyfert 2 galaxies (S2), and 33 LINERs. The redshift distribution of the AGN sample, shown in Fig 5a, covers the range , although most of the galaxies are located in the Local Universe with a median redshift of and a median absolute deviation of . The far-IR luminosity distribution, based on the flux of the continuum emission adjacent to the [C II] line, is also shown in Fig. 5b, and has a median value and a median absolute deviation of , covering the range. The metallicities, compiled from the literature (see Table 6), span the range, with a median value and a median absolute deviation of .
Apart from the sample of 170 AGN, there are 8 AGN from the Véron-Cetty & Véron (2010) catalog that were observed by PACS for which no fine-structure emission lines were detected at . Consequently, these 8 targets are not included in our main AGN sample, still we include for completeness upper limits for the PACS line fluxes and equivalent widths, PACS continuum measurements, and Spitzer line fluxes in Tables 6, 6, 6, 6.
2.2 Starburst sample
As a comparison sample, we compiled a sample of 20 starburst galaxies and reduced the PACS spectroscopic observations from the Herschel archive. From the starburst galaxy sample of Bernard-Salas et al. (2009), we have selected the objects classified as “pure starburst galaxies”, discarding those objects with an AGN contribution. From the sample of Goulding & Alexander (2009) we have explicitly included only those objects optically classified as “H ii” region galaxies – by their position in the BPT diagram (Baldwin et al., 1981) – and without an AGN contribution in the mid-IR range, as provided by these authors. For the mid-IR spectroscopy we used the results from Spitzer/IRS high-resolution spectra published in Bernard-Salas et al. (2009) and Goulding & Alexander (2009). The final sample of 20 starburst galaxies covers a redshift range of with a median value of and a median absolute deviation (Fig. 5a). The far-IR luminosity distribution is based on the flux of the continuum emission adjacent to the [C II] line and covers the range, with a median value and a median absolute deviation of (Fig. 5b). The starburst sample span a metallicity range of , with a median value and a median absolute deviation of .(see Table 6).
2.3 Dwarf galaxy sample
We also compared our samples of AGN and starburst galaxies to the mid- and far-IR fine-structure line dataset for the “Dwarf Galaxy Survey” (DGS), presented in Cormier et al. (2015). The DGS includes blue compact dwarf galaxies with metallicities ranging from to , selected from the Hamburg/SAO Survey and the First and Second Byurakan Surveys (Izotov et al., 1991; Ugryumov et al., 2003; Madden et al., 2013). Here we include the 43 dwarf galaxies from the DGS classified as compact (Cormier et al., 2015), i.e. excluding nearby galaxies (NGC 4214 is the closest one at ). Dwarf galaxies probe a more extreme star formation environment at low metallicities when compared to the starburst galaxies. Their low metallicity might mimic the conditions of chemically unevolved galaxies at high redshift, and thus it is important to include these objects in our diagnostics in order to have a wider view of the star formation process. Far-IR continuum fluxes for the dwarf galaxies are taken from Rémy-Ruyer et al. (2015). The sample of dwarf galaxies covers a redshift range of , with a median value of and a median absolute deviation of (Fig. 5a). The far-IR luminosity distribution is based on the Herschel/PACS photometry at , published in Rémy-Ruyer et al. (2015), and covers the range, with a median value and a median absolute deviation of (Fig. 5b). The dwarf galaxies included in this study have stellar masses in the – range, thus overlapping with the masses of nearby starburst galaxies (Madden et al., 2013; Rémy-Ruyer et al., 2015).
2.4 ISO/LWS data
For comparison, 81 galaxies with far-IR line fluxes observed with ISO/LWS, taken from Brauher et al. (2008), were considered only for those active galaxies present in the original selection (Véron-Cetty & Véron, 2010) and for local starburst galaxies, but were not observed by Herschel/PACS. The mid-IR line fluxes were compiled by us from published Spitzer/IRS spectra. These objects are shown only for comparison and are not included into our main sample, due to the larger aperture of ISO compared with that of PACS, therefore the galaxies observed by ISO/LWS are represented by open symbols in the figures shown in this work. In Appendix A we investigate the possible effect of the large ISO apertures on the fluxes of the far-IR fine-structure lines. Fig. 17 shows the comparison of ISO/LWS vs Herschel/PACS [C II] line fluxes for the subsample 45 AGN and starburst galaxies that were observed by both facilities. PACS fluxes are slightly higher with a median value and a median absolute deviation of , thus the inclusion of ISO data in our diagrams is reasonable since significant contamination from extended emission is not expected for our sample of galaxies.
3 Observations
The combination of Herschel/PACS and Spitzer/IRS allows us to cover the fine-structure emission lines from the mid- to the far-IR (– in the rest-frame) for all the galaxies in the sample. This database was completed with the Herschel/SPIRE published values of the [N II], and [C I] line fluxes (mainly from Kamenetzky et al. 2015). In this Section we describe the reduction of the Herschel/PACS observations and the characteristics of the different datasets collected from the literature.
3.1 Herschel/PACS Spectroscopy
The far-IR spectra of the galaxies in the AGN and starburst samples were acquired with Herschel/PACS, which includes an integral field unit spectrograph observing in the – range, with squared spaxel elements covering a field of view (FOV) of about and a spectral resolving power in the range – (–), depending on wavelength. The observations were retrieved from the Herschel Science Archive. The data were reduced using our own pipeline based on the standard recipes included in the hipe111hipe is a joint development by the Herschel Science Ground Segment Consortium, consisting of ESA, the NASA Herschel Science Center, and the HIFI, PACS and SPIRE consortia. v13.0.0 environment. The data reduction procedure includes outlier flagging, spectral flat-fielding, re-grid of the wavelength sampling, and flux calibration. Most of the targets were acquired using the chop-node mode and reduced with the background normalisation method: the off-source spectra are used to correct the spectral response of the on-source data and to perform the background subtraction. This is the standard procedure in the hipe pipeline for PACS since v13.0.0. Observations acquired with the unchopped mode include a dedicated off-source pointing, which was used to perform the background subtraction.
For each target, a final standard rebinned data cube was produced for the available fine-structure lines listed in Table 1. The [C II] transition shows the best coverage with 159 AGN and 17 starburst galaxies observed and detected, while the [O III] transition was detected only for 19 AGN and one of the starburst galaxies. The final spectra are extracted from the innermost spaxels (), to avoid possible flux losses due to the known pointing jitter and offsets. In all cases, a point-source loss correction, implemented within hipe, is applied to the extracted spectra. For a total of 26 sources (all in the AGN sample), one or more lines were not detected in the spectrum, but only in the central spaxel. This is typically the case of faint sources in which the spaxels surrounding the central one are dominated by noise, and thus only the central spaxel has a substantial contribution to the line emission. For these targets, the final spectra and derived fluxes in Table 6 are extracted only from the central spaxel (and indicated by a “c” table in the column “Notes”). A complete flux extraction has been performed for all galaxies using three different methods: a) the central spaxel only; b) the central array; and c) the whole detector area of spaxels.The complete database is reported in Table 6. We note that the fluxes are not corrected for point-source losses (this is not provided by hipe v13.0.0), which are expected to be of the order of for a point-like source according to the PACS manual.
The analysis was performed using our own routines developed in Python222https://www.python.org, and routines from the Astropy333http://www.astropy.org package (Astropy Collaboration et al., 2013). In order to increase the S/N of the extracted spectra, we used a Wiener filter to remove those spurious spectral features characterised by a width smaller than the instrumental spectral resolution and a peak below rms. The latter are produced during the acquisition and/or reduction process and must be removed for a realistic estimate of the flux errors. Line fluxes measured before and after the filtering are in agreement, within the estimated uncertainty, while the S/N ratios improve by a factor of on average.
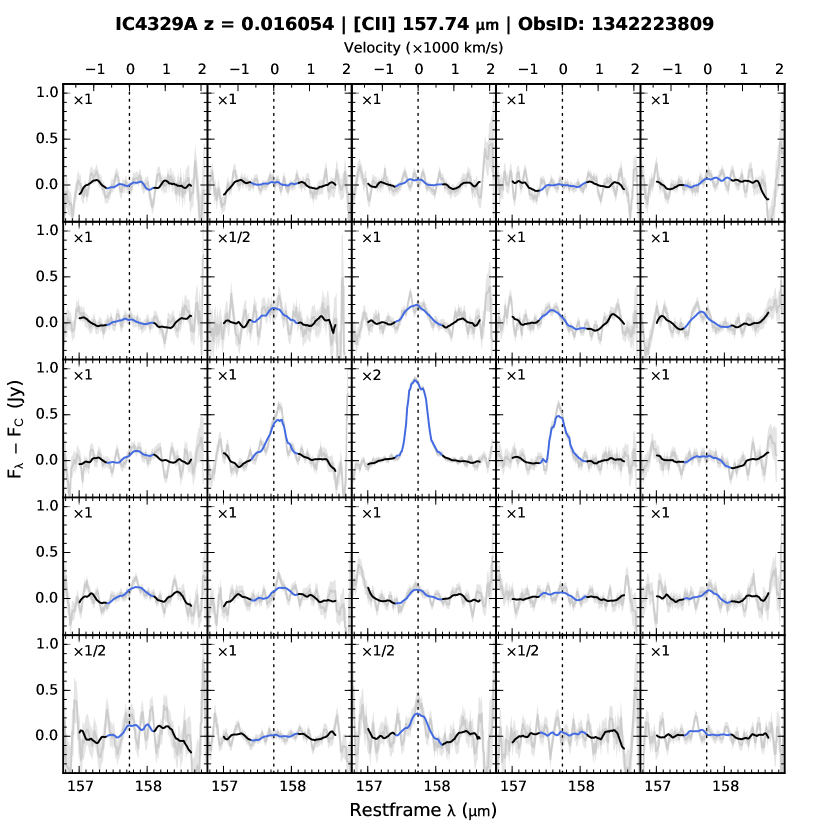
Following the approach in S15, the line fluxes are obtained by numerical integration across the line profiles (blue-shaded area in Figs 1,2,3). The continuum level is estimated from a 1D polynomial fit performed for the spectral channels located in the blue and the red wings adjacent to the line (black-solid line). A single Gaussian was fitted to the profile of each line in order to obtain the central wavelength, standard deviation, and Gaussian flux (red-solid line). The original unfiltered spectrum and its associated uncertainty are shown in grey in Figs 1,2,3. Additionally, spectral maps for each of the lines covered are also provided in the style of Fig. 4, including the Wiener filtered spectrum for the line (in blue) and the adjacent continuum (in black), and the unfiltered spectrum with its associated uncertainty (in grey). In order to facilitate the visualisation and comparison of different line profiles and intensities in these figures, the spectra are shown after continuum subtraction (continuum flux density is quoted in the lower part of the figure as ) and normalised by a certain factor (quoted in the upper left part of the figure).
In the electronic version of this journal we provide, for each of the far-IR fine-structure lines observed by PACS for the 170 AGN and 20 starburst galaxies in the sample: the line fluxes (Table 6), the equivalent width values (Table 6), the continuum level (Table 6), the standard deviation of the best-fit Gaussian profile (Table 6), and the corresponding figures for the central spaxel (Fig. Set 1), array (Fig. Set 2), array extracted spectra (Fig. Set 3) and the array line maps (Fig. Set 4). The Herschel/PACS and Spitzer/IRS line fluxes for the sample of dwarf galaxies are taken from Cormier et al. (2015), and are not reported in this publication. Upper limits are also provided for 8 AGN that were not detected by PACS.
3.2 Spitzer/IRS Spectroscopy
Table 6, in the electronic version of this journal, collects published mid-IR (–) fine-structure line fluxes measured with Spitzer/IRS for our samples of AGN and starburst galaxies. HR observations are favoured, completed with LR spectra in those cases without HR observations (14 galaxies have both IRS-LR spectra and Herschel/PACS). These values were complemented with unpublished IRS observations from the Spitzer archive and reduced by us for 20 galaxies, following the same procedure as in Pereira-Santaella et al. (2010a) and Pereira-Santaella et al. (2010b). Spitzer/IRS HR line fluxes for the samples of starburst and dwarf galaxies were taken from Bernard-Salas et al. (2009) and Goulding & Alexander (2009), and Cormier et al. (2015), respectively.
3.3 Herschel/SPIRE spectroscopy
In Table 6 we compiled the published Herschel/SPIRE fluxes of the [N II], [C I] and [C I] lines, for the samples of AGN, starburst, and dwarf galaxies. These values are mainly provided by Kamenetzky et al. (2015) and complemented with the data published in Israel et al. (2015), Pereira-Santaella et al. (2013), Pereira-Santaella et al. (2014), and Kamenetzky et al. (2014).
4 Models
The photoionisation code Cloudy444Available at http://www.nublado.org has been used in this study to model the physical conditions of the gas exciting the IR fine-structure lines. Calculations have been performed with its version C13.03, last described by Ferland et al. (2013), using the pyCloudy library (Morisset, 2013). To reproduce the emission of the NLR associated to the nuclei of active galaxies, a grid of constant density models with a plane-parallel geometry and sampling hydrogen density () in the to range, has been built using AGN spectra as primary radiation sources. The AGN ionising continuum corresponds to a power law extending from the optical to the X-rays with a slope of (), and ionisation parameters (555Dimensionless ionisation parameter as defined in Ferland et al. (2013).) with values of . For these models we choose a maximum column density of as stopping criterion of the spatial integration, representative of the column density found in NLR clouds (Moore & Cohen, 1994). LINER galaxies typically show a steeper optical-to-UV continuum when compared with brighter AGN (Ho 1999; Halpern et al. 1996; see also Fernández-Ontiveros et al. 2012; Mason et al. 2012). Following this, a similar grid of models covering the same density and ionisation parameter values but with a steeper ionising continuum (), has been computed in order to reproduce the line ratios expected for a weaker ionising spectra, i.e. for a vanishing accretion disc (Ho, 2008). We note however that the excitation mechanism in LINERs is still a matter of debate (Ho, 2008, and references therein) and different mechanisms might contribute (e.g. Dopita et al., 2015).
The star formation ionising spectrum was simulated using the Starburst99 code (Leitherer et al., 1999) for two cases: i) a young burst of star formation with an age of and a metallicity of (), in order to produce a hard UV ionising spectrum in a low metallicity environment; and ii) a continuous burst of star formation with an age of and solar metallicity (following our previous simulations in S15). In the first case we aim to reproduce the conditions in violent and short lived star formation events, like those in dwarf galaxies, thus we refer to these models as “dwarf galaxy models” hereafter. The second case aims to reproduce the more quiescent and continuous star formation in the disk of galaxies, characterised by a softer ionising continuum, accordingly these will be called “starburst models” hereafter. The metallicity of the stellar population determines the strength of the ionising continuum, thus we used sub-solar metallicity models for dwarf galaxies666The majority of dwarf galaxies in the sample show metallicities in the range (Madden et al., 2013)., and solar metallicities for starburst models. The ionising continuum is also dependent on the age of the stellar population for instant starburst models, but it is fairly independent of the age for continuum starburst models after the first few Myr (Leitherer et al., 1999). Thus the main results of this work will not change if a continuum starburst model is considered as reference for the starburst galaxies.
We use models with plane-parallel geometry, constant pressure, initial densities in the to range, and ionisation parameters in the to range. In both cases we assumed two intervals for the Kroupa initial mass function (IMF; with exponents , and mass boundaries of , , and ), the 1994 Geneva tracks with standard mass-loss rates, and the Pauldrach/Hillier atmospheres, which take into account the effects of non-LTE and radiation driven winds. For the study of the dependence of line ratios with metallicity (Section 5.5), the previous models were extended to the following metallicity values: , , , , and . These values are based on the metallicities available for the Geneva stellar tracks with standard mass-loss rates, used in the Starburst99 models to generate the starburst ionising spectra.
In dwarf galaxy and starburst models we chose a different stopping criteria based on the temperature, instead of the column density. The spatial integration was stopped at the radius where two different temperatures were reached, producing two kinds of models in each case: i) models stopped at that only include the contribution of photoionised gas to the emission lines; and ii) models extended to that take into account the contribution from the PDR. In particular, the comparison of and models allows us to identify which line ratios are affected by the contribution of PDR emission and, e.g., to investigate the origin of [C II], which is produced by both neutral gas and low-density, low-excitation ionised gas (see also S15). In both cases we used models with constant pressure, with the initial densities mentioned earlier, since they accommodate better the changes in the structure of the cloud when the calculation is extended deeper into the cold neutral gas, down to , thus the predicted line ratios for the PDR are more reliable.
For AGN models we did not choose a temperature-based stopping criterion to differentiate the XDR contribution due to: i) the simulations do not converge to temperatures lower than , due to the harder spectra of AGN and the X-ray contribution heating the neutral gas; ii) further discussion in Sections 5.1, 5.2 show that the XDR contribution to neutral gas tracers, e.g. [C I]609/371 and [C II]158/ [O I]63, is negligible, while the values found for these line ratios are in agreement with PDR emission.
All the models presented here to reproduce AGN (Seyfert and LINERs), dwarf galaxies (with and without PDR), and starburst galaxies (with and without PDR), aim to predict ideal cases for these ionising sources. Most of the objects in our sample are expected to show mixed contributions since our large aperture spectra include emission from the host galaxy and therefore star formation processes contribute to the emission of most lines. Thus, the observed line ratios are expected to lie among these models for most of the diagnostic diagrams.
5 Results
The final database includes a variety of lines sensitive to different sources of excitation and physical conditions, from the high-ionisation [Ne V] lines – indicative of AGN activity, to star formation/H ii regions tracers (e.g. [Ne II], [Ne III], [O III]), and PDR sensitive lines (e.g. [O I], [C I], [C II], the latter also produced in H ii regions). In the following sections we will explore the dependence of line ratios on various physical quantities.
5.1 Density, Ionisation, and Temperature
As shown in our previous work (S15), emission-line ratios obtained from pairs of mid- and far-IR lines from the same ionic species, e.g. [N II]205/ [N II]122 (hereafter [N II]205/122), [S III]33.5/18.7, [O III]88/52, and [Ne V]24.3/14.3, have the same ionisation potential but different critical densities (see Table 1), and thus can be used to trace the densities of the ionised gas in the to range (e.g. Rubin et al., 1994). On the other hand, the cooling lines of the neutral gas, [O I], [C II], and [C I], provide density and temperature diagnostics when they are compared to PDR and XDR models (e.g. Tielens & Hollenbach, 1985; Liseau et al., 2006; Meijerink, Spaans & Israel, 2007). In particular, theoretical estimates based on the statistical equilibrium equations predict that the [O I]145/63 line ratio is, in the optically-thin limit, a good temperature tracer for the neutral gas in the – range at (Liseau et al., 2006). The [C I] lines, observed by Herschel/SPIRE, are formed in the transition layer between ionised carbon and molecular CO gas (C+/C/CO), typically above their critical densities (). The line ratio is sensitive to the XDR contribution, since X-rays are able to penetrate deep into the cloud and warm all the neutral carbon, thus lowering the [C I]609/371 ratio as the temperature increases (Meijerink, Spaans & Israel, 2007; Ferland et al., 2013). In this Section we use our sample to review the possible correlation between density, ionisation, and neutral gas temperature already presented in S15. Thus, Figs 6a,b and 7a are extensions of the work initiated in S15 for a smaller sample of galaxies.
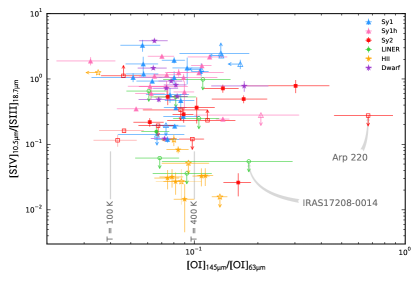
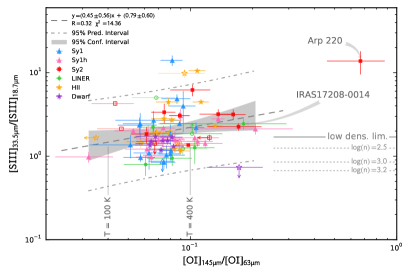
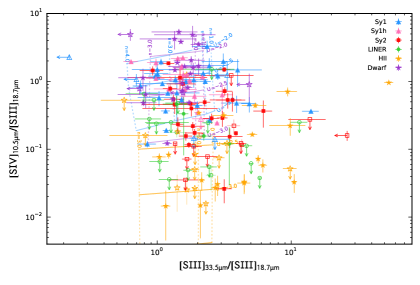
In Fig. 6a, the [S IV]10.5/ [S III]18.7 ratio – sensitive to the hardness of the ionising radiation – is compared to the neutral gas temperature sensitive [O I]145/63 ratio. On the right panel, the [S III]33.5/18.7 ratio – sensitive to the density in the – range – is compared to the same temperature tracer, [O I]145/63. As mentioned earlier, open symbols correspond to ISO/LWS observations (Brauher et al., 2008), complemented with Spitzer/IRS measurements in the literature, for those objects without Herschel/PACS spectroscopy. As expected, AGN and starburst are separated by the [S IV]10.5/ [S III]18.7 ratio, sensitive to the ionisation parameter, but no correlation is found between both ratios, i.e. harder radiation fields are not associated with a warmer neutral ISM. On the other hand, density and temperature were tentatively correlated in S15. The extended sample does not show a significant correlation between temperature and density traced by [S III]33.5/18.7, with and a low Spearman’s rank correlation coefficient of .
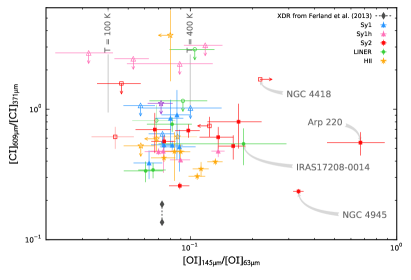
A likely explanation for the lack of correlation between these line ratios is the different ISM phases traced, i.e. ionised gas in [S IV]10.5/ [S III]18.7 and [S III]33.5/18.7 vs neutral gas in [O I]145/63. Figs 6a,b show that a harder ionising spectrum or a denser ionised gas does not implies a hotter temperature for the associated neutral gas, possibly suggesting a more complex ISM structure. Furthermore, we note that [O I]145/63 values above would imply optically-thick emission (Tielens & Hollenbach, 1985), but can be reconciled with optically-thin emission if the effect of heavy element opacity is considered (Rubin, 1983, 1985). Specifically, the [O I] line can be affected by self-absorption even for small amounts of cold foreground gas (; Liseau et al., 2006). This effect is particularly dramatic in the cases of Arp 220 (Figs 6a,b and Fig. 7b), NGC 4945 and NGC 4418 (Fig. 7b), and IRAS17208–0014 (Figs 6b). Their spectra for the central spaxel array – available as online material in Fig. Set 1.77 (NGC 4418), 1.95 (NGC 4945), 1.135 (IRAS17208–0014), 1.127 (Arp 220) – show a prominent absorption component in the [O I] line (see also fig. 11 in González-Alfonso et al., 2012, for the cases of Arp 220 and NGC 4418), or even in the [O III] line (IRAS17208–0014). A self-absorption contribution to the [O I] line would also play against the correlations explored in this Section. Furthermore, shocks might also play a role in the [O I] line emission (see Hollenbach & McKee, 1989; Lutz et al., 2003).
Fig. 7a shows the [S IV]10.5/ [S III]18.7 vs [S III]33.5/18.7 line ratios, i.e. ionisation vs density of the ionised gas. S1 galaxies, S1h galaxies, and dwarf galaxies, where the ionisation is stronger, show tentatively lower [S III]33.5/18.7 ratios with median values and median absolute deviations of , , , respectively, when compared to starburst galaxies with . However the difference is not statistically significant due to the high dispersion in the [S III]33.5/18.7 ratio, thus no correlation is found between ionisation and density. This lack of correlation can be explained by the combination of different ionisation parameter values and densities in the Cloudy photoionisation models shown in Fig. 7a. Most of the S1, S1h, and dwarf galaxies in our sample are in agreement with photoionisation models in the and ranges, starburst galaxies span the and ranges, while S2 galaxies and LINERs are found in both the AGN and the starburst domains. Note that galaxies with [S III]33.5/18.7 ratios are above the low-density limit, thus [S III]33.5/18.7 is no longer sensitive to density for those cases.
Fig. 7b shows the [C I]609/371 vs the [O I]145/63 line ratios, both sensitive to the neutral gas temperature in the PDR, where [C I]609/371 decreases and [O I]145/63 increases with increasing temperature. Again, our sample does not show any correlation between these two ratios, probably due to the different density ranges probed by the [O I]145/63 () and the [C I]609/371 () ratios, and the above mentioned self-absorption in the [O I] line. The [C I] lines probe a denser and colder gas inside the cloud when compared to the [O I] lines. Overall, most of the galaxies show the typical values expected for PDR emission, including AGN galaxies which show similar ratios when compared to starburst galaxies. A median [C I]609/371 ratio of with a median absolute deviation of are measured for the eight starburst galaxies detected, comparable to the median obtained for Seyfert and LINER galaxies. This implies that XDR emission, whose ratio is expected to be around [C I] (see table 2 in Ferland et al. 2013; also simulations by Meijerink, Spaans & Israel 2007), does not have an important contribution – within the Herschel/SPIRE aperture of – to the neutral carbon emission for the AGN galaxies in our sample, which show [C I]609/371 ratios typical for PDR and similar to starburst galaxies.
5.2 Density stratification
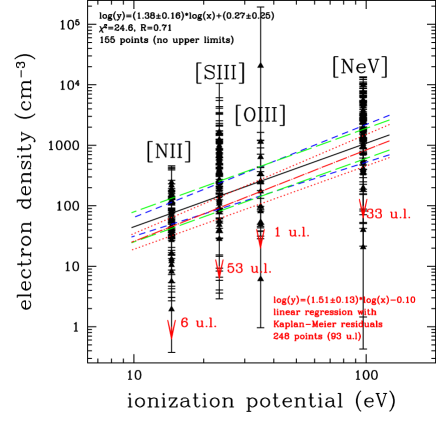
The observed properties of the emission lines are closely linked to the physical conditions of the region where they are originated. Lines with a high ionisation potential such as [Ne V] () can only be produced in the innermost region of the NLR, as they are powered by the strong ionising spectrum of the AGN. Thus they are expected to trace a denser gas when compared with [O III] () and [S III] (), produced in the outer NLR and H ii regions, and [N II] (), produced also in low-density H ii regions. This density stratification was shown by S15 and is reviewed here using our larger sample.
Table 6 shows, for each object in the sample, the [Ne V]24.3/14.3, [O III]88/52, [S III]33.5/18.7, and [N II]205/122 line ratios, where available, and their associated uncertainties, the average electron densities derived for each ratio – assuming purely collisionally excited gas at a temperature of , as in S15 – and the density error due to the line ratio uncertainty. Fig. 8 shows the electron density vs the ionisation potential for all the galaxies in the sample with at least a pair of lines detected of the same species. Our extended sample confirms the correlation found by S15: lines ionised by a harder radiation field originate in gas with higher densities (–), while softer radiation is associated with lower densities (–). This correlation is quantified by: a) a weighted least-square fit of the form , , correlation coefficient (black-solid line; blue-dashed lines indicate the uncertainty associated with the fit); b) a linear regression using the Kaplan-Meier residuals777The linear regression was performed using the buckleyjames routine, available in the stsdas data analysis package:
http://stsdas.stsci.edu/cgi-bin/gethelp.cgi?buckleyjames.hlp of the form (red dot-dashed line; red-dotted lines indicate the associated uncertainty). The Kaplan-Meier residuals method, included in the asurv package888Astronomy Survival Analysis Package, described in:
http://stsdas.stsci.edu/cgi-bin/gethelp.cgi?survival.hlp, is further described in Isobe, Feigelson & Nelson (1986). A total of pairs of lines were used for the weighted least-square fit, while pairs of lines – of them as upper limits – were included in the Kaplan-Meier residuals fit.
We note that the upper limits on the density are not caused by a detection limit in the line observations, but rather due to the limited range where the line ratio is sensitive to density (see Table 6, also fig. 2 in S15). The upper limits reported in Table 6 and Fig. 8 derived from the [N II]205/122, [S III]33.5/18.7, and [Ne V]24.3/14.3 line ratios denote density values below the corresponding low-density limits of each of these three line ratios: , , and for [N II]205/122, [S III]33.5/18.7, and [Ne V]24.3/14.3, respectively. Only in the case of NGC 7172, for which the [N II] was extracted from the PACS central spaxel, the upper limit on the density based on the [N II]205/122 line ratio seems to be caused by the different apertures between PACS () and SPIRE ().
The slope of the linear regression obtained using these two different methods is consistent within the uncertainties, and also with the results in S15, being the error here a factor of smaller due to the improved statistics.
An additional line ratio, [Ne III]36.0/15.6, was considered for this analysis. This ratio traces gas at very high densities in the range, even higher than those probed by [Ne V]24.3/14.3, with a lower excitation (). Unfortunately, the [Ne III] is out of the Spitzer/IRS-SH spectral coverage for most of the galaxies in our sample. We compiled a few Spitzer measurements given by Bernard-Salas et al. (2009) and Rampazzo et al. (2013), plus ISO/SWS and LWS measurements999As discussed in Appendix A, aperture effect on ISO/LWS line fluxes are not expected to be important in our sample of galaxies. from Sturm et al. (2002), Verma et al. (2003), and Satyapal et al. (2004). From a total of 29 galaxies (12 of them are upper limits in [Ne III]), 28 have [Ne III]36.0/15.6 ratios (16 galaxies) or upper limits (12 galaxies) below the low-density limit, i.e. . This is consistent with the scenario proposed in S15 and confirmed here, i.e. the gas with the highest densities is traced by the lines with the highest ionisation potential. The measured [Ne III]36.0/15.6 ratios are associated to a lower density gas when compared to the [Ne V]24.3/14.3 ratio.
5.3 Diffuse low-excitation photoionised gas and dense neutral gas
The UV radiation, emitted by the H ii regions in galactic star forming regions or by the accretion disk in AGN, can heat the nearby gas clouds via photoelectric emission by dust grains (e.g. Tielens & Hollenbach, 1985). This originates the PDR, a transition region in the cloud between ionised and molecular gas (), in which [C II] and [O I] are the most important cooling lines, mainly excited by collisions with H2 molecules and H i (–; Tielens & Hollenbach, 1985; Liseau et al., 2006). Although most of the [C II] emission comes from neutral gas, it might also have a non-negligible contribution () from low-excitation ionised gas (e.g. S15, Cormier et al., 2015).
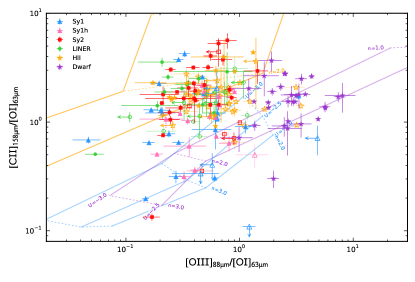
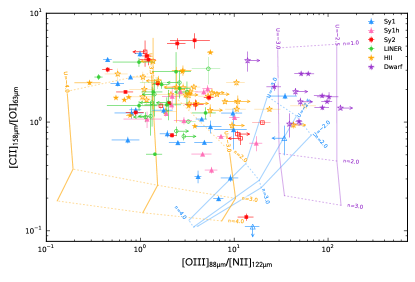
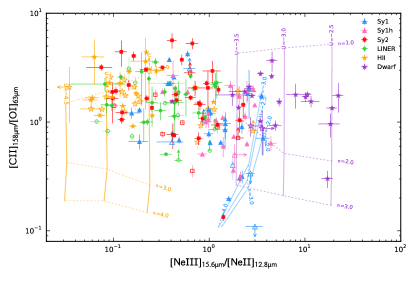
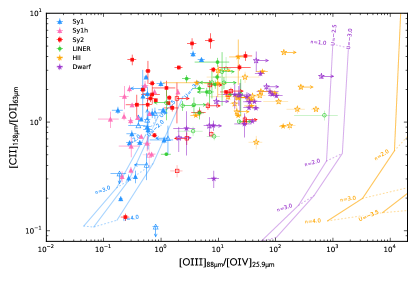
The Figs 9a,b and 10a,b show the [C II]158/ [O I]63 ratio vs the [O III]88/ [O I]63, the [O III]88/ [N II]122, the [Ne III]15.6/ [Ne II]12.8, and [O III]88/ [O IV]25.9 line ratios, respectively. The [C II]158/ [O I]63 ratio in PDR depends mostly on density, although optical depth effects in [O I] and H ii region contribution to the [C II] line might limit the ability of this ratio as density tracer (Abel et al., 2007). No statistically significant difference has been found for the [C II]158/ [O I]63 ratio between the different sub-classes. As suggested by the [C I]609/371 line ratio in Section 5.1, the XDR does not seem to contribute significantly, since the [C II]158/ [O I]63 line ratio is similar for both AGN and starburst galaxies.
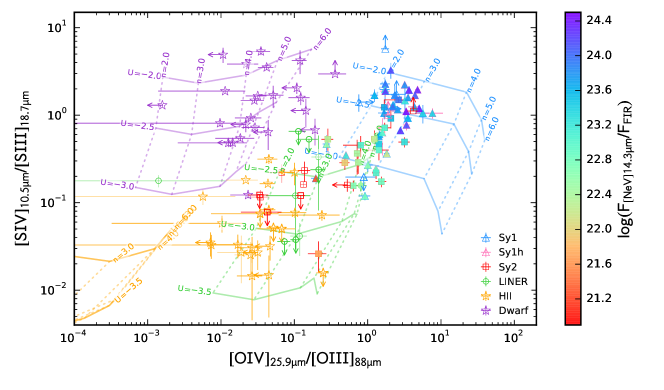
The [O III]88/ [O I]63 ratio in Fig. 9a is almost insensitive to ionisation, being dwarf galaxies the only class that is clearly distinguished with values of . Our models confirm this behaviour, with a few S1 and S1h located in the AGN grid, while the rest of Seyfert galaxies, LINERs, and starburst galaxies are found within the grid of starburst models. The [O III]88/ [N II]122 ratio in Fig. 9b is mildly sensitive to ionisation, it is not able to separate Seyfert’s from starburst galaxies, while dwarf galaxies are clearly distinguished due to their strong [O III] emission. Cloudy models in Fig. 9b also show this dependency on ionisation, with a superposition for AGN and dwarf galaxy models at low densities () and high ionisation parameter values (). A high-excitation photoionised gas tracer, such as the [O III]88/ [O IV]25.9 line ratio in Fig. 10b, is able to separate starburst galaxies, Seyfert nuclei, and dwarf galaxies. Cloudy models in Fig. 10a are in agreement with the observed [C II]158/ [O I]63 and [Ne III]15.6/ [Ne II]12.8 line ratios, and explain the higher [Ne III]15.6/ [Ne II]12.8 ratios shown by dwarf galaxies. We note in Fig 10b that neither starburst models (in yellow; most of the grid falls outside the figure due to the high [O III]88/ [O IV]25.9 predicted ratios) nor dwarf galaxy models (in purple) are able to reproduce the observed [O III]88/ [O IV]25.9 line ratios, which are overestimated by more than an order of magnitude. The models predictions for oxygen and neon high-ionisation ratios will be further discussed in Section 5.4.
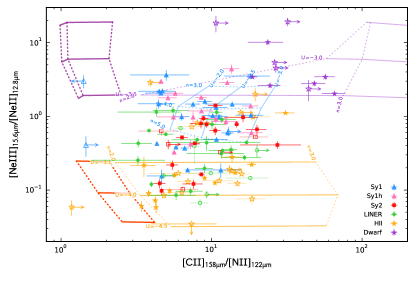
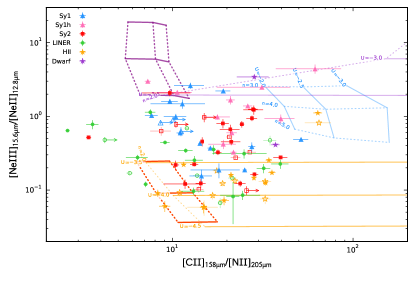
Figs 11a,b show the [Ne III]15.6/ [Ne II]12.8 ratio vs the [C II]158/ [N II]122 and [C II]158/ [N II]205 ratios, respectively. The latter ratios are sensitive to the fraction of PDR to low-excitation photoionised gas emission, since [C II] is mostly originated in PDR while [N II] are emitted by ionised gas. The PDR emission is inherently included in the Cloudy models whose radial integration have been extended to the low temperature of (yellow grid in Fig. 11), while models stopped at denote the ratios predicted for pure ionised gas (dark orange grid). Similarly, we compare dwarf galaxy models stopped at (dark violet grid) and those extended to , thus including the PDR emission (light violet grid). The difference in the [C II]158/ [N II]122,205 ratios between pure photoionised models and those including the PDR is even more extreme in the case of dwarf galaxies. When compared with the models, the observed ratios suggest that most of the [C II] emission is originated in the PDR, in agreement with the results of Cormier et al. (2015) for the same sample of dwarf galaxies included here. These authors estimate that only of [C II] is originated is H ii regions. The observed line ratios in Fig. 11a also reveal a possible dependence, for starburst galaxies, of the [C II]158/ [N II]122 ratio on the ionisation, traced by the [Ne III]15.6/ [Ne II]12.8 ratio. A harder ionising spectrum might produce a larger amount of N2+ in the difuse ionised gas, thus decreasing the relative contribution of the [N II] emission. Consequently, the high [C II]158/ [N II]122 ratios found in dwarf galaxies are explained by the high excitation in these objects (Cormier et al., 2015). This is also the case of NGC 1222, a near-solar metallicity starburst that possibly experienced a merger with a low-metallicity companion (Beck et al., 2007). In this regard, the [C II]158/( [N II]122+ [N III]57) ratio might be more appropriate to evaluate the relative PDR to ionised gas contribution. Unfortunately, the [N III] line has been observed only for six starburst galaxies (four detections), thus we do not have enough statistics to test the proposed PDR-to-ionised gas ratio.
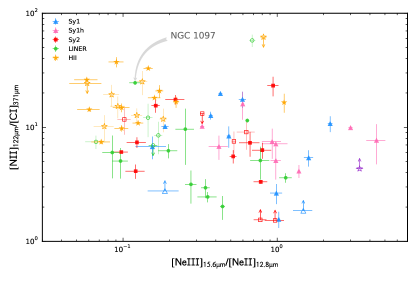
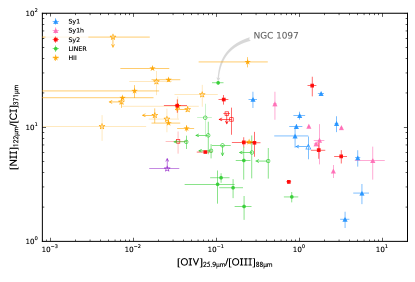
Fig. 12 shows the [N II]122/ [C I]371 line ratio vs the ionisation sensitive ratios [Ne III]15.6/ [Ne II]12.8 and [O IV]25.9/ [O III]88. The [N II]122/ [C I]371 ratio accounts for the relative contribution of low-excited photoionised gas to neutral gas in the PDR. Overall, starburst galaxies seem to be biased toward higher values of the [N II]122/ [C I]371 ratio, being always found above , with a median value of and a median absolute deviation of . LINERs show tentatively lower values with an average of [N II]122/ [C I]371 and a deviation of . A possible explanation would be the presence of an XDR in LINERs, which would contribute with a brighter [C I] line emission. However the [C I]609/ [C I]371 ratio in Fig. 7b showed typical PDR values, suggesting that the XDR contribution to the atomic carbon lines is negligible in our sample at the angular resolution of the SPIRE data. A decreasing [N II] contribution in favour of [N III] emission at higher excitation would explain the lower [N II]122/ [C I]371 ratios found in LINERs, if a harder ionising spectrum is assumed for LINERs when compared to starburst galaxies. However, Fig. 11 does not show a dependence of the [C II]158/ [N II]122 ratio with the ionisation parameter for LINERs, as it was the case for starburst galaxies. An alternative explanation for the different [N II]122/ [C I]371 ratios is that starburst galaxies have a larger filling factor of diffuse low-excitation photoionised gas within the SPIRE aperture when compared to LINER galaxies. In this regard, we note that most of the LINERs in Fig. 12 are found in early-type spirals, while the LINER with the highest ratio, NGC 1097 (), has a bright circumnuclear starburst ring unresolved within the SPIRE aperture of . A larger sample of LINERs and starburst galaxies would be needed in order to prove this behaviour.
5.4 Discriminating AGN and Starburst
5.4.1 Oxygen and Neon line ratios
High to low excitation IR line ratios such as [Ne V]14.3/ [Ne II]12.8 and [O IV]25.9/ [Ne II]12.8 have been commonly used to measure the relative contributions of AGN and star formation in active galaxies (Sturm et al., 2002; Armus et al., 2007; Meléndez et al., 2008; Tommasin et al., 2008). Since photoionisation by young stars cannot have a significant contribution to transitions with a high ionisation potential (), as the AGN does, these line ratios are sensitive to the relative strength of the AGN compared to the starburst. So far, these diagnostics have been tested by comparing samples of active nuclei with starburst galaxies (e.g. Treyer et al., 2010). In this work we compare AGN and starburst galaxies but also low-metallicity dwarf galaxies, and therefore we propose a new diagnostic including the long-wavelength [O III] line measured by Herschel/PACS.
In S15 we showed that the [O IV]25.9/ [O III]88 line ratio is a good tracer of the relative AGN to star formation contribution. These oxygen lines have critical densities in the – range and their ratio is sensitive to the hardness of the ionising radiation in the – range (–). Thus, the [O III] line can be excited by both young stars and AGN activity, while the [O IV] transition becomes much more intense under the presence of an AGN (Sturm et al., 2002; Diamond-Stanic et al., 2009; Spinoglio et al., 2012a). The [O IV] line is brighter than the [Ne V] lines, and can still be detected in star formation environments. This makes this line ideal to identify the location of the different populations, i.e. AGN and starburst as well as dwarf galaxies, in the diagnostic diagrams.
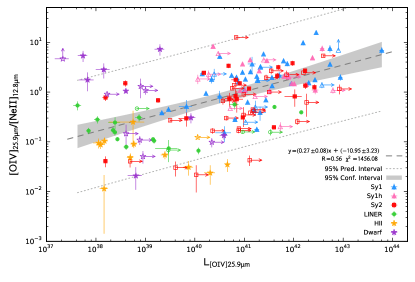
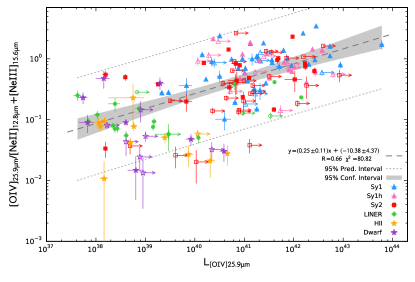
In Fig. 13a,b we show the usual [O IV]25.9/ [Ne II]12.8 ratio (e.g. Genzel et al., 1998; Sturm et al., 2002; Meléndez et al., 2008) and the [O IV]25.9/( [Ne II]12.8+ [Ne III]15.6) ratio, respectively, as a function of the [O IV] luminosity (). If only AGN and starburst galaxies were taken into account in Fig. 13a, a gradient would be present from lower values of [O IV]25.9/ [Ne II]12.8 and relatively low [O IV] luminosities of , where star formation dominates the ratio in H ii region galaxies, to [O IV]25.9/ [Ne II]12.8 and high , where AGN activity is the dominant source of radiation (blue and pink triangles, and red squares). LINERs (green dots) are found in the intermediate region between star formation and Seyfert’s, while five S2 galaxies (red squares) appear to be dominated by star formation. However, this correlation no longer applies if we consider the sample of dwarf galaxies, which are able to reach the AGN-dominated regime in this diagram, showing [O IV]25.9/ [Ne II]12.8 line ratios similar to those of Seyfert’s, but at low [O IV] luminosities compared to AGN. The least squares regression still shows a trend with higher line ratios found at higher luminosities,
| (1) | ||||
but the large dispersion introduced by dwarf galaxies, which results in a relatively low Spearman’s rank correlation coefficient of , limits the validity of the [O IV]25.9/ [Ne II]12.8 line ratio as an AGN/starburst tracer.
The lower metallicity in dwarf galaxies allows the presence of a hotter main sequence and thus a harder radiation field, increasing the filling factor of low-density ionised gas (Schaller et al., 1992; Cormier et al., 2015). In particular, the ionising spectra of dwarf galaxies is much harder just after the Lyman break, which also increases the [Ne III]15.6/ [Ne II]12.8 line ratio (and [S IV]10.5/ [S III]18.7, see below) when compared to a solar-metallicity starburst (O’Halloran et al., 2006; Hao et al., 2009, see Fig. 11a). Our Fig. 13a demonstrates that the [O IV]25.9/ [Ne II]12.8 line ratio does not probe the relative AGN-to-starburst contribution at low metallicities, since a large fraction of the star formation component is probably emitted in the form of [Ne III] (see Ho & Keto, 2007). This casts doubts on our ability to separate AGN and starburst components, e.g. in composite objects with extreme star formation bursts or mergers involving a chemically unevolved dwarf companion, and prompts us to find a more suitable diagnostic ratio, which also should be valid for these scenarios that are expected to be even more common at higher redshift (e.g. Alavi et al., 2014; Atek et al., 2014, 2015).
Following the previous argument, we show the [O IV]25.9/( [Ne II]12.8+ [Ne III]15.6) ratio in Fig 13b, since the sum of the two Neon lines would be a more reliable tracer of the star formation contribution also for dwarf galaxies. In this case, both dwarf and star forming galaxies have in average lower [O IV]25.9/( [Ne II]12.8+ [Ne III]15.6) ratios of , when compared to Seyfert galaxies (), although some overlap between dwarfs/starburst galaxies and Seyfert galaxies still remains in the range [O IV]25.9/( [Ne II]12.8+ [Ne III]15.6) to . The least square regression confirms the trend of increasing rations with increasing ,
| (2) | ||||
and the correlation coefficient improves (), with regard to the [O IV]25.9/ [Ne II]12.8 ratio.
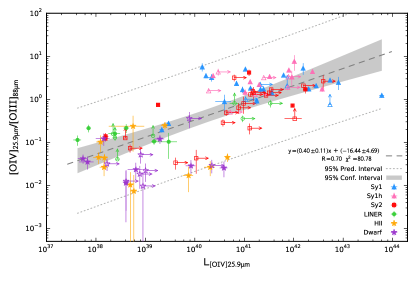
In Fig. 14a we show the ability of the [O IV]25.9/ [O III]88 line ratio to separate the contribution of AGN from starburst and dwarf galaxies in our sample, as a function of the [O IV] luminosity. The least squares regression is steeper when compared to the previous line ratios,
| (3) | ||||
with a correlation coefficient of . This is the best diagnostic ratio to distinguish Seyfert activity from star formation, with a minimum overlap between AGN dominated ratios ( [O IV]25.9/ [O III]88 ) and those dominated by starburst or dwarf galaxies. We note that dwarf galaxies are indistinguishable from starburst galaxies in this diagram, since their ionising spectra are not hard enough in the – range to produce a higher fraction of [O IV]25.9/ [O III]88. A few AGN are dominated by the starburst component, thus their [O IV]25.9/ [O III]88 ratios are in the same range as starburst galaxies. This will be discussed further in Section 5.4.2. LINERs appear to show a dual behaviour, with the three brightest sources in the Seyfert domain and the rest of them located in the starburst domain, with a line ratio of [O IV]25.9/ [O III]88 . This suggests that the [O III] line for the fainter LINERs in our sample might include an important contribution from their host galaxies.
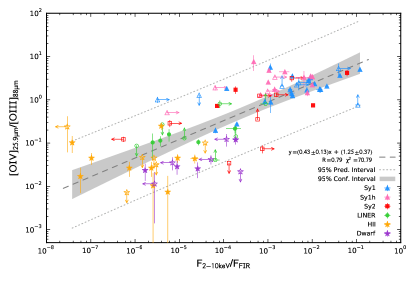
Finally, Fig. 14b shows the [O IV]25.9/ [O III]88 ratio vs the absorption-corrected X-ray – flux101010Collected from values published in the literature, see Table 6. Compton thick objects are labelled with “Y” in the CT column. to far-IR flux ratio, the latter measured as the continuum adjacent to the [C II] line (Table 6). X-ray to far-IR flux ratios for Compton thick objects appear as lower limits. This diagram confirms the behaviour observed in Fig. 14a by using an independent estimate of the accretion to the total energy output. S1 and S1h galaxies are dominated by the AGN, and thus show the highest values for both the X-ray to far-IR ratio and the [O IV]25.9/ [O III]88 line ratios. Starburst galaxies are very faint in the – range but bright far-IR emitters, and so they show low [O IV]25.9/ [O III]88 ratios. The least squares regression between both ratios is
| (4) | ||||
with a correlation coefficient of .
We note that most of the [O III] fluxes are extracted from the pixel array (), an area which is a factor of larger than the Spitzer/IRS-LH slit area (). A possible contamination by star formation in the host galaxy would decrease the measured ratio for the central AGN. To minimise this effect we have built the same diagrams using the fluxes extracted from PACS central pixel (), i.e. using an aperture smaller than the Spitzer/IRS slit for the [O IV] line. The variations in the line ratios are within the errors for most of the objects (see Fig. 17 and discussion in Appendix A), thus we discard a strong contamination by star formation in the [O III] line outside of the innermost for the galaxies in our sample.
5.4.2 A new AGN/star formation diagnostic
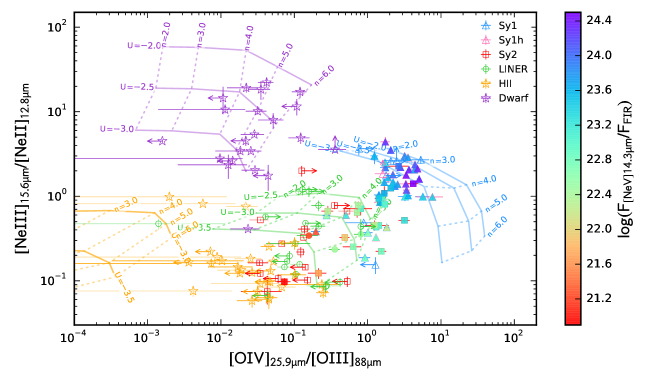
The global view of the AGN-starburst diagnostics that has been discussed in the previous Section is fully represented in the diagnostic diagrams of Figs 15a,b, which show the [Ne III]15.6/ [Ne II]12.8 (– or –) and the [S IV]10.5/ [S III]18.7 (– or –) ratios, respectively, vs the [O IV]25.9/ [O III]88 ratio (– or –). The filled symbols have been coloured based on their relative [Ne V] line flux to far-IR flux ratio, as a proxy of the relative AGN-to-far-IR luminosity. In the vertical axis, the Neon and Sulphur ratios probe the steepness of the ionising continuum between , just after the Lymann break (), and , before the He ii ionisation edge (). The stellar spectra are very sensitive to the metallicity in this range (Schaller et al., 1992; Mokiem et al., 2004), thus dwarf galaxies exhibit large [Ne III]15.6/ [Ne II]12.8 and [S IV]10.5/ [S III]18.7 ratios, even larger than Seyfert galaxies. Therefore, the vertical axis in Figs 15a,b is especially sensitive to the excitation originated by thermal processes. A large dropout in the spectra of dwarf galaxies occurs shortward of the He ii ionisation edge, thus their [O IV]25.9/ [O III]88 ratios are far from those exhibited by Seyfert galaxies, and very similar to the values found in starburst galaxies. LINERs are able to produce both higher [O IV]25.9/ [O III]88 and [Ne III]15.6/ [Ne II]12.8 ( [S IV]10.5/ [S III]18.7) line ratios with regard to starburst galaxies. The colour scale confirms that AGN with starburst-like [O IV]25.9/ [O III]88 line ratios are indeed galaxies in which the starburst contribution dominates both the far-IR and [O III] emission. The [O IV]25.9/ [O III]88 can be considered as a proxy for the relative contribution of the non-thermal photoionisation.
In Figs 15a,b, we compare the observed line ratios with our Cloudy photoionisation models for AGN (blue grid), LINERs (green grid), starburst galaxies (yellow grid), and dwarf galaxies (purple grid). From this comparison we conclude that:
-
1.
Observed Seyfert galaxies with the highest [O IV]25.9/ [O III]88 and [Ne III]15.6/ [Ne II]12.8 ratios (or [S IV]10.5/ [S III]18.7) are consistent with AGN models with densities in the to range and ionisation parameters in the to range.
-
2.
The transition from AGN dominated galaxies to star-forming galaxies defines a tail in the two diagrams that can be explained by: i) decreasing ionisation ratios (Fig. 15b); ii) decreasing power-law index, as shown by LINER models; or iii) increasing contribution to the [O III] line by star formation in the host galaxy, as show by the [Ne V] to far-IR flux ratio.
-
3.
Extreme dwarf galaxy models with very high and thus unlikely densities () are needed in order to reproduce the [O IV]25.9/ [O III]88 ratios measured in dwarf galaxies. These same ratios cannot be reproduced by the softer ionising spectra of starburst models, which underestimate the [O IV]25.9/ [O III]88 ratio by at least an order of magnitude even at the highest values of density and ionisation parameter. A solar metallicity starburst model with would increase the [Ne III]15.6/ [Ne II]12.8 line ratio by relative to the starburst model, but would not increase significantly the [O IV]25.9/ [O III]88 line ratio, since the contribution of the younger population does not increase considerably above .
-
4.
LINER ratios Figs 15a,b can be explained by a much steeper power law when compared to Seyfert nuclei with and , in agreement with the absence of the big blue bump in their spectra (Ho, 1996, 2008) and the predicted recession of the innermost part of the accretion disk in radiatively inefficient AGN (Narayan & Yi, 1995). Additionally, shocks might play an important role in the excitation of IR lines in LINERs, as shown by Sturm et al. (2006).
To reproduce the observed line ratios in dwarf galaxies for a gas with – would require a ionising spectrum in the – range harder than that provided by our Starburst99 model ( and ), which rely on current stellar population synthesis models. The lack of ionising photons above , known as the “ [Ne III]” problem, has been discussed in the literature (e.g. Sellmaier et al., 1996; Simón-Díaz & Stasińska, 2008; Zastrow et al., 2013), specially at low metallicities where high-excitation lines are particularly bright (Stasińska et al., 2015). However, Figs 15a,b prove that this disagreement is even more dramatic for starburst galaxies: the observations show that starburst galaxies are able to produce a much brighter [O IV] emission when compared to the models predictions. This line has an IP slightly above the He ii ionisation edge at , which cannot be produced by hot stars in the main sequence. [O IV] was previously detected in starburst galaxies by Lutz et al. (1998), and its origin has been associated to either X-ray emission produced by shocks in the stellar atmospheres or X-ray binaries (Sellmaier et al., 1996; Izotov et al., 2012; Stasińska et al., 2015), or to strong winds produced during the Wolf-Rayet (WR) phase of massive stars with – (Schaerer & Stasińska, 1999). The latter could be the case for dwarf galaxies, which usually show other WR spectral features like He ii emission, but it seems hardly the explanation for low-excitation starburst galaxies.
Starburst models with ages in the –, at the peak of the WR feedback contribution, are able to reproduce the observed [O IV]25.9/ [O III]88 ratios, but at the cost of over-predict [Ne III]15.6/ [Ne II]12.8 ratios by a factor of , due to their harder ionising spectra. Considering this, and the short duration of the WR phase in a the lifetime of a star forming region (), we consider unlikely the origin of high [O IV]25.9/ [O III]88 line ratios as caused by WR stars, specially in our samples of starburst galaxies. The similar [O IV]25.9/ [O III]88 ratios found for dwarf and starburst galaxies in our sample suggest that the strength of the ionising spectrum at in star-forming regions scales with the [O III] emission, as this line ratio does not vary with the metallicity of the stellar population.
High ionisation lines above are expected to be more sensitive to the contribution of shocks in a starburst galaxy than lower ionisation lines, since the stellar contribution is negligible above that value. Among the low ionisation and neutral lines, shocks can contribute significantly to the [O I] emission (Hollenbach & McKee, 1989), as shown by Lutz et al. (2003) for the case of NGC 6240, a LIRG merger. Furthermore, the [O I] line can be affected by self-absorption, as discussed in Section 5.1, and depends on the PDR temperature. All these contributions make it difficult to evaluate the possible effect of shocks in our starburst sample, and also limit the utility of this line in the diagnostic diagrams. We expect that the shock contribution to the mid- and far-IR lines in this study, if present, would be significant only for line ratios involving the [O IV], the [Ne V], and/or the [O I] lines.
5.5 Metallicity
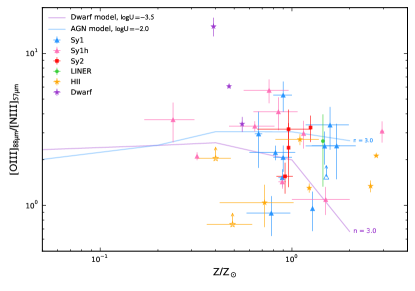
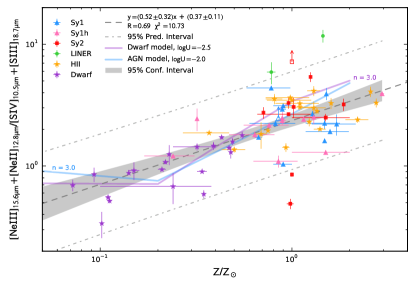
As mentioned in Sect. 1, to use diagnostics based on mid- and far-IR lines is a very useful tool for the study of galaxies at high-redshift. Of special interest are the metallicity-sensitive line ratios proposed by Nagao et al. (2011, 2012), which allow metallicity determinations in dust-embedded sources, e.g. ULIRGs (Rigopoulou 2015 priv. comm.), where optical line ratios cannot be measured reliably due to the high extinction. In this Section we test two metallicity-sensitive diagnostics by comparing the IR fine-structure line ratios with metallicity estimates based on optical lines: the [O III]88/ [N III]57 line ratio (Fig. 16a), proposed by Nagao et al. (2011), and a new diagram based on the ( [Ne III]15.6+ [Ne II]12.8 )/( [S IV]10.5+ [S III]18.7) ratio (Fig. 16b), presented here for the first time.
Most of the optical metallicities shown in Figs 16a,b were compiled from the literature and are referenced in Table 6. For a few objects without published metallicities but with published optical line fluxes ( [N II], [O II], [O III], H, H), we derived the optical metallicities using the Pettini & Pagel (2004) and Pilyugin & Thuan (2005) calibrations. The blue lines show the metallicity dependence predicted by our Cloudy AGN models for and (blue-solid line). The purple-solid lines correspond to the dwarf galaxy models with and .
Fig. 16a shows a large dispersion with the observed [O III]88/ [N III]57 ratios distributed around the model predictions. No clear trend is found for the individual populations, although the low number of star-forming galaxies with observations of both lines (three dwarfs plus seven starburst galaxies) limits the assessment of this diagnostic. Our AGN models show a relatively constant ratio, while dwarf galaxy models show a decreasing ratio at super-solar metallicities, in agreement with the models in Nagao et al. (2011). This is related to the softening of the ionising spectrum at higher metallicities, i.e. the [O III]88/ [N III]57 in our models is mainly driven by the metallicity of the ionising stellar population, instead of the metallicity of the ionised gas. Continuous starburst models (not shown) show a behaviour very similar to that of dwarf galaxy models, with a slightly flatter dependency on metallicity. The dispersion of the observed ratios could be explained by different density and ionisation values, which should be determined independently in order to use the [O III]88/ [N III]57 ratio as a diagnostic for metallicity.
The ( [Ne III]15.6+ [Ne II]12.8)/( [S IV]10.5+ [S III]18.7) ratio in Fig. 16b shows a clear correlation () with optical metallicities, of the form
| (5) | ||||
If only the dwarf and starburst galaxies are considered, the correlation is maintained with a higher correlation coefficient of . As shown in Sect. 5.4, both Neon and Sulphur ratios are very sensitive to the metallicity-dependent excitation of the stellar population ionising the gas. Thus, the ( [Ne III]15.6+ [Ne II]12.8)/( [S IV]10.5+ [S III]18.7) ratio should cancel most of this dependency since [Ne II] ( [S III]) will turn into [Ne III] ( [S IV]) with increasing ionisation. The dependency of the ( [Ne III]15.6+ [Ne II]12.8)/( [S IV]10.5+ [S III]18.7) ratio could be explained by the depletion of Sulphur on dust grains (e.g. Verma et al., 2003), which causes an increasing Sulphur deficiency with increasing metallicity. In this scenario, the total ( [S IV]10.5+ [S III]18.7) emission does not change significantly, since depletion maintains the Sulphur abundance roughly constant with increasing metallicity (see fig. 8 in Verma et al., 2003), while the total ( [Ne III]15.6+ [Ne II]12.8) increases with the Neon abundance. In order to test this effect, we modified our Cloudy models by assuming a constant Sulphur abundance above , while the Neon abundance increases with the metallicity. Instant starburst models (purple-solid line in Fig. 16), equivalent to dwarf galaxy models at , show a similar trend as that shown by the observations, i.e. the ( [Ne III]15.6+ [Ne II]12.8)/( [S IV]10.5+ [S III]18.7) ratio increases with metallicity due to the Sulphur depletion. Seyfert galaxies show line ratios in agreement with those of starburst galaxies, as well as AGN models (blue-solid line). This suggests that the ( [Ne III]15.6+ [Ne II]12.8)/( [S IV]10.5+ [S III]18.7) ratio is a robust extinction-free metallicity tracer for both AGN and starburst galaxies. This is very important for the study of the dusty obscured galaxy evolution at redshift , at the peak of the star formation and black hole accretion activity, that will be addressed by future space missions, e.g. SPICA (Swinyard et al., 2009).
6 Summary and Conclusions
In this work we have presented the complete database of far-IR fine-structure lines observed by Herschel/PACS during its 3.5 years operational life for 170 AGN-classified galaxies in the Véron-Cetty & Véron (2010) catalog. In order to complete the full mid- to far-IR spectra in the – range we collected published fine-structure line fluxes measured with Spitzer/IRS and Herschel/SPIRE. As a comparison sample, we compiled an equivalent database for starburst galaxies extracted from Bernard-Salas et al. (2009) and Goulding & Alexander (2009). Additionally, we included 43 dwarf galaxies from the Dwarf Galaxy Survey (Madden et al., 2013; Cormier et al., 2015), in order to probe a more extreme star formation environment at low metallicities.
The photoionisation code Cloudy has been used to reproduce the physical conditions of the gas exciting the mid- to far-IR fine-structure lines. We produced four models using different ionising spectra: a pure AGN model (; ), a LINER model (), a starburst galaxy model ( continuum star formation with ), and a dwarf galaxy model ( instant starburst with ). Calculations for the starburst and the dwarf galaxy models have been extended down to in order to include the PDR emission region.
The main results of this study are:
-
•
The [O I]145/63 line ratio, used as temperature tracer in the – range for the neutral gas in the PDR, does not show a clear correlation with the ionisation nor the density of the ionised gas, traced by the [S IV]10.5/ [S III]18.7 and the [S III]33.5/18.7 ratios, respectively. High [O I]145/63 ratios of are found in objects with self-absorption in the [O I] line profile.
-
•
The [C I]609/371 line ratio, sensitive to the temperature in the PDR (–), show similar median values for AGN () and starburst galaxies (). This is much higher than the ratios predicted from XDR simulations (–), suggesting that the neutral carbon lines in our AGN sample are likely dominated by relatively low-density PDR emission originated in the ISM of the host galaxies.
-
•
The density stratification found in S15 is confirmed here with 155 pairs of lines from [N II]205/122, [S III]33.5/18.7, [O III]88/52, and [Ne V]24.3/14.3 line ratios, plus 93 upper limits. Both the least squares fit and the Kaplan-Meier residuals fit are consistent with an increasing gas density – measured by the line ratios – with the ionisation potential (IP) of the transition. This suggests that harder radiation fields are traced by the higher density gas found in the innermost part of the NLR.
-
•
The line ratios of S1 and S1h are always very similar, suggesting that both AGN types are indistinguishable from an IR perspective, thus S1h correspond to optically obscured S1 (e.g. Tommasin et al., 2010).
-
•
The [C II]158/ [N II]122,205 line ratios, sensitive to the relative contributions of the PDR and the low excitation photoionised gas, suggest a major contribution () of PDR emission to the [C II] line. The observed ratios [C II]158/ [N II]122,205 are in agreement with the simulations stopped at , which include PDR emission. Values lower than those observed are predicted for pure photoionised gas (). An additional correlation of [C II]158/ [N II]122,205 with ionisation potential (traced by [Ne III]15.6/ [Ne II]12.8) might also be present, as [N II] emission decreases in favour of [N III].
-
•
The inclusion in the diagnostic diagrams of dwarf galaxies demonstrates that classical line ratios such as [O IV]25.9/ [Ne II]12.8 fail as AGN/starburst tracers at low metallicities. Instead, the [O IV]25.9/ [O III]88 ratio is an excellent tracer to discriminate between non-thermal excitation in AGN and thermal ionisation produced by any kind of star formation activity. Since it probes a relatively hard range of the spectrum (–, –) this line ratio is ideal for composite objects with extreme star formation bursts and mergers involving a chemically unevolved companion, a scenario that seems to be more common with increasing redshift. Alternatively, the [O IV]25.9/( [Ne III]15.6+ [Ne II]12.8) ratio can also be used as a proxy for the relative AGN to starburst contribution.
-
•
A new AGN/star formation diagnostic diagram is proposed, based on the [O IV]25.9/ [O III]88 and [Ne III]15.6/ [Ne II]12.8 (or alternatively [S IV]10.5/ [S III]18.7). The [O IV]25.9/ [O III]88 ratio is sensitive to the relative contributions from AGN and star formation, while the [Ne III]15.6/ [Ne II]12.8 ratio ( [S IV]10.5/ [S III]18.7) is sensitive to the ionisation, mostly driven by the metallicity in the stellar population. The combination of these line ratios allows to clearly separate the different populations in the diagram, i.e. AGN, dwarf galaxies, and starburst galaxies, and provides an extinction-free diagnostic ideal for future mid- and far-IR spectroscopic surveys.
-
•
Photoionisation by current stellar atmosphere models cannot reproduce the observed [O IV]25.9/ [O III]88 line ratios due to the lack of predicted photons above the He ii ionisation edge (, ). Furthermore, both dwarf and starburst galaxies show similar [O IV]25.9/ [O III]88 line ratios in the – range, with no apparent dependency on the metallicity of the stellar population. An improved treatment of stellar atmosphere models above will be necessary in order to explain the observed line ratios, e.g. by including the contribution of shocks and non-thermal emission in the EUV.
-
•
LINERs show intermediate line ratios of [O IV]25.9/ [O III]88, [Ne III]15.6/ [Ne II]12.8, and [S IV]10.5/ [S III]18.7, between Seyfert and starburst galaxies. These line ratios can be explained by assuming a softer UV spectrum with a slope of , in line with the receding accretion disc scenario expected at low-luminosities and/or low-accretion efficiencies.
-
•
The ( [Ne III]15.6+ [Ne II]12.8)/( [S IV]10.5+ [S III]18.7) line ratio is sensitive to the gas metallicity for AGN, starburst and dwarf galaxies, this is confirmed by the models including the effect of Sulphur depletion. Thus, this ratio is proposed as a powerful extinction-free metallicity tracer, ideal for dust regions and obscured objects where optical determinations are not possible. Future facilities, such as JWST for the Local Universe and SPICA along Cosmic history, at the peak of star formation and black hole accretion activity (), will be able to trace the build up of heavy elements during galaxy evolution.
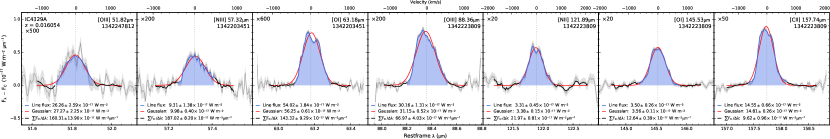
Fig. Set2. Extracted sprectra from the spaxel array for AGN and starburst galaxies.
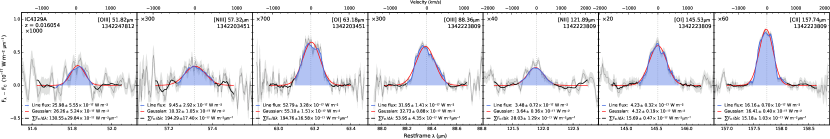
Fig. Set3. Extracted sprectra from the spaxel array for AGN and starburst galaxies.
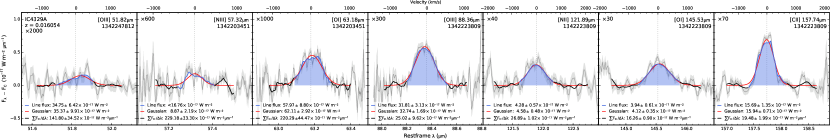
Fig. Set4. Spectral maps obtained from the spaxel array for the far-IR fine structure lines observed in the samples of AGN and starburst galaxies.
| Line | I.P. | Spec. Res. | Ang. Res. | # of AGN | # of SB | # of DW | ||||
|---|---|---|---|---|---|---|---|---|---|---|
| (m) | (GHz) | (eV) | (K) | () | (km s-1) | (arcsec) | ||||
| [S IV]2P3/2–2P1/2 | 10.51 | 28524.50 | 34.79 | 1369 | 112 | 19 | 30 | |||
| [Ne II]2P1/2–2P3/2 | 12.81 | 23403.00 | 21.56 | 1123 | 172 | 20 | 21 | |||
| [Ne V]3P2–3P1 | 14.32 | 20935.23 | 97.12 | 1892 | 115 | 0 | 1 | |||
| [Ne III]3P1–3P2 | 15.56 | 19266.87 | 40.96 | 925 | 172 | 19 | 29 | |||
| [S III]3P2–3P1 | 18.71 | 16023.11 | 23.34 | 769 | 129 | 20 | 26 | |||
| [Ne V]3P1–3P0 | 24.32 | 12326.99 | 97.12 | 596 | 90 | 0 | 0 | |||
| [O IV]2P3/2–2P1/2 | 25.89 | 11579.47 | 54.94 | 555 | 147 | 12 | 17 | |||
| [S III]3P1–3P0 | 33.48 | 8954.37 | 23.34 | 430 | 110 | 20 | 21 | |||
| [Si II]2P3/2–2P1/2 | 34.81 | 8612.25 | 8.15 | 413 | aaCritical density for collisions with hydrogen atoms., | 100 | 20 | 20 | ||
| [O III]3P2–3P1 | 51.81 | 5787.57 | 35.12 | 441 | 9.4bbThe beam size for Herschel/PACS is dominated by the spaxel size () below . | 19 | 1 | 0 | ||
| [N III]2P3/2–2P1/2 | 57.32 | 5230.43 | 29.60 | 251 | 9.4 | 32 | 5 | 3 | ||
| [O I]3P2–3P1 | 63.18 | 4744.77 | – | 228 | aaCritical density for collisions with hydrogen atoms. | 9.4 | 115 | 20 | 31 | |
| [O III]3P1–3P0 | 88.36 | 3393.01 | 35.12 | 163 | 9.4 | 83 | 16 | 38 | ||
| [N II]3P2–3P1 | 121.90 | 2459.38 | 14.53 | 118 | 9.4 | 79 | 17 | 8 | ||
| [O I]3P1–3P0 | 145.52 | 2060.07 | – | 98 | aaCritical density for collisions with hydrogen atoms. | 10.3 | 66 | 8 | 12 | |
| [C II]2P3/2–2P1/2 | 157.74 | 1900.54 | 11.26 | 91 | ,aaCritical density for collisions with hydrogen atoms. | 11.2 | 159 | 17 | 41 | |
| [N II]3P1–3P0 | 205.3 | 1460.27 | 14.53 | 70 | 60 | 13 | 2 | |||
| [C I]3P2–3P1 | 370.37 | 809.44 | – | 38.9 | aaCritical density for collisions with hydrogen atoms. | 59 | 13 | 1 | ||
| [C I]3P1–3P0 | 609.7 | 491.70 | – | 23.6 | aaCritical density for collisions with hydrogen atoms. | 32 | 12 | 0 |
Note. — The columns correspond to the central wavelength, frequency, ionisation potential, excitation temperature, critical density, spectral and spatial resolution of the data presented in this work, and the number of AGN, starburst, and dwarfs galaxies with line detections above rms. Critical densities and excitation temperatures from: Launay & Roueff (1977); Tielens & Hollenbach (1985); Greenhouse et al. (1993); Sturm et al. (2002); Cormier et al. (2012); Farrah et al. (2013).
| Line Ratio | Diagnostic | Parameter range |
|---|---|---|
| [N II]205/122 | Density of ionised gas | – |
| [O III]88/52 | Density of ionised gas | – |
| [S III]33.5/18.7 | Density of ionised gas | – |
| [Ne V]24.3/14.3 | Density of ionised gas | – |
| [S IV]10.5/ [S III]18.7 | Ionisation parameter | – |
| [O III]88/ [O I]63 | Ionised/neutral gas ratio | – |
| [O III]88/ [N II]122 | Ionisation parameter | – |
| [Ne III]15.6/ [Ne II]12.8 | Ionisation parameter | – |
| [O IV]25.9/ [O III]88 | Ionisation parameter, AGN/Starburst | – |
| [O I]145/63 | Temperature of neutral gas (PDR) | – |
| [C I]609/371 | Temperature of neutral gas (PDR) | – |
| [C II]158/ [O I]63 | PDR density | – |
| [C II]158/ [N II]122 | PDR/low-excitation ionised gas contribution | – |
| [N II]122/ [C I]371 | Low-excitation ionised gas/neutral gas contribution | – |
| [N II]122/ [C I]371 | Low-excitation ionised gas/neutral gas contribution | – |
| [O IV]25.9/ [Ne II]12.8 | AGN/Starburst contribution | – |
| [O IV]25.9/( [Ne II]12.8+ [Ne III]15.6) | AGN/Starburst contribution | – |
| [O III]88/ [N III]57 | Ionisation parameter and metallicity | – |
| ( [Ne II]12.8+ [Ne III]15.6)/( [S III]18.7+ [S IV]10.5) | Metallicity | – |
| # | Name | R.A. (2000) | Dec. (2000) | Dist. | RefDaaReferences for redshift-independent distances: (1) Adamo et al. (2012); (2) Cortés et al. (2008); (3) Dolphin & Kennicutt (2002). | Type | CT | RefXbbReferences for X-ray absorption-corrected luminosities: (1) Awaki et al. (2000); (2) Ballo et al. (2011); (3) Bassani et al. (1999). | RefZccReferences for optical metallicities: (1) Contini (2012); (2) Davis et al. (2013); (3) Dors et al. (2015). | Alt. | ||||||
|---|---|---|---|---|---|---|---|---|---|---|---|---|---|---|---|---|
| (h:m:s) | (d:m:s) | (Mpc) | ( | () | () | () | () | |||||||||
| AGN sample | ||||||||||||||||
| 1 | Mrk334 | 00:03:09.6038 | +21:57:36.8064 | 0.021945 | 96.6 | 29 | S1.8 | 41.16 | 41.09 | 41.22 | UGC00006 | |||||
| 2 | Mrk938 | 00:11:06.5412 | -12:06:27.6624 | 0.019617 | 81.8 | S2 | 42.33 | N | 25 | 40.24 | 39.47 | 39.72 | NGC17, NGC34 | |||
| 3 | IRAS00182-7112 | 00:20:34.7210 | -70:55:26.2488 | 0.326999 | 1656.9 | S2 | 43.90 | Y | 44 | 41.63 | 41.82 | 42.06 | ||||
Starburst sample 1 NGC253 00:47:33.0727 -25:17:18.9960 0.000811 3.66 11 H ii 39.96 N 43 38.52 39.07 39.39 0.720.30 13 Sculptor 2 M74 01:36:41.7384 +15:47:00.8592 0.002192 9.46 23 H ii 38.12 26 37.21 37.69 37.14 0.46 8 NGC628 3 NGC891 02:22:32.8464 +42:20:52.6740 0.001761 10.8 31 H ii 40.46 67 36.75 37.94 38.16 1.6 6 UGC01831 Dwarf sample 1 HS0017+1055 00:20:21.4000 +11:12:21.0000 0.018846 78.6 Dwarf 0.090.02 10 2 Haro11 00:36:52.4544 -33:33:16.7652 0.020598 86.0 Dwarf 40.98 N 23 39.67 40.59 0.470.01 10 3 HS0052+2536 00:54:56.3647 +25:53:08.0052 0.045385 193.0 Dwarf 40.52 40.14 0.240.14 10 No lines detected by PACS 1 3C33 01:08:52.8818 +13:20:14.1684 0.0597 256.6 S1h 43.86 N 64 41.20 41.10 41.80 0.89 3 4C+13.07 2 PG1114+445 11:17:06.3950 +44:13:33.2076 0.143862 655.5 S1.0 43.95 N 51 41.94 42.04 3 ESO506-G27 12:38:54.5820 -27:18:28.1376 0.025024 104.8 S2 43.06 N 70 40.70 AM1236-270
Note. — The columns correspond to the galaxy name, coordinates taken from 2MASS Point Source Catalog, redshift, redshift-independent distance, reference for the distance, spectral type, absorption-corrected – luminosity, Compton thick (Y: yes; N: no), reference for the X-ray luminosity, [Ne V], [Ne V], and [O IV] luminosities, metallicity based on optical lines, reference for the metallicity, and alternative name(s). Table 6 is published in its entirety in the machine readable format. A portion is shown here for guidance regarding its form and content.
Starburst galaxies 1 NGC253 389.21183.61 599.54178.33 2947.685.7 625.2153.54 802.7228.14 389.6130.99 3392.722.9 33 2 M74 20.5810.84 14.16 5.852.70 43.121.82 33 3 NGC891 85.5411.08 73.282.19 33 No lines detected by PACS 1 3C33 1.54 33 2 PG1114+445 3.06 1.3 33 3 ESO506-G27 0.96 33
Note. — Far-IR fine structure line fluxes for the samples of AGN and starburst galaxies, from Herschel PACS observations. Table 6 is published in its entirety in the machine readable format. A portion is shown here for guidance regarding its form and content.
Starburst galaxies 1 NGC253 0.0080.004 0.0070.002 0.0390.001 0.0130.001 0.0370.001 0.0310.003 0.3740.003 33 2 M74 0.0170.009 0.0140.006 0.4300.026 33 3 NGC891 0.0350.005 0.0800.002 33 No lines detected by PACS 1 3C33 0.352 33 2 PG1114+445 33 3 ESO506-G27 0.051 33
Note. — Equivalent width values derived for the far-IR fine structure lines observed by Herschel/PACS. Table 6 is published in its entirety in the machine readable format. A portion is shown here for guidance regarding its form and content.
Starburst galaxies 1 NGC253 450.2314.16 936.358.24 1013.05.8 1206.15.4 1071.43.2 874.914.07 753.273.54 33 2 M74 16.190.91 20.790.25 8.320.36 33 3 NGC891 32.971.16 45.680.27 35128aaHerschel/PACS continuum at taken from Hughes et al. (2014). 33 No lines detected by PACS 1 3C33 0.310.08 33 2 PG1114+445 0.34 0.25 33 3 ESO506-G27 1.340.05 33
Note. — Continuum flux values derived for the far-IR fine structure lines observed by Herschel/PACS. Table 6 is published in its entirety in the machine readable format. A portion is shown here for guidance regarding its form and content.
Starburst galaxies 1 NGC253 142.013.0 202.310.8 145.40.8 125.91.5 169.01.2 148.92.2 136.80.2 33 2 M74 114.014.1 260.4134.8 97.91.4 33 3 NGC891 101.83.8 159.41.8 33
Note. — Sigma values derived from the Gaussian fit to the profile of the far-IR fine structure lines observed by Herschel/PACS. Table 6 is published in its entirety in the machine readable format. A portion is shown here for guidance regarding its form and content.
Starburst galaxies 1 NGC253 10.5 2832.364.2 20.5 204.69.6 666.414.9 73.36 154.726.9 1538.030.1 2412.048.0 HR 5 2 M74 0.22 2.310.36 0.15 0.08 0.23 0.46 0.13 12.350.94 4.780.40 HR 20,47 3 NGC891 0.88 8.570.78 0.04 0.840.07 1.990.17 0.62 1.03 10.742.02 28.110.92 HR 20,47 No lines detected by PACS 1 3C33 1.20.1 3.90.2 2.00.3 5.30.2 2.50.4 1.60.2 8.10.2 LR 24 2 PG1114+445 0.900.18 1.53 1.70 2.150.49 LR 47 3 ESO506-G27 1.02 5.181.25 6.020.89 1.991.12 3.800.71 LR 47,35
Note. — Mid-IR fine structure line fluxes for the galaxies in our sample from Spitzer/IRS observations. Table 6 is published in its entirety in the machine readable format. A portion is shown here for guidance regarding its form and content.
Note. — Line fluxes for nitrogen [N II] and neutral carbon [C I] lines in our sample, collected from Herschel/SPIRE and ground-based observations published in the literature. Table 6 is published in its entirety in the machine readable format. A portion is shown here for guidance regarding its form and content.
Note. — Density determinations from fine-structure emission lines from Herschel/PACS and SPIRE, and Spitzer/IRS observations. Table 6 is published in its entirety in the machine readable format. A portion is shown here for guidance regarding its form and content.
Starburst galaxies 1 NGC253 478.9 408.33121.33 1409.5470.02 332.5448.72 413.1141.42 181.2213.58 1277.4618.81 c 389.21183.61 599.54178.33 2947.6285.69 625.2153.54 802.7228.14 389.6130.99 3392.6922.89 33 438.08169.61 626.13150.87 3214.7094.83 678.2047.67 824.3024.25 393.9136.99 3985.1225.32 55 2 M74 10.632.16 4.55 3.38 6.310.93 c 20.5810.84 14.16 5.852.70 43.121.82 33 46.58 10.16 12.602.57 80.182.35 55 3 NGC891 18.826.38 19.350.80 c 85.5411.08 73.282.19 33 139.0310.01 103.165.08 55 No lines detected by PACS 1 3C33 0.7 c 1.54 33 1.54 55 2 PG1114+445 1.71 0.9 c 3.06 1.3 33 5.85 2.18 55 3 ESO506-G27 0.96 c 0.96 33 1.9 55
Note. — Far-infrared fine structure line fluxes of the active, starburst, and dwarf galaxies observed by Herschel/PACS, extracted from the central pixel, the array, and the full array. Note that no point-source correction has been applied to the fluxes. Table 6 is published in its entirety in the machine readable format. A portion is shown here for guidance regarding its form and content.
Appendix A Aperture effects
In this section we test the possible aperture effects between Herschel/PACS and ISO/LWS line flux measurements reported in Brauher et al. (2008). To illustrate this we show in Fig. 17 the comparison of PACS vs LWS measurements for the [C II] line, which is the worst case scenario in terms of the contribution of the extended emission from the galaxy, as can be seen in the line maps of Fig. Set 4. For a subsample of 45 AGN and starburst galaxies with both PACS and LWS [C II] measurements, we find a median value and a median absolute deviation of . Despite the smaller aperture involved, PACS fluxes are higher than LWS fluxes, which suggests that most of the emission in our sample is compact within the spaxel aperture ().
On the other hand, in order to show the impact of using different apertures in line ratios involving Spitzer/IRS and Herschel/PACS lines, we reproduce in Fig. 18 the same diagram shown in Fig. 15, but using only central spaxel fluxes for the [O III] line. In Fig. 15 the [O IV] is extracted from a aperture, that is a factor of smaller when compared to the [O III] aperture (), thus extended [O III] emission could lower the line [O IV]25.9/ [O III]88 line ratio. Fig. 18 shows that, by using central spaxel fluxes in [O III], thus an aperture times smaller than in the [O IV] line, the variations in the diagram with respect to Fig. 15 are within the errors for the majority of the galaxies. Therefore, we conclude that aperture effects in this study are not relevant and do not affect our results.
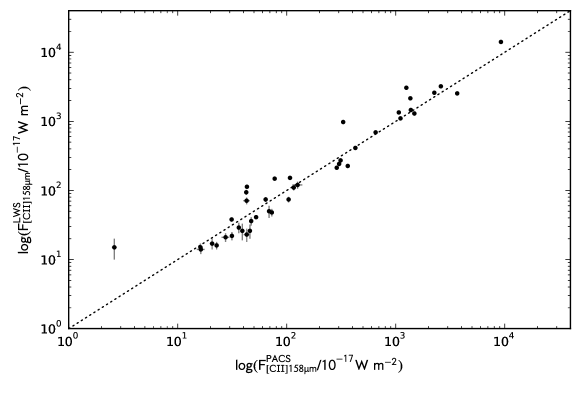
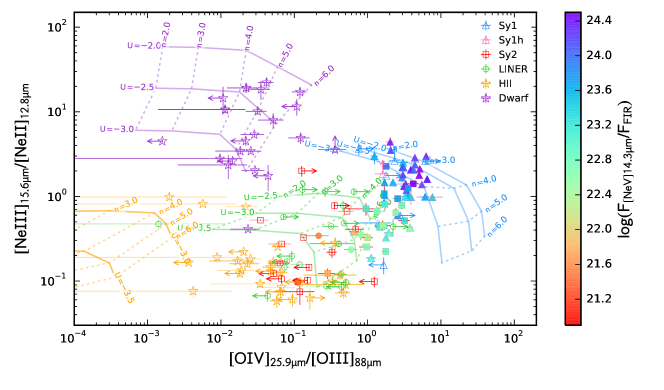
References
- Abel et al. (2007) Abel, N.P., Sarma, A.P., Troland, T.H., & Ferland, G.J. 2007, ApJ, 662, 1024
- Adamo et al. (2012) Adamo, A., Smith, L.J., Gallagher, J.S., et al. 2012, MNRAS, 426, 1185
- Alavi et al. (2014) Alavi, A., Siana, B., Richard, J., et al. 2014, ApJ, 780, 143
- Alexander et al. (2000) Alexander, D.M., Heisler, C.A., Young, S., et al. 2000, MNRAS, 313, 815
- Alexander et al. (1999) Alexander, T., Sturm, E., Lutz, D., et al. 1999, ApJ, 512, 204
- Alonso-Herrero et al. (2012) Alonso-Herrero, A., Pereira-Santaella, M., Rieke, G.H., & Rigopoulou, D. 2012, ApJ, 744, 2
- Armus et al. (2004) Armus, L., Charmandaris, V., Spoon, H. W. W. et al. 2004, ApJS, 154, 178
- Armus et al. (2006) Armus, L., Bernard-Salas, J., Spoon, H.W.W., et al. 2006, ApJ, 640, 204
- Armus et al. (2007) Armus, L., Charmandaris, V., Bernard-Salas, J. et al. 2007, ApJ, 656, 148
- Arp (1966) Arp, H. 1966, ApJS, 14, 1
- Arp & Madore (1987) Arp, H.C., & Madore, B. 1987, Cambridge University Press, 1987
- Atek et al. (2014) Atek, H., Kneib, J.-P., Pacifici, C., et al. 2014, ApJ, 789, 96
- Atek et al. (2015) Atek, H., Richard, J., Kneib, J.-P., et al. 2015, ApJ, 800, 18
- Astropy Collaboration et al. (2013) Astropy Collaboration, Robitaille, T.P., Tollerud, E.J., et al. 2013, A&A, 558, A33
- Awaki et al. (2000) Awaki, H., Ueno, S., Taniguchi, Y., & Weaver, K.A. 2000, ApJ, 542, 175
- Baldwin et al. (1981) Baldwin, J. A., Phillips, M. M., Terlevich R., 1981, PASP, 93, 5
- Ballo et al. (2011) Ballo, L., Piconcelli, E., Vignali, C., & Schartel, N. 2011, MNRAS, 415, 2600
- Bakes & Tielens (1994) Bakes, E.L.O., & Tielens, A.G.G.M. 1994, ApJ, 427, 822
- Bassani et al. (1999) Bassani, L., Dadina, M., Maiolino, R., et al. 1999, ApJS, 121, 473
- Baum et al. (2010) Baum, S.A., Gallimore, J.F., O’Dea, C.P., et al. 2010, ApJ, 710, 289
- Beck et al. (2007) Beck, S.C., Turner, J.L., & Kloosterman, J. 2007, AJ, 134, 1237
- Beirão et al. (2012) Beirão, P., Armus, L., Helou, G., et al. 2012, ApJ, 751, 144
- Bernard-Salas et al. (2009) Bernard-Salas, J., Spoon, H. W. W., Charmandaris, V. et al. 2009, ApJS, 184, 230
- Bianchi et al. (2005) Bianchi, S., Guainazzi, M., Matt, G., et al. 2005, A&A, 442, 185
- Bianchi et al. (2008) Bianchi, S., Chiaberge, M., Piconcelli, E., Guainazzi, M., & Matt, G. 2008, MNRAS, 386, 105
- Bianchi et al. (2009) Bianchi, S., Guainazzi, M., Matt, G., Fonseca Bonilla, N., & Ponti, G. 2009, A&A, 495, 421
- Brandl et al. (2006) Brandl, B.R., Bernard-Salas, J., Spoon, H. W. W. et al. 2006, ApJ, 653, 1129
- Brandt et al. (1997) Brandt, W.N., Fabian, A.C., Takahashi, K., et al. 1997, MNRAS, 290, 617
- Brandl et al. (2009) Brandl, B.R., Snijders, L., den Brok, M., et al. 2009, ApJ, 699, 1982
- Brauher et al. (2008) Brauher, J.R., Dale, D.A., Helou, G. 2008, ApJS, 178, 280
- Bressan et al. (2006) Bressan, A., Panuzzo, P., Buson, L., et al. 2006, ApJ, 639, L55
- Brightman & Nandra (2011) Brightman, M., & Nandra, K. 2011, MNRAS, 413, 1206
- Brorby et al. (2014) Brorby, M., Kaaret, P., & Prestwich, A. 2014, MNRAS, 441, 2346
- Cappi et al. (1999) Cappi, M., Bassani, L., Comastri, A., et al. 1999, A&A, 344, 857
- Cappi et al. (2006) Cappi, M., Panessa, F., Bassani, L., et al. 2006, A&A, 446, 459
- Cisternas et al. (2013) Cisternas, M., Gadotti, D.A., Knapen, J.H., et al. 2013, ApJ, 776, 50
- Clegg et al. (1996) Clegg, P.E., Ade, P.A.R., Armand, C. et al. 1996, A&A, 315, L38
- Contini (2012) Contini, M. 2012, MNRAS, 426, 719
- Cormier et al. (2012) Cormier, D., Lebouteiller, V., Madden, S.C., et al. 2012, A&A, 548, A20
- Cormier et al. (2015) Cormier, D., Madden, S.C., Lebouteiller, V., et al. 2015, A&A, 578, A53
- Cortés et al. (2008) Cortés, J.R., Kenney, J.D.P., & Hardy, E. 2008, ApJ, 683, 78
- Dadina (2007) Dadina, M. 2007, A&A, 461, 1209
- Dale et al. (2009) Dale, D.A., Smith, J.D.T., Schlawin, E.A., et al. 2009, ApJ, 693, 1821
- Dale et al. (2012) Dale, D.A., Aniano, G., Engelbracht, C.W., et al. 2012, ApJ, 745, 95
- Dasyra et al. (2008) Dasyra, K.M., Ho, L.C., Armus, L., et al. 2008, ApJ, 644, L9
- Dasyra et al. (2011) Dasyra, K.M., Ho, L.C., Netzer, H., et al. 2011, ApJ, 740, 94
- Davis et al. (2013) Davis, T.A., Bayet, E., Crocker, A., Topal, S., & Bureau, M. 2013, MNRAS, 433, 1659
- de Graauw et al. (1996) de Graauw, T. Haser, L.N., Beintema, D.A. et al. 1996, A&A, 315, 49
- Deo et al. (2006) Deo, R.P., Crenshaw, D.M., & Kraemer, S.B. 2006, AJ, 132, 321
- Deo et al. (2007) Deo, R.P., Crenshaw, D.M., Kraemer, S.B., et al. 2007, ApJ, 671, 124
- Diamond-Stanic et al. (2009) Diamond-Stanic, A.M., Rieke, G.H., & Rigby, J.R. 2009, ApJ, 698, 623
- Dicken et al. (2012) Dicken, D., Tadhunter, C., Axon, D., et al. 2012, ApJ, 745, 172
- Dixon & Joseph (2011) Dixon, T.G. & Joseph, R.D., 2011, ApJ, 740, 99
- Dolphin & Kennicutt (2002) Dolphin, A.E., & Kennicutt, R.C., Jr. 2002, AJ, 123, 207
- Donahue et al. (2011) Donahue, M., de Messières, G.E., O’Connell, R.W., et al. 2011, ApJ, 732, 40
- Donato et al. (2004) Donato, D., Sambruna, R.M., & Gliozzi, M. 2004, ApJ, 617, 915
- Donato et al. (2005) Donato, D., Sambruna, R.M., & Gliozzi, M. 2005, A&A, 433, 1163
- Dopita et al. (2015) Dopita, M.A., Ho, I.-T., Dressel, L.L., et al. 2015, ApJ, 801, 42
- Dors et al. (2015) Dors, O.L., Cardaci, M.V., Hägele, G.F., et al. 2015, MNRAS, 453, 4102
- Dreyer (1888) Dreyer, J.L.E. 1888, MmRAS, 49, 1
- Dreyer (1895) Dreyer, J.L.E. 1895, MmRAS, 51, 185
- Dudik et al. (2007) Dudik, R.P., Weingartner, J.C., Satyapal, S., et al. 2007, ApJ, 664, 71
- Dudik et al. (2009) Dudik, R.P., Satyapal, S., & Marcu, D. 2009, ApJ, 691, 1501
- Edge et al. (1959) Edge, D.O., Shakeshaft, J.R., McAdam, W.B., Baldwin, J.E., & Archer, S. 1959, MmRAS, 68, 37
- Elvis et al. (2004) Elvis, M., Risaliti, G., Nicastro, F., et al. 2004, ApJ, 615, L25
- Engelbracht et al. (2008) Engelbracht, C.W., Rieke, G.H., Gordon, K.D., et al. 2008, ApJ, 678, 804
- Evans & Dopita (1987) Evans, I.N., & Dopita, M.A. 1987, ApJ, 319, 662
- Fairall (1977) Fairall, A.P. 1977, MNRAS, 180, 391
- Farrah et al. (2007) Farrah, D., Bernard-Salas, J., Spoon, H. W. W. et al. 2007, ApJ, 667, 149
- Farrah et al. (2013) Farrah, D. Lebouteiller, V., Spoon, H. W. W. et al.. 2013, ApJ, 776, 38
- Ferland et al. (2013) Ferland, G. J., Porter, R. L., van Hoof, P. A. M. et al. 2013, RMxAA, 49, 137
- Fernández-Ontiveros et al. (2012) Fernández-Ontiveros, J.A., Prieto, M.A., Acosta-Pulido, J.A., & Montes, M. 2012, JPhCS, 372, 012006
- Ferrarese et al. (2000) Ferrarese, L., Mould, J.R., Kennicutt, R.C., Jr., et al. 2000, ApJ, 529, 745
- Ferrarese et al. (2007) Ferrarese, L., Mould, J.R., Stetson, P.B., et al. 2007, ApJ, 654, 186
- Foley et al. (2014) Foley, R.J., Fox, O.D., McCully, C., et al. 2014, MNRAS, 443, 2887
- Franceschini et al. (2003) Franceschini, A., Braito, V., Persic, M., et al. 2003, MNRAS, 343, 1181
- Galametz et al. (2011) Galametz, M., Madden, S.C., Galliano, F., et al. 2011, A&A, 532, A56
- Ganeshalingam et al. (2013) Ganeshalingam, M., Li, W., & Filippenko, A.V. 2013, MNRAS, 433, 2240
- Gardner et al. (2006) Gardner, J.P., Mather, J.C., Clampin, M., et al. 2006, Space Sci. Rev., 123, 485
- Genzel et al. (1998) Genzel, R., Lutz, D., Sturm, E. et al. 1998, ApJ, 498, 579
- Genzel & Cesarsky (2000) Genzel, R., & Cesarsky, C.J. 2000, ARA&A, 38, 761
- Gerin & Phillips (2000) Gerin, M., & Phillips, T.G. 2000, ApJ, 537, 644
- Gerke et al. (2011) Gerke, J.R., Kochanek, C.S., Prieto, J.L., Stanek, K.Z., & Macri, L.M. 2011, ApJ, 743, 176
- Ghisellini et al. (2009) Ghisellini, G., Tavecchio, F., & Ghirlanda, G. 2009, MNRAS, 399, 2041
- Ghosh & Soundararajaperumal (1992) Ghosh, K.K., & Soundararajaperumal, S. 1992, MNRAS, 259, 175
- Ghosh et al. (2007) Ghosh, H., Pogge, R.W., Mathur, S., Martini, P., & Shields, J.C. 2007, ApJ, 656, 105
- Gilli et al. (2010) Gilli, R., Vignali, C., Mignoli, M., et al. 2010, A&A, 519, A92
- González-Alfonso et al. (2012) González-Alfonso, E., Fischer, J., Graciá-Carpio, J., et al. 2012, A&A, 541, A4
- González-Martín et al. (2009) González-Martín, O., Masegosa, J., Márquez, I., Guainazzi, M., & Jiménez-Bailón, E. 2009, A&A, 506, 1107
- González-Martín & Vaughan (2012) González-Martín, O., & Vaughan, S. 2012, A&A, 544, A80
- González-Martín et al. (2015) González-Martín, O., Masegosa, J., Márquez, I., et al. 2015, A&A, 578, A74
- Gorjian et al. (2007) Gorjian, V., Cleary, K., Werner, M.W., & Lawrence, C.R. 2007, ApJ, 655, L73
- Goulding & Alexander (2009) Goulding, A.D., & Alexander, D.M. 2009, MNRAS, 398, 1165
- Green et al. (2009) Green, R.F., Schmidt, M., & Liebert, J. 2009, VizieR Online Data Catalog, 2207
- Greenhill et al. (2008) Greenhill, L.J., Tilak, A., & Madejski, G. 2008, ApJ, 686, L13
- Greenhouse et al. (1993) Greenhouse, M.A., Feldman, U., Smith, H.A., et al. 1993, ApJS, 88, 23
- Griffin et al. (2010) Griffin, M.J., Abergel, A., Abreu, A., et al. 2010, A&A, 518, L3
- Grimes et al. (2007) Grimes, J.P., Heckman, T., Strickland, D., et al. 2007, ApJ, 668, 891
- Grier et al. (2011) Grier, C.J., Mathur, S., Ghosh, H., & Ferrarese, L. 2011, ApJ, 731, 60
- Guainazzi et al. (2005) Guainazzi, M., Matt, G., & Perola, G.C. 2005, A&A, 444, 119
- Guillard et al. (2012) Guillard, P., Ogle, P.M., Emonts, B.H.C., et al. 2012, ApJ, 747, 95
- Haas et al. (2005) Haas, M., Siebenmorgen, R., Schulz, B., Krügel, E., & Chini, R. 2005, A&A, 442, L39
- Halpern et al. (1996) Halpern, J.P., Eracleous, M., Filippenko, A.V., & Chen, K. 1996, ApJ, 464, 704
- Hao et al. (2009) Hao, L., Wu, Y., Charmandaris, V., et al. 2009, ApJ, 704, 1159
- Helou & Walker (1988) Helou, G., & Walker, D.W. 1988, IRAS catalogs and atlases. Vol. 7, p.1-265, 7, 1
- Ho (1996) Ho, L.C. 1996, PASP, 108, 637
- Ho (1999) Ho, L.C. 1999, ApJ, 516, 672
- Ho & Keto (2007) Ho, L.C., & Keto, E. 2007, ApJ, 658, 314
- Ho (2008) Ho, L.C. 2008, ARA&A, 46, 475
- Ho (2009) Ho, L.C. 2009, ApJ, 699, 626
- Hönig et al. (2014) Hönig, S.F., Watson, D., Kishimoto, M., & Hjorth, J. 2014, Nature, 515, 528
- Hoessel et al. (1980) Hoessel, J.G., Gunn, J.E., & Thuan, T.X. 1980, ApJ, 241, 486
- Hollenbach & McKee (1989) Hollenbach, D., & McKee, C.F. 1989, ApJ, 342, 306
- Holmberg et al. (1974) Holmberg, E.B., Lauberts, A., Schuster, H.-E., & West, R.M. 1974, A&AS, 18, 463
- Houck et al. (2004) Houck, J.R. Roellig, T. L., van Cleve, J. et al. 2004, ApJS, 154, 18
- Hughes et al. (2014) Hughes, T.M., Baes, M., Fritz, J., et al. 2014, A&A, 565, A4
- Hunter & Kaufman (2007) Hunter, D.A., & Kaufman, M. 2007, AJ, 134, 721
- Imanishi & Terashima (2004) Imanishi, M., & Terashima, Y. 2004, AJ, 127, 758¡
- Inami et al. (2013) Inami, H., Armus, L., Charmandaris, V., et al. 2013, ApJ, 777, 156
- Isobe, Feigelson & Nelson (1986) Isobe, T., Feigelson, E.D. & Nelson, P.I. 1986, ApJ, 306, 490
- Israel & Baas (2002) Israel, F.P., & Baas, F. 2002, A&A, 383, 82
- Israel (2009) Israel, F.P. 2009, A&A, 493, 525
- Israel et al. (2015) Israel, F.P., Rosenberg, M.J.F., & van der Werf, P. 2015, A&A, 578, A95
- Iwasawa et al. (2011) Iwasawa, K., Sanders, D.B., Teng, S.H., et al. 2011, A&A, 529, A106
- Izotov et al. (1991) Izotov, I.I., Guseva, N.G., Lipovetskii, V.A., Kniazev, A.I., & Stepanian, J.A. 1991, A&A, 247, 303
- Izotov et al. (2012) Izotov, Y.I., Thuan, T.X., & Privon, G. 2012, MNRAS, 427, 1229
- Jacobs et al. (2009) Jacobs, B.A., Rizzi, L., Tully, R.B., et al. 2009, AJ, 138, 332
- James et al. (2002) James, A., Dunne, L., Eales, S., & Edmunds, M.G. 2002, MNRAS, 335, 753
- Jensen et al. (2003) Jensen, J.B., Tonry, J.L., Barris, B.J., et al. 2003, ApJ, 583, 712
- Jha et al. (2007) Jha, S., Riess, A.G., & Kirshner, R.P. 2007, ApJ, 659, 122
- Jiménez-Bailón et al. (2008) Jiménez-Bailón, E., Krongold, Y., Bianchi, S., et al. 2008, MNRAS, 391, 1359
- Kaaret et al. (2011) Kaaret, P., Schmitt, J., & Gorski, M. 2011, ApJ, 741, 10
- Kamenetzky et al. (2014) Kamenetzky, J., Rangwala, N., Glenn, J., Maloney, P.R., & Conley, A. 2014, ApJ, 795, 174
- Kamenetzky et al. (2015) Kamenetzky, J., Rangwala, N., Glenn, J., Maloney, P.R., & Conley, A. 2015, arXiv:1508.05102
- Kennicutt et al. (2011) Kennicutt, R.C., Calzetti, D., Aniano, G., et al. 2011, PASP, 123, 1347
- Keremedjiev et al. (2009) Keremedjiev, M., Hao, L., & Charmandaris, V. 2009, ApJ, 690, 1105
- Kessler et al. (1996) Kessler, M.F., Steinz, J. A., Anderegg, M. E. et al. 1996, A&A, 315, L27
- Kobulnicky & Martin (2010) Kobulnicky, H.A., & Martin, C.L. 2010, ApJ, 718, 724
- LaMassa et al. (2011) LaMassa, S.M., Heckman, T.M., Ptak, A., et al. 2011, ApJ, 729, 52
- Larsen et al. (2001) Larsen, S.S., Brodie, J.P., Huchra, J.P., Forbes, D.A., & Grillmair, C.J. 2001, AJ, 121, 2974
- Launay & Roueff (1977) Launay, J.M., & Roueff, E. 1977, A&A, 56, 289
- Leipski et al. (2009) Leipski, C., Antonucci, R., Ogle, P., & Whysong, D. 2009, ApJ, 701, 891
- Leitherer et al. (1999) Leitherer, C., Schaerer, D., Goldader, J.D. et al. 1999, ApJS, 123, 3
- Lelli et al. (2014) Lelli, F., Verheijen, M., & Fraternali, F. 2014, A&A, 566, A71
- Liseau et al. (2006) Liseau, R., Justtanont, K., & Tielens, A.G.G.M. 2006, A&A, 446, 561
- Liu et al. (2014) Liu, T., Wang, J.-X., Yang, H., Zhu, F.-F., & Zhou, Y.-Y. 2014, ApJ, 783, 106
- Luangtip et al. (2015) Luangtip, W., Roberts, T.P., Mineo, S., et al. 2015, MNRAS, 446, 470
- Lutz et al. (1998) Lutz, D., Kunze, D., Spoon, H.W.W., & Thornley, M.D. 1998, A&A, 333, L75
- Lutz et al. (2003) Lutz, D., Sturm, E., Genzel, R., et al. 2003, A&A, 409, 867
- Lutz et al. (2004) Lutz, D., Maiolino, R., Spoon, H.W.W., & Moorwood, A.F.M. 2004, A&A, 418, 465
- Madden et al. (2013) Madden, S.C., Rémy-Ruyer, A., Galametz, M., et al. 2013, PASP, 125, 600
- Marchese et al. (2012) Marchese, E., Braito, V., Della Ceca, R., Caccianiga, A., & Severgnini, P. 2012, MNRAS, 421, 1803
- Markarian et al. (1989) Markarian, B.E., Lipovetsky, V.A., Stepanian, J.A., Erastova, L.K., & Shapovalova, A.I. 1989, Soobshcheniya Spetsial’noj Astrofizicheskoj Observatorii, 62, 5
- Mason et al. (2012) Mason, R.E., Lopez-Rodriguez, E., Packham, C., et al. 2012, AJ, 144, 11
- Massaro et al. (2010) Massaro, F., Harris, D.E., Tremblay, G. R., et al. 2010, ApJ, 714, 589
- Massaro et al. (2012) Massaro, F., Tremblay, G.R., Harris, D.E., et al. 2012, ApJS, 203, 31
- Mathews & Ferland (1987) Mathews, W.G., & Ferland, G.J. 1987, ApJ, 323, 456
- McAlpine et al. (2011) McAlpine, W., Satyapal, S., Gliozzi, M., et al. 2011, ApJ, 728, 25
- Meijerink & Spaans (2005) Meijerink, R., & Spaans, M. 2005, A&A, 436, 397
- Meijerink, Spaans & Israel (2007) Meijerink, R., Spaans, M., Israel, F.P. 2007, A&A, 461, 793
- Meléndez et al. (2008) Meléndez, M., Kraemer, S.B., Schmitt, H.R., et al. 2008, ApJ, 689, 95
- Meléndez et al. (2011) Meléndez, M., Kraemer, S.B., Weaver, K.A., & Mushotzky, R.F. 2011, ApJ, 738, 6
- Mieske et al. (2005) Mieske, S., Hilker, M., & Infante, L. 2005, A&A, 438, 103
- Mineo et al. (2012) Mineo, S., Gilfanov, M., & Sunyaev, R. 2012, MNRAS, 419, 2095
- Mingo et al. (2014) Mingo, B., Hardcastle, M.J., Croston, J.H., et al. 2014, MNRAS, 440, 269
- Miniutti et al. (2007) Miniutti, G., Ponti, G., Dadina, M., Cappi, M., & Malaguti, G. 2007, MNRAS, 375, 227
- Mokiem et al. (2004) Mokiem, M.R., Martín-Hernández, N.L., Lenorzer, A., de Koter, A., & Tielens, A.G.G.M. 2004, A&A, 419, 319
- Molina et al. (2009) Molina, M., Bassani, L., Malizia, A., et al. 2009, MNRAS, 399, 1293
- Monje et al. (2011) Monje, R.R., Blain, A.W., & Phillips, T.G. 2011, ApJS, 195, 23
- Moore & Cohen (1994) Moore, D., & Cohen, R.D. 1994, ApJ, 433, 602
- Moorwood et al. (1996) Moorwood, A.F.M., Lutz, D., Oliva, E., et al. 1996, A&A, 315, L109
- Moran et al. (2001) Moran, E.C., Kay, L.E., Davis, M., Filippenko, A.V., & Barth, A.J. 2001, ApJ, 556, L75
- Morisset (2013) Morisset, C. 2013, Astrophysics Source Code Library, ascl:1304.020
- Moshir & et al. (1990) Moshir, M., & et al. 1990, IRAS Faint Source Catalogue, v2.0
- Mould & Sakai (2008) Mould, J., & Sakai, S. 2008, ApJ, 686, L75
- Moustakas et al. (2010) Moustakas, J., Kennicutt, R.C., Jr., Tremonti, C.A., et al. 2010, ApJS, 190, 233-266
- Müller-Sánchez et al. (2010) Müller-Sánchez, F., González-Martín, O., Fernández-Ontiveros, J.A., Acosta-Pulido, J.A., & Prieto, M.A. 2010, ApJ, 716, 1166
- Murphy et al. (2011) Murphy, E.J., Condon, J.J., Schinnerer, E., et al. 2011, ApJ, 737, 67
- Nagao et al. (2011) Nagao, T., Maiolino, R., Marconi, A., & Matsuhara, H. 2011, A&A, 526, A149
- Nagao et al. (2012) Nagao, T., Maiolino, R., De Breuck, C., et al. 2012, A&A, 542, L34
- Nandra & Iwasawa (2007) Nandra, K., & Iwasawa, K. 2007, MNRAS, 382, L1
- Narayan & Yi (1995) Narayan, R., & Yi, I. 1995, ApJ, 452, 710
- Nasonova et al. (2011) Nasonova, O.G., de Freitas Pacheco, J.A., & Karachentsev, I.D. 2011, A&A, 532, A104
- Naylor et al. (2010) Naylor, D.A., Baluteau, J.-P., Barlow, M.J., et al. 2010, Proc. SPIE, 7731, 773116
- Negishi et al. (2001) Negishi, T., Onaka, T., Chan, K.-W., & Roellig, T.L. 2001, A&A, 375, 566
- Nilson (1973) Nilson, P. 1973, Nova Acta Regiae Soc. Sci. Upsaliensis Ser. V
- Noguchi et al. (2009) Noguchi, K., Terashima, Y., & Awaki, H. 2009, ApJ, 705, 454
- O’Dowd et al. (2009) O’Dowd, M.J., Schiminovich, D., Johnson, B.D., et al. 2009, ApJ, 705, 885
- Ogle et al. (2006) Ogle, P., Whysong, D., Antonucci, R., 2006, ApJ, 647, 161
- Ogle et al. (2010) Ogle, P., Boulanger, F., Guillard, P., et al. 2010, ApJ, 724, 1193
- O’Halloran et al. (2006) O’Halloran, B., Satyapal, S., & Dudik, R.P. 2006, ApJ, 641, 795
- O’Halloran et al. (2008) O’Halloran, B., Madden, S.C., & Abel, N.P. 2008, ApJ, 681, 1205
- Oliva et al. (1999) Oliva, E., Marconi, A., & Moorwood, A.F.M. 1999, A&A, 342, 87
- Panessa et al. (2006) Panessa, F., Bassani, L., Cappi, M., et al. 2006, A&A, 455, 173
- Panessa et al. (2015) Panessa, F., Tarchi, A., Castangia, P., et al. 2015, MNRAS, 447, 1289
- Pereira-Santaella et al. (2010a) Pereira-Santaella, M., Diamond-Stanic, A.M., Alonso-Herrero, A. et al. 2010, ApJ, 725, 2270
- Pereira-Santaella et al. (2010b) Pereira-Santaella, M., Alonso-Herrero, A., Rieke, G.H., et al. 2010, ApJS, 188, 447
- Pereira-Santaella et al. (2011) Pereira-Santaella, M., Alonso-Herrero, A., Santos-Lleo, M., et al. 2011, A&A, 535, A93
- Pereira-Santaella et al. (2013) Pereira-Santaella, M., Spinoglio, L., Busquet, G. et al. 2013, ApJ, 768, 55
- Pereira-Santaella et al. (2014) Pereira-Santaella, M., Spinoglio, L., van der Werf, P.P., & Piqueras López, J. 2014, A&A, 566, A49
- Pérez-Beaupuits et al. (2011) Pérez-Beaupuits, J.P., Spoon, H.W.W., Spaans, M., & Smith, J.D. 2011, A&A, 533, A56
- Perlman et al. (2007) Perlman, E.S., Mason, R.E., Packham, C., et al. 2007, ApJ, 663, 808
- Pernechele et al. (2003) Pernechele, C., Berta, S., Marconi, A., et al. 2003, MNRAS, 338, L13
- Petric et al. (2011) Petric, A.O., Armus, L., Howell, J., et al. 2011, ApJ, 730, 28
- Pettini & Pagel (2004) Pettini, M., & Pagel, B.E.J. 2004, MNRAS, 348, L59
- Piconcelli et al. (2007) Piconcelli, E., Fiore, F., Nicastro, F., et al. 2007, A&A, 473, 85
- Piconcelli et al. (2008) Piconcelli, E., Bianchi, S., Miniutti, G., et al. 2008, A&A, 480, 671
- Pilbratt et al. (2010) Pilbratt, G.L., Riedinger, J. R., Passvogel, T. et al. 2010, A&A, 518, L1
- Pilkington & Scott (1965) Pilkington, J.D.H., & Scott, J.F. 1965, MmRAS, 69, 183
- Pilyugin & Thuan (2005) Pilyugin, L.S., & Thuan, T.X. 2005, ApJ, 631, 231
- Pilyugin et al. (2014) Pilyugin, L.S., Grebel, E.K., & Kniazev, A.Y. 2014, AJ, 147, 131
- Poglitsch et al. (2010) Poglitsch, A., Waelkens, C., Geis, N. et al. 2010, A&A, 518, L2
- Porquet et al. (2004) Porquet, D., Reeves, J.N., O’Brien, P., & Brinkmann, W. 2004, A&A, 422, 85
- Privon et al. (2012) Privon, G.C., Baum, S.A., O’Dea, C.P., et al. 2012, ApJ, 747, 46
- Ptak et al. (1998) Ptak, A., Yaqoob, T., Mushotzky, R., Serlemitsos, P., & Griffiths, R. 1998, ApJ, 501, L37
- Pustilnik et al. (2003) Pustilnik, S.A., Kniazev, A.Y., Pramskij, A.G., Ugryumov, A.V., & Masegosa, J. 2003, A&A, 409, 917
- Radburn-Smith et al. (2011) Radburn-Smith, D.J., de Jong, R.S., Seth, A.C., et al. 2011, ApJS, 195, 18
- Rampazzo et al. (2013) Rampazzo, R., Panuzzo, P., Vega, O., et al. 2013, MNRAS, 432, 374
- Rémy-Ruyer et al. (2015) Rémy-Ruyer, A., Madden, S.C., Galliano, F., et al. 2015, A&A, 582, A121
- Rest et al. (2014) Rest, A., Scolnic, D., Foley, R.J., et al. 2014, ApJ, 795, 44
- Riess et al. (2011) Riess, A.G., Macri, L., Casertano, S., et al. 2011, ApJ, 730, 119
- Rigopoulou et al. (2013) Rigopoulou, D., Hurley, P.D., Swinyard, B.M., et al. 2013, MNRAS, 434, 2051
- Rodriguez et al. (2008) Rodriguez, J., Tomsick, J.A., & Chaty, S. 2008, A&A, 482, 731
- Rodríguez et al. (2014) Rodríguez, Ó., Clocchiatti, A., & Hamuy, M. 2014, AJ, 148, 107
- de Rosa et al. (2008) de Rosa, A., Bassani, L., Ubertini, P., et al. 2008, A&A, 483, 749
- Rosa González et al. (2009) Rosa González, D., Terlevich, E., Jiménez Bailón, E., et al. 2009, MNRAS, 399, 487
- Roussel et al. (2007) Roussel, H., Helou, G., Hollenbach, D.J., et al. 2007, ApJ, 669, 95
- Rubin (1983) Rubin, R.H. 1983, ApJ, 274, 671
- Rubin (1985) Rubin, R.H. 1985, ApJS, 57, 349
- Rubin et al. (1994) Rubin, R.H., Simpson, J.P., Lord, S.D. et al. 1994, ApJ, 420, 772
- Saha et al. (2002) Saha, A., Claver, J., & Hoessel, J.G. 2002, AJ, 124, 839
- Saha et al. (2006) Saha, A., Thim, F., Tammann, G.A., Reindl, B., & Sandage, A. 2006, ApJS, 165, 108
- Sales et al. (2010) Sales, D.A., Pastoriza, M.G., & Riffel, R. 2010, ApJ, 725, 605
- Sakai et al. (2004) Sakai, S., Ferrarese, L., Kennicutt, R.C., Jr., & Saha, A. 2004, ApJ, 608, 42
- Sargsyan & Weedman (2009) Sargsyan, L.A., & Weedman, D.W. 2009, ApJ, 701, 1398
- Sargsyan et al. (2011) Sargsyan, L., Weedman, D., Lebouteiller, V., et al. 2011, ApJ, 730, 19
- Satyapal et al. (2004) Satyapal, S., Sambruna, R.M., & Dudik, R.P. 2004, A&A, 414, 825
- Satyapal et al. (2007) Satyapal, S., Vega, D., Heckman, T., O’Halloran, B., & Dudik, R. 2007, ApJ, 663, L9
- Satyapal et al. (2008) Satyapal, S., Vega, D., Dudik, R.P., Abel, N.P., & Heckman, T. 2008, ApJ, 677, 926
- Satyapal et al. (2009) Satyapal, S., Böker, T., Mcalpine, W., et al. 2009, ApJ, 704, 439
- Schaerer & Stasińska (1999) Schaerer, D., & Stasińska, G. 1999, A&A, 345, L17
- Schaller et al. (1992) Schaller, G., Schaerer, D., Meynet, G., & Maeder, A. 1992, A&AS, 96, 269
- Schweitzer et al. (2006) Schweitzer, M., Lutz, D., Sturm, E., et al. 2006, ApJ, 649, 79
- Sellmaier et al. (1996) Sellmaier, F.H., Yamamoto, T., Pauldrach, A.W.A., & Rubin, R.H. 1996, A&A, 305, L37
- Shi et al. (2005) Shi, Y., Rieke, G.H., Hines, D.C., et al. 2005, ApJ, 629, 88
- Shinozaki et al. (2006) Shinozaki, K., Miyaji, T., Ishisaki, Y., Ueda, Y., & Ogasaka, Y. 2006, AJ, 131, 2843
- Shu et al. (2010) Shu, X.W., Yaqoob, T., & Wang, J.X. 2010, ApJS, 187, 581
- Simón-Díaz & Stasińska (2008) Simón-Díaz, S., & Stasińska, G. 2008, MNRAS, 389, 1009
- Sorce et al. (2014) Sorce, J.G., Tully, R.B., Courtois, H.M., et al. 2014, MNRAS, 444, 527
- Spinoglio & Malkan (1992) Spinoglio, L. & Malkan, M.A. 1992, ApJ, 399, 504
- Spinoglio et al. (2005) Spinoglio, L., Malkan, M.A., Smith, H.A., González-Alfonso, E., Fischer, J. 2005, ApJ, 623, 123
- Spinoglio et al. (2012a) Spinoglio, L., Dasyra, K.M., Franceschini, A., et al. 2012, ApJ, 745, 171
- Spinoglio et al. (2012b) Spinoglio, L., Pereira-Santaella, M., Busquet, G., et al. 2012, ApJ, 758, 108
- Spinoglio et al. (2015) Spinoglio, L., Pereira-Santaella, M., Dasyra, K.M., et al. 2015, ApJ, 799, 21, (S15)
- Spoon et al. (2009) Spoon, H.W.W., Armus, L., Marshall, J.A., et al. 2009, ApJ, 693, 1223
- Springob et al. (2009) Springob, C.M., Masters, K.L., Haynes, M.P., Giovanelli, R., & Marinoni, C. 2009, ApJS, 182, 474
- Stacey et al. (2010) Stacey, G.J., Hailey-Dunsheath, S., Ferkinhoff, C., et al. 2010, ApJ, 724, 957
- Stanghellini et al. (2015) Stanghellini, L., Magrini, L., & Casasola, V. 2015, ApJ, 812, 39
- Stasińska et al. (2015) Stasińska, G., Izotov, Y., Morisset, C., & Guseva, N. 2015, A&A, 576, A83
- Storchi Bergmann & Pastoriza (1989) Storchi Bergmann, T., & Pastoriza, M.G. 1989, ApJ, 347, 195
- Sturm et al. (2000) Sturm, E., Lutz, D., Tran, D., et al. 2000, A&A, 358, 481
- Sturm et al. (2002) Sturm, E., Lutz, D., Verma, A., et al. 2002, A&A, 393, 821
- Sturm et al. (2006) Sturm, E., Rupke, D., Contursi, A., et al. 2006, ApJ, 653, L13
- Sturm et al. (2011) Sturm, E., González-Alfonso, E., Veilleux, S., et al. 2011, ApJ, 733, L16
- Sweet et al. (2014) Sweet, S.M., Drinkwater, M.J., Meurer, G., et al. 2014, ApJ, 782, 35
- Swinyard et al. (2009) Swinyard, B., Nakagawa, T., Merken, P., et al. 2009, Experimental Astronomy, 23, 193
- Tan et al. (2012) Tan, Y., Wang, J.X., Shu, X.W., & Zhou, Y. 2012, ApJ, 747, L11
- Teng et al. (2005) Teng, S.H., Wilson, A.S., Veilleux, S., et al. 2005, ApJ, 633, 664
- Teng et al. (2009) Teng, S.H., Veilleux, S., Anabuki, N., et al. 2009, ApJ, 691, 261
- Teng & Veilleux (2010) Teng, S.H., & Veilleux, S. 2010, ApJ, 725, 1848
- Terrano et al. (2012) Terrano, W.A., Zaw, I., & Farrar, G.R. 2012, ApJ, 754, 142
- Theureau et al. (2007) Theureau, G., Hanski, M.O., Coudreau, N., Hallet, N., & Martin, J.-M. 2007, A&A, 465, 71
- Tielens & Hollenbach (1985) Tielens, A.G.G.M & Hollenbach, D. 1985, ApJ, 291, 722
- Tommasin et al. (2008) Tommasin, S., Spinoglio, L., Malkan, M.A., Smith, H., Gonzalez-Alfonso, E., Charmandaris, V. 2008, ApJ, 676, 836.
- Tommasin et al. (2010) Tommasin, S., Spinoglio, L., Malkan, M., Fazio, G., 2010, ApJ, 709, 1257
- Torresi et al. (2009) Torresi, E., Grandi, P., Guainazzi, M., et al. 2009, A&A, 498, 61
- Treister et al. (2005) Treister, E., Castander, F.J., Maccarone, T.J., et al. 2005, ApJ, 621, 104
- Treyer et al. (2010) Treyer, M., Schiminovich, D., Johnson, B.D., et al. 2010, ApJ, 719, 1191
- Tully et al. (1988) Tully, R.B. 1988, Nearby Galaxy Catalog, vol. 0 p. 0
- Tully et al. (2009) Tully, R.B., Rizzi, L., Shaya, E.J., et al. 2009, AJ, 138, 323
- Tully et al. (2013) Tully, R.B., Courtois, H.M., Dolphin, A.E., et al. 2013, AJ, 146, 86
- Tutui & Sofue (1997) Tutui, Y., & Sofue, Y. 1997, A&A, 326, 915
- Tzanavaris & Georgantopoulos (2007) Tzanavaris, P., & Georgantopoulos, I. 2007, A&A, 468, 129
- Ueda et al. (2001) Ueda, Y., Ishisaki, Y., Takahashi, T., Makishima, K., & Ohashi, T. 2001, ApJS, 133, 1
- Ugryumov et al. (2003) Ugryumov, A.V., Engels, D., Pustilnik, S.A., et al. 2003, A&A, 397, 463
- Veilleux et al. (2009) Veilleux, S., Rupke, D. S. N., Kim, D.-C. et al. 2009, ApJS, 182, 628
- Véron-Cetty & Véron (2010) Véron-Cetty, M.-P., & Véron, P. 2010, A&A, 518, A10
- Verma et al. (2003) Verma, A., Lutz, D., Sturm, E., et al. 2003, A&A, 403, 829
- Vorontsov-Vel’Yaminov & Arkhipova (1962) Vorontsov-Vel’Yaminov, B.A., & Arkhipova, V.P. 1962, Morphological catalogue of galaxies., 1
- Wang et al. (2014) Wang, J.-M., Du, P., Hu, C., et al. 2014, ApJ, 793, 108
- Ward et al. (1988) Ward, M.J., Done, C., Fabian, A.C., Tennant, A.F., & Shafer, R.A. 1988, ApJ, 324, 767
- Weaver et al. (2010) Weaver, K.A., Meléndez, M., Mushotzky, R.F., et al. 2010, ApJ, 716, 1151
- Weisz et al. (2014) Weisz, D.R., Dolphin, A.E., Skillman, E.D., et al. 2014, ApJ, 789, 147
- Werner et al. (2004) Werner, M.W., Roellig, T. L., Low, F. J. et al. 2004, ApJS, 154, 1
- Weyant et al. (2014) Weyant, A., Wood-Vasey, W.M., Allen, L., et al. 2014, ApJ, 784, 105
- White (2000) White, D.A. 2000, MNRAS, 312, 663
- Willett et al. (2010) Willett, K.W., Stocke, J.T., Darling, J., & Perlman, E.S. 2010, ApJ, 713, 1393
- Willett et al. (2011) Willett, K.W., Darling, J., Spoon, H.W.W. et al. 2011, ApJS, 193, 18
- Wilman et al. (2003) Wilman, R.J., Fabian, A.C., Crawford, C.S., & Cutri, R.M. 2003, MNRAS, 338, L19
- Winter et al. (2009) Winter, L.M., Mushotzky, R.F., Terashima, Y., & Ueda, Y. 2009, ApJ, 701, 1644
- Winter et al. (2012) Winter, L.M., Veilleux, S., McKernan, B., & Kallman, T.R. 2012, ApJ, 745, 107
- Wright & Otrupcek (1990) Wright, A., & Otrupcek, R. 1990, PKS Catalog
- Yoshii et al. (2014) Yoshii, Y., Kobayashi, Y., Minezaki, T., Koshida, S., & Peterson, B.A. 2014, ApJ, 784, L11
- Zastrow et al. (2013) Zastrow, J., Oey, M.S., & Pellegrini, E.W. 2013, ApJ, 769, 94
- Zwicky & et al. (1996) Zwicky, F., & et al. 1996, VizieR Online Data Catalog, 7190