A Herschel view of protoplanetary disks in the Ori cluster
Abstract
We present new Herschel PACS observations
of 32 T Tauri stars in
the young (3 Myr) Ori cluster.
Most of our objects
are K & M stars with large excesses at 24 m.
We used irradiated accretion disk models of D’Alessio et al. (2006) to compare
their spectral energy distributions with our observational data.
We arrive at the following six conclusions.
(i) The observed disks are consistent with irradiated accretion disks systems.
(ii) Most
of our objects (60%) can be explained by significant dust depletion
from the upper disk layers.
(iii) Similarly, 61% of our objects can be
modeled with large disk sizes ( 100 AU).
(iv) The masses of our disks range between 0.03 to 39 ,
where 35% of our objects
have disk masses
lower than 1 Jupiter.
Although these are lower limits, high mass ( 0.05 M⊙) disks, which are
present e.g, in Taurus, are
missing.
(v) By assuming a uniform distribution of
objects around the brightest stars at the center of the cluster,
we found that 80% of our disks are exposed to external FUV radiation
of , which can be strong
enough to photoevaporate the outer edges of the closer disks.
(vi) Within 0.6 pc from Ori we found forbidden emission lines of [NII] in the spectrum of one of
our large disk (SO662), but no emission in any of our small ones.
This suggests that this object may be an example of a photoevaporating
disk.
1 Introduction
Due to angular momentum conservation,
the collapse of rotating cloud cores leads
to the formation of stars surrounded by disks.
These disks evolve because they are accreting mass onto
the star and because the dust grains tend to settle towards
the midplane where they collide and grow
(e.g. Hartmann et al. 1998, Hartmann 2009).
The material
in the disk is subject to irradiation from the
host star and from the high energy fields
produced in accretion shocks on the stellar surface, in
the stellar active regions, and in the environment,
if the star is immersed in the radiation field of
nearby OB stars in a stellar cluster (D’Alessio et al., 2001, 2006; Adams et al., 2004; Anderson et al., 2013). These
high energy fields heat the gas, eventually
leading to its dissipation, while the solids grow to
planetesimal and planet sizes.
Still, many open questions remain on
how these processes happen and interact with each
other.
Previous studies
using Spitzer data of
different star-forming regions
with ages between 1 and 10 Myr,
show a decrease of disk fraction as a function
of age of the clusters
(Hernández et al. 2007a, henceforward H07a).
The decrease of disk frequency is reflected as a clear drop
in the mid-IR excess,
indicating that only 20 of the stars
retain their original disks by 5 Myr (Hernández et al., 2007b).
It is therefore essential to observe disks in the crucial age range between 2 and 10 Myr in which
the agents driving the evolution of protoplanetary disks are most active.
The decrease of the IR excess can be explained by grain growth
and by settling of dust to the disk midplane, reducing the
flaring of the disk and thus its emitting flux. This interpretation is
confirmed by the analysis made by D’Alessio et al. (2006) using
irradiated accretion disk models. These models simulate the settling process by
introducing the parameter, which represents the gas-to-dust mass ratio
at the disk atmosphere compared to that of the ISM. In this sense,
a depletion of small grains in the upper layer of the disks
will be reflected as a small
value of . Unevolved disks, on the other hand, will have
values close to unity.
Once the dust has settled, large bodies present in the disk will interact with its local environment creating more complex radial structures like inner clearings or gaps. The most probable mechanism responsible for this effect is an orbiting companion, either stellar or planetary, that cleared out the material in the inner disk (Calvet et al., 2002; Espaillat et al., 2014). This mechanism can explain some of the so called transitional and pre-transitional disks (TDs and PTDs hereafter).
Also important is disk truncation via mass loss. Besides an orbiting planet, truncation of the inner disk may result from the dissipation of gas being heated by high-energy radiation fields coming from the host star (Hollenbach et al., 2000; Alexander et al., 2006; Clarke, 2007; Dullemond et al., 2007). Evidence of mass loss in disks comes from forbidden emission lines of ionized species like [SII], [OI], [NeII] and [NII]. The low velocity component of these lines has been associated with photoevaporative winds that might be able to explain some of the TD and PTDs observed (Pascucci & Sterzik, 2009; Gorti et al., 2011).
The truncation of the outer parts of the disks, on the other hand, may be the result of environmental effects, like mass loss due to high energy photons from nearby massive stars impinging on the surface of the disk and heating the less tightly bound material. Expected mass loss rates in externally-illuminated disks can be substantial (Adams et al., 2004; Facchini et al., 2016), and when incorporated into viscous evolution models (Clarke, 2007; Anderson et al., 2013; Kalyaan et al., 2015) can have a strong impact on the disk structure and lifetime. Externally-illuminated disks, known as proplyds, have been well characterized in the Orion Nebula Cluster (hereafter ONC; O’dell & Wen, 1994; Johnstone et al., 1998; Henney & O’Dell, 1999; Störzer & Hollenbach, 1999; García-Arredondo et al., 2001; Smith et al., 2005; Williams et al., 2005; Eisner et al., 2008; Mann et al., 2014) where the radiation from the Trapezium stars photoevaporates the disks. Evidence of outer photoevaporation in other star-forming regions has also been found (Rigliaco et al., 2009; Rigliaco et al., 2013; Natta et al., 2014).
Multiplicity can also produce truncated disks. The fraction of binary companions in young regions can be 30% or larger where close ( 100 AU) binaries can affect the evolution of protoplanetary and circumbinary disks by significantly reducing their lifetime (Daemgen et al., 2015). In Taurus star-forming region the disk population affected by multiplicity constitutes close binaries with separations 40 AU (Kraus & Hillenbrand, 2012).
In order to understand what physical processes cause the disks to evolve, many multiband observations of different regions within a wide range of ages and environments have been made. Many of these studies have used data from the Spitzer Space Telescope to describe the state of gas and dust within the first AU from the central object. In the 5 Myr old (de Zeeuw et al., 1999) Upper Scorpius OB association Dahm & Carpenter (2009) examined, among others, 7 late-type disk-bearing (K+M) members using the Infrared Spectrograph (IRS). They found a lack of sub-micron dust grains in the inner regions of the disks and that the strength of silicate emission is spectral-type dependent. In a disk census performed by Luhman & Mamajek (2012) with Spitzer and WISE photometry they found that late-type members have a higher inner disk fraction than early-types. The 10 Myr old (Uchida et al., 2004) TW Hydrae (TW Hya) association has also been the target for different disk evolution studies. Uchida et al. (2004) analyzed two objects with IR excesses on their IRS spectra. They found signs of significant grain growth and dust processing and also evidence of dust clearing in the inner (4 AU) disks, possibly due to the presence of orbiting planets. Similar studies performed in other regions like Ophiucus (McClure et al., 2010, 1 Myr), Taurus (Furlan et al., 2006, 1-2 Myr), and Chamaeleon I (Manoj et al., 2011, 2 Myr), using IRS spectra to analyze the strength and shape of the 10 and 20 silicate features, have shown that disks in these regions are highly settled and exhibit signs of significant dust processing.
In order to describe the distribution of gas and dust in circumstellar
disks around young stars,
many works have been done
using the Photodetector Array Camera & Spectrometer (PACS) instrument
on board the Herschel Space Observatory.
The main idea of these studies
has been the description of disks structures
as well as the estimation of gas and dust masses
in different star-forming regions
(Riviere-Marichalar
et al. 2013: TW Hya association; Mathews et
al. 2013: Upper Scorpius; Olofsson et al. 2013:
Chamaleon-I).
Additionally, Howard et al. (2013)
modeled PACS detections in Taurus,
and found that
the region probed by their observations constitutes the inner part
(5-50 AU) of their disks.
The 3 Myr old Ori cluster (H07a)
is an excellent laboratory
for studies of disk evolution
for two reasons:
first, the large number of stars still harboring disks allows us to obtain results with statistical significance
and second, given its intermediate age, one can expect the first traces of disk evolution to become
apparent.
We present here
new Herschel PACS 70 and 160 photometry
of 32 TTSs in the cluster,
with B, V, R and I magnitudes, 2MASS, Spitzer IRAC and MIPS
photometry from H07a and spectral types
from Hernández et al. (2014), H14 hereafter.
Our main goal is
to describe the state of the dust on our sample by
analyzing the infrared properties of the stars
and by modeling their SEDs
with irradiated accretion disk models.
In §2 we describe the observational data and a few
details about the reduction process;
in §3 we present the SEDs of our objects;
in §4 we characterize our PACS sources;
our results are shown in §5
where we characterize our PACS disks using spectral indices
(§5.2) and modeling the SEDs of individual
objects (§5.3); the discussion is presented
in §6 and
the conclusions are shown in §7.
2 PACS Observations
Our Herschel/PACS imaging survey of the Ori cluster was obtained on March 14, 2012 as part of our Herschel program . We used the “scan map” observational template with medium scan speed (20″/s) to map a square field 3′ per side. Each scan line was 30′ long, and 134 overlapping scan lines with a stepsize of 15 ″. The field was observed twice at orthogonal scan directions in order to mitigate the low-frequency drift of the bolometer timelines. We aimed at reaching a 1- point source sensitivity of 2.6 mJy and 6 mJy at 70 µm and 160 µm, respectively.
Our observations were processed using the map-making software Scanmorphos, which was developed and described by Roussel (2013). We used the “FM6” version of the PACS calibration (Balog et al., 2014) and the data processed with version 9 of the Herschel Interactive Processing Environement (HIPE Ott, 2010) software (see Briceño et al., 2013). The scales for the 70 µm and 160 µm maps are 1″/pixels and 2″/pixels, respectively. Scanamorphos preserves astrophysical emission on all spatial scales, ranging from point sources to extended structures with scales just below the map size. We performed source detection on the 70 µm and 160 µm maps using the daofind task in IRAF. We extracted aperture photometry for the detected sources using apphot in IRAF. Following Fischer et al. (2013), for the 70 µm images we used an aperture radius of 9.6 arcsec, inner sky annulus radius of 9.6 arcsec and sky annulus width of 9.6 arcsec; for the 160 µm images we used an aperture radius of 12.8 arcsec, inner sky annulus radius of 12.8 arcsec and a 12.8 arcsec sky annulus width. The photometric error was determined as the sum in quadrature of the measurement error and the calibration error (see Briceño et al., 2013). The detections were then cross matched with the photometric candidates selected in H07a.
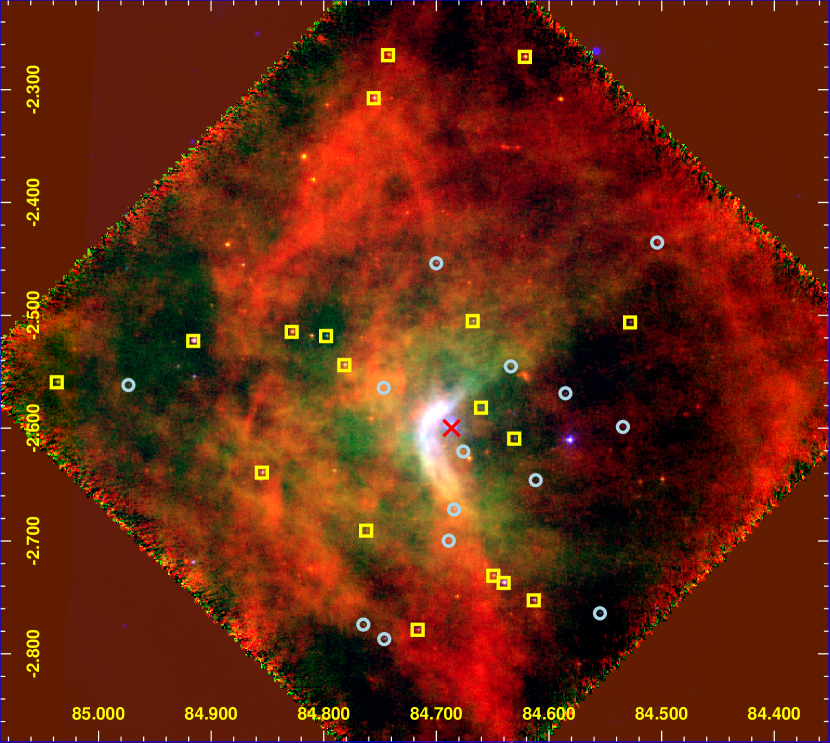
The PACS field of view (FOV) is shown in Figure 1 as a three-color map using Spitzer MIPS 24 µm (H07a) and PACS bands. We detected 32 TTSs in the cluster at PACS 70 . Of these, 17 sources were also detected at 160 and the rest only as upper limits. Stars with 160m upper limits were defined using the 3 sigma criteria. The large range of values for these upper limits are due to the non-uniform background in the image. On Figure 1 squares indicate stars detected at 70 µm and 160 µm while circles represent stars only detected at 70 µm (with 160 µm upper limits). The lowest flux measured at 70 m is equal to 9.4 1.1 mJy. The multiple-star system Ori is shown by a red cross on the center of the field, where an arc-shaped nebulosity can be seen to the west side. This nebulosity consists of gas and dust that have been dragged away by the strong radiation of the massive stars on the system.
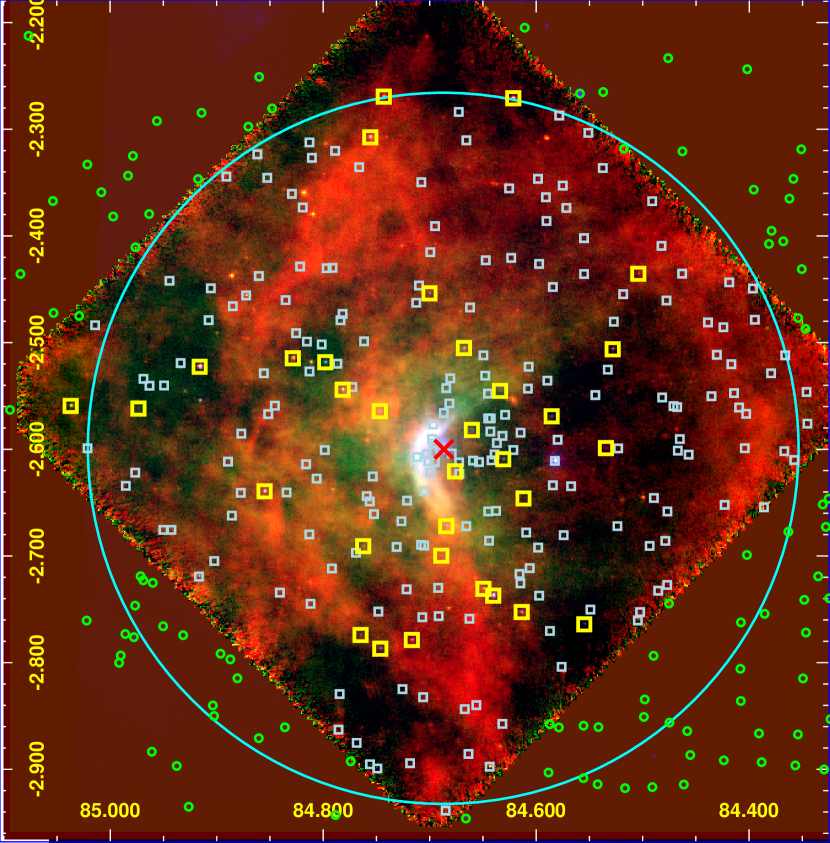
The Ori cluster has a dense core (see Figure 2) extended from the center to a radius of 20′, in which most members are located, and a rarefied halo extended up to 30′ (Caballero, 2008). Note that the dense core is almost entirely covered by the FOV of PACS that covers a total of 142 TTS of which 23% are detected at 70 m. These detections have been reported as disk bearing candidates with infrared excess at 24 µm (H07a). The disk fraction for members inside the dense core is 42% (H07a). Our PACS photometry is reported in Table 1.
Others PACS detections not consider in this work were: (1) 8 sources with optical or 2MASS counterparts detected only at 160 , all these sources are background candidates from optical-2MASS color magnitude diagrams; (2) 13 sources detected at 70 (6 of them were reported as non members or galaxy candidates): SO406 and SO950 are galaxy candidates (Galaxies based on the profile flag of UKIDSS), SO916 and SO596 are identified as background sources (H07a, H14), SO457 is a pulsating red giant (Caballero et al., 2010), SO668 is reported as an obscured QSO at z = 0.2362 (Caballero, 2008), SO770 is highly
| SO ID | 2MASS ID | RA (J2000.0) | DEC (J2000.0) | 70 m | 160 m |
|---|---|---|---|---|---|
| (deg) | (deg) | (mJy) | (mJy) | ||
| SO299 | 05380097-0226079 | 84.50404 | -2.43553 | 16.8 1.3 | 56.6 |
| SO341 | 05380674-0230227 | 84.52808 | -2.50631 | 42.0 1.6 | 31.9 2.7 |
| SO362 | 05380826-0235562 | 84.53442 | -2.59894 | 16.0 1.3 | 16.1 |
| SO396 | 05381315-0245509 | 84.55479 | -2.76414 | 30.5 1.7 | 38.8 |
| SO462 | 05382050-0234089 | 84.58542 | -2.56914 | 26.6 1.5 | 9.8 |
| SO514 | 05382684-0238460 | 84.61183 | -2.64611 | 9.4 1.1 | … |
| SO518 | 05382725-0245096 | 84.61354 | -2.75267 | 71.8 2.3 | 48.1 4.9 |
| SO540 | 05382915-0216156 | 84.62146 | -2.271 | 207.0 5.7 | 243.4 11 |
| SO562 | 05383141-0236338 | 84.63087 | -2.60939 | 24.0 1.3 | 18.7 3.1 |
| SO566 | J053832.13-023243 | 84.63387 | -2.54528 | 16.6 2.2 | 26.7 |
| SO583 | 05383368-0244141 | 84.64033 | -2.73725 | 263.5 7.2 | 89.1 5.3 |
| SO615 | 05383587-0243512 | 84.64946 | -2.73089 | 47.0 1.9 | 93.0 6.5 |
| SO638 | 05383848-0234550 | 84.66033 | -2.58194 | 23.8 1.6 | 8.2 |
| SO662 | 05384027-0230185 | 84.66779 | -2.50514 | 64.9 2.7 | 37.4 2.9 |
| SO682 | 05384227-0237147 | 84.67612 | -2.62075 | 28.6 2.9 | 14.2 |
| SO697 | 05384423-0240197 | 84.68429 | -2.67214 | 21.0 1.9 | 11.7 |
| SO710 | 05384537-0241594 | 84.68904 | -2.69983 | 10.5 1.4 | 17.4 |
| SO736 | 05384803-0227141 | 84.70012 | -2.45392 | 26.8 1.5 | 19.3 |
| SO774 | 05385200-0246436 | 84.71667 | -2.77878 | 50.8 1.7 | 49.3 3.7 |
| SO818 | 05385831-0216101 | 84.74296 | -2.26947 | 141.4 3.9 | 148.9 6.7 |
| SO823 | 05385911-0247133 | 84.74629 | -2.78703 | 40.9 1.8 | 26.7 |
| SO827 | 05385922-0233514 | 84.74675 | -2.56428 | 31.9 1.5 | 39.8 |
| SO844 | 05390136-0218274 | 84.75567 | -2.30761 | 219.6 6.0 | 196.6 10.4 |
| SO859 | 05390297-0241272 | 84.76238 | -2.69089 | 22.0 1.5 | 33.4 3.3 |
| SO865 | 05390357-0246269 | 84.76488 | -2.77414 | 25.8 1.4 | 14.2 |
| SO897 | 05390760-0232391 | 84.78167 | -2.54419 | 121.7 3.6 | 75.8 7.4 |
| SO927 | 05391151-0231065 | 84.79796 | -2.51847 | 100.2 2.9 | 33.8 2.5 |
| SO984 | 05391883-0230531 | 84.82846 | -2.51475 | 138.8 3.9 | 179.1 8.1 |
| SO1036 | 05392519-0238220 | 84.85496 | -2.63944 | 107.3 3.2 | 73.5 4.5 |
| SO1153 | 05393982-0231217 | 84.91592 | -2.52269 | 482.9 12.8 | 448.6 19 |
| SO1260 | 05395362-0233426 | 84.97342 | -2.56183 | 12.2 1.1 | 31.8 |
| SO1361 | 05400889-0233336 | 85.03704 | -2.55933 | 199.5 5.5 | 80.1 4.5 |
Note. — Column 1:ID following H07a; Column 2: 2MASS ID; Column 3 and 4: right ascension and declination from H07a; Column 5: PACS 70 flux; Column 6: PACS 160 flux.
| SO ID | Spt | Av | Disk Type | R∗ | Age | ||||
|---|---|---|---|---|---|---|---|---|---|
| (K) | (mag) | (M⊙) | (R⊙) | (M⊙ yr-1) | (My) | (pc) | |||
| SO299 | M2.5 1.0 | 3490.0 | 0.42 | TD | 0.341 | 1.192 | 1.27e-09 | 3.81 | 1.54 |
| SO341 | M0.0 0.5 | 3770.0 | 0.58 | II | 0.505 | 1.769 | 1.21e-09 | 2.04 | 1.15 |
| SO362 | M2.5 0.5 | 3490.0 | 0.57 | II | 0.348 | 1.641 | 1.04e-09 | 2.16 | 0.95 |
| SO396 | M1.5 0.5 | 3630.0 | 0.64 | II | 0.417 | 1.638 | 7.85e-09 | 2.21 | 1.32 |
| SO462 | M4.0 1.0 | 3160.0 | 2.94 | II | 0.231 | 2.083 | 1.22e-09 | 1.00 | 0.66 |
| SO514 | M3.5 1.0 | 3360.0 | 2.2 | II | 0.254 | 0.885 | — | 6.90 | 0.55 |
| SO518 | K6.0 1.0 | 4020.0 | 0.0 | II | 0.754 | 1.367 | 2.88e-09 | 6.50 | 1.06 |
| SO540 | K6.5 1.5 | 4020.0 | 0.53 | II | 0.728 | 1.662 | — | 2.99 | 2.11 |
| SO562 | M3.5 1.5 | 3360.0 | 0.07 | II | 0.294 | 1.616 | 2.68e-09 | 2.20 | 0.35 |
| SO566 | M5.0 1.0 | 2880.0 | 0.59 | II | 0.099 | 1.391 | — | 0.46 | 0.47 |
| SO583 | K4.5 1.5 | 4330.0 | 0.0 | II | 1.087 | 2.848 | 7.48e-09 | 1.03 | 0.90 |
| SO615 | K3.0 3.0 | 4550.0 | 1.98 | EV | 1.498 | 3.019 | 7.7e-10 | 1.46 | 0.85 |
| SO638 | K2.0 1.0 | 4760.0 | 1.03 | EV | 1.867 | 3.170 | — | 1.93 | 0.20 |
| SO662 | K7.0 1.0 | 3970.0 | 1.89 | II | 0.660 | 2.196 | 1.99e-09 | 1.62 | 0.60 |
| SO682 | M0.5 1.0 | 3770.0 | 0.67 | II | 0.505 | 1.785 | 2.3e-10 | 2.00 | 0.14 |
| SO697 | K6.0 0.5 | 4020.0 | 0.43 | II | 0.725 | 1.900 | 1.07e-09 | 2.42 | 0.45 |
| SO710 | M1.5 1.5 | 3630.0 | 0.59 | II | 0.417 | 1.677 | 1.02e-09 | 2.12 | 0.62 |
| SO736 | K6.0 0.5 | 4020.0 | 0.88 | II | 0.748 | 3.528 | 2.38e-09 | 0.69 | 0.92 |
| SO774 | K7.5 1.0 | 3970.0 | 0.12 | II | 0.674 | 1.730 | 1.21e-09 | 2.69 | 1.13 |
| SO818 | M0.0 0.5 | 3770.0 | 0.54 | TD | 0.509 | 1.346 | 3.4e-10 | 3.84 | 2.10 |
| SO823 | M2.0 1.5 | 3490.0 | 2.11 | II | 0.354 | 2.958 | — | 0.38 | 1.23 |
| SO827 | M2.5 1.0 | 3490.0 | 0.0 | II | 0.335 | 1.094 | 7.3e-10 | 4.98 | 0.44 |
| SO844 | M0.5 0.5 | 3770.0 | 0.42 | II | 0.506 | 1.754 | 4.38e-09 | 2.08 | 1.88 |
| SO859 | M2.5 0.5 | 3490.0 | 0.71 | II | 0.347 | 1.473 | 1.9e-09 | 2.51 | 0.74 |
| SO865 | M3.5 1.0 | 3360.0 | 0.0 | II | 0.280 | 1.180 | 7.2e-10 | 3.47 | 1.19 |
| SO897 | K6.5 1.5 | 4020.0 | 0.35 | TD | 0.725 | 1.945 | 1.78e-09 | 2.33 | 0.69 |
| SO927 | M0.0 1.0 | 3770.0 | 1.04 | II | 0.506 | 1.690 | 9.2e-10 | 2.24 | 0.86 |
| SO984 | K7.0 0.5 | 3970.0 | 0.74 | II | 0.665 | 1.983 | 2.83e-09 | 2.08 | 1.04 |
| SO1036 | K7.5 0.5 | 3970.0 | 0.92 | II | 0.662 | 2.124 | 8.13e-09 | 1.77 | 1.08 |
| SO1153 | K5.5 1.0 | 4140.0 | 0.15 | I | 0.875 | 1.402 | 4.19e-09 | 6.99 | 1.52 |
| SO1260 | M2.5 1.0 | 3490.0 | 0.71 | II | 0.343 | 1.223 | 2.03e-09 | 3.46 | 1.81 |
| SO1361 | K7.5 1.0 | 3970.0 | 0.53 | II | 0.670 | 1.843 | — | 2.42 | 2.21 |
Note. — Column 1: ID following H07a; Column 2: spectral type from H14; Column 3: effective temperature; Column 4: extinction from H14; Column 5: disk type from H07a; Column 6: stellar mass, Column 7: stellar radius; Column 8: mass accretion rate; Column 9: age; Column 10: projected distance to the central Ori multiple system. Stellar masses, radii and ages were derived as described in §4.2
| SO ID | Spt | Av | Disk Type | R∗ | Age | |||
|---|---|---|---|---|---|---|---|---|
| (K) | (mag) | (M⊙) | (R⊙) | (M⊙ yr-1) | (My) | |||
| SO117 | M3.0 0.5 | 3360 | 0.26 | III | 0.276 | 1.143 | 7.2E-11 | 3.85 |
| SO165 | M4.5 1.0 | 3160 | 0.16 | III | 0.163 | 0.817 | 4.1E-11 | 6.29 |
| SO214 | M2.0 0.5 | 3490 | 0.57 | III | 0.35 | 1.855 | 5.5E-10 | 1.77 |
| SO219 | M4.5 1.5 | 3160 | 1.29 | III | 0.144 | 0.578 | 8.0E-12 | 9.31 |
| SO220 | M3.0 0.5 | 3360 | 0.13 | III | 0.276 | 1.143 | 6.6E-11 | 3.85 |
| SO247 | M5.0 0.5 | 2880 | 0.0 | II | 0.075 | 1.063 | 3.45E-10 | 0.83 |
| SO271 | M5.0 1.0 | 2880 | 0.38 | II | 0.049 | 0.803 | 1.36E-10 | 4.49 |
| SO283 | M5.5 0.5 | 2880 | 0.0 | III | 0.085 | 1.205 | 1.83E-10 | 0.65 |
| SO327 | M4.5 2.0 | 3160 | 1.77 | II | 0.144 | 0.578 | 1.33E-10 | 9.31 |
| SO397 | M4.0 1.0 | 3160 | 0.0 | II | 0.218 | 1.529 | 1.057E-9 | 2.11 |
| SO398 | M5.5 1.0 | 2880 | 0.0 | III | 0.049 | 0.803 | 8.2E-11 | 4.49 |
| SO426 | M3.5 0.5 | 3360 | 0.6 | III | 0.254 | 0.885 | 4.2E-11 | 6.90 |
| SO432 | M5.0 0.5 | 2880 | 0.46 | III | 0.08 | 1.136 | 1.75E-10 | 0.74 |
| SO435 | M5.0 0.5 | 2880 | 0.0 | II | 0.09 | 1.27 | 2.79E-10 | 0.58 |
| SO484 | M4.0 0.5 | 3160 | 0.42 | III | 0.178 | 1.001 | 5.0E-11 | 4.53 |
| SO485 | M2.0 1.0 | 3490 | 1.83 | II | 0.324 | 0.947 | 8.58E-10 | 6.95 |
| SO489 | M4.5 0.5 | 3160 | 0.31 | III | 0.187 | 1.106 | 4.4E-11 | 3.66 |
| SO490 | M4.0 1.0 | 3160 | 1.14 | II | 0.191 | 1.156 | 2.073E-9 | 3.28 |
| SO500 | M4.5 2.0 | 3160 | 0.6 | II | 0.144 | 0.578 | 1.98E-10 | 9.31 |
| SO520 | M3.5 0.5 | 3360 | 0.3 | II | 0.284 | 1.217 | 4.8E-10 | 3.11 |
| SO525 | M3.0 1.0 | 3360 | 0.39 | III | 0.295 | 1.669 | 3.23E-10 | 2.10 |
| SO539 | M1.5 0.5 | 3630 | 0.63 | III | 0.414 | 1.264 | 1.45E-10 | 3.67 |
| SO563 | K7.5 0.5 | 3970 | 1.99 | II | 0.659 | 2.227 | 1.252E-9 | 1.56 |
| SO572 | K6.0 1.0 | 4020 | 0.91 | III | 0.726 | 1.867 | 3.03E-10 | 2.50 |
| SO582 | M2.5 0.5 | 3490 | 0.29 | III | 0.348 | 1.664 | 1.52E-10 | 2.11 |
| SO587 | M3.0 1.0 | 3360 | 0.71 | II | 0.297 | 1.912 | 1.084E-9 | 1.71 |
| SO592 | K7.0 1.0 | 3970 | 0.25 | III | 0.665 | 1.983 | 2.66E-10 | 2.08 |
| SO598 | M2.0 1.0 | 3490 | 2.19 | II | 0.346 | 1.312 | 9.2E-11 | 2.88 |
| SO611 | K7.0 1.0 | 3970 | 0.48 | III | 0.665 | 2.005 | 3.86E-10 | 2.03 |
| SO616 | K7.0 1.0 | 3970 | 0.2 | III | 0.665 | 1.983 | 4.86E-10 | 2.08 |
| SO624 | M4.5 0.5 | 3160 | 0.51 | III | 0.199 | 1.248 | 3.9E-11 | 2.84 |
| SO628 | M4.5 1.5 | 3160 | 0.24 | III | 0.206 | 1.334 | 7.7E-11 | 2.60 |
| SO637 | K6.0 1.0 | 4020 | 0.78 | III | 0.718 | 2.191 | 4.28E-10 | 1.84 |
| SO646 | M2.5 1.0 | 3490 | 1.08 | II | 0.343 | 1.223 | 7.29E-10 | 3.46 |
| SO655 | M3.5 0.5 | 3360 | 1.2 | III | 0.254 | 0.885 | 2.1E-11 | 6.90 |
| SO658 | M4.5 1.0 | 3160 | 0.18 | III | 0.168 | 0.883 | 6.0E-12 | 5.63 |
| SO669 | M0.0 1.0 | 3770 | 0.2 | III | 0.503 | 1.933 | 4.45E-10 | 1.66 |
| SO687 | M1.0 1.0 | 3630 | 0.0 | II | 0.417 | 1.619 | 9.42E-10 | 2.25 |
| SO691 | M1.5 1.5 | 3630 | 0.25 | III | 0.418 | 1.823 | 3.5E-10 | 1.81 |
| SO696 | K7.0 1.0 | 3970 | 0.7 | III | 0.654 | 2.51 | 1.141E-9 | 1.02 |
| SO706 | G5.0 2.5 | 5500 | 1.73 | III | 1.649 | 2.773 | 1.202E-9 | 6.65 |
| SO721 | M5.0 2.0 | 2880 | 0.0 | III | 0.085 | 1.205 | 1.73E-10 | 0.65 |
| SO723 | M4.0 1.5 | 3160 | 0.61 | II | 0.219 | 1.565 | 1.827E-9 | 2.03 |
| SO726 | M0.5 1.0 | 3770 | 0.03 | II | 0.506 | 1.69 | 1.359E-9 | 2.24 |
| SO733 | M1.0 0.5 | 3630 | 0.35 | II | 0.417 | 1.474 | 6.48E-10 | 2.60 |
| SO740 | M4.5 0.5 | 3160 | 0.0 | III | 0.227 | 1.857 | 1.77E-10 | 1.41 |
| SO742 | M1.5 1.5 | 3630 | 0.24 | III | 0.417 | 1.517 | 2.44E-10 | 2.49 |
| SO747 | M0.5 0.5 | 3770 | 0.59 | III | 0.501 | 2.109 | 4.54E-10 | 1.29 |
| SO748 | M3.5 0.5 | 3360 | 0.23 | III | 0.298 | 2.065 | 4.63E-10 | 1.49 |
| SO757 | M3.0 1.0 | 3360 | 0.25 | III | 0.286 | 1.252 | 7.0E-11 | 2.94 |
| SO759 | M3.5 1.0 | 3360 | 0.19 | EV | 0.291 | 1.415 | 1.0E-10 | 2.58 |
| SO765 | M3.0 1.0 | 3360 | 1.66 | III | 0.287 | 1.286 | 4.2E-11 | 2.86 |
| SO785 | M1.0 1.0 | 3630 | 0.75 | III | 0.417 | 1.538 | 2.31E-10 | 2.44 |
| SO855 | M4.0 1.0 | 3160 | 0.0 | III | 0.212 | 1.415 | 1.54E-10 | 2.39 |
| SO866 | M4.5 1.0 | 3160 | 0.15 | II | 0.163 | 0.817 | 6.3E-11 | 6.29 |
| SO879 | K6.5 1.0 | 4020 | 0.64 | III | 0.727 | 1.797 | 2.28E-10 | 2.66 |
| SO896 | M2.5 1.5 | 3490 | 0.75 | III | 0.341 | 1.192 | 1.8E-10 | 3.81 |
| SO901 | M4.0 1.0 | 3160 | 0.05 | EV | 0.157 | 0.746 | 9.0E-12 | 7.09 |
| SO908 | M3.0 1.0 | 3360 | 1.51 | II | 0.289 | 1.32 | 4.0E-10 | 2.79 |
| SO914 | M1.5 1.0 | 3630 | 0.44 | III | 0.412 | 1.212 | 6.3E-11 | 4.30 |
| SO929 | K7.0 1.0 | 3970 | 0.51 | III | 0.674 | 1.743 | 2.01E-10 | 2.66 |
| SO940 | M4.0 0.5 | 3160 | 0.55 | III | 0.183 | 1.055 | 6.0E-12 | 4.08 |
| SO947 | M1.5 1.0 | 3630 | 0.74 | III | 0.417 | 1.579 | 4.07E-10 | 2.34 |
| SO967 | M4.0 0.5 | 3160 | 0.0 | II | 0.183 | 1.055 | 6.3E-11 | 4.08 |
| SO978 | M1.5 1.0 | 3630 | 0.44 | III | 0.405 | 1.073 | 2.2E-11 | 6.15 |
| SO999 | M4.0 1.0 | 3160 | 1.05 | III | 0.183 | 1.055 | 1.0E-11 | 4.08 |
| SO1000 | M2.0 1.0 | 3490 | 0.68 | III | 0.348 | 1.664 | 2.89E-10 | 2.11 |
| SO1017 | M2.0 1.0 | 3490 | 0.6 | III | 0.341 | 1.192 | 1.6E-10 | 3.81 |
| SO1027 | M2.0 0.5 | 3490 | 0.48 | III | 0.335 | 1.094 | 1.1E-10 | 4.98 |
| SO1052 | M1.5 1.0 | 3630 | 0.67 | III | 0.396 | 0.876 | 3.5E-11 | 9.20 |
| SO1133 | K7.5 1.0 | 3970 | 0.62 | III | 0.675 | 1.704 | 2.9E-10 | 2.76 |
| SO1207 | M5.0 0.5 | 2880 | 0.0 | III | 0.099 | 1.391 | 2.21E-10 | 0.45 |
| SO1250 | K7.0 1.5 | 3970 | 0.36 | III | 0.672 | 1.793 | 2.58E-10 | 2.53 |
| SO1268 | M4.5 3.0 | 3160 | 1.72 | TD | 0.151 | 0.667 | 3.6E-11 | 8.07 |
Note. — Columns description as in Table 2.
contaminated by the background (located on the arc-shaped nebulosity), SO848, SO1266, SO1154 and SO1182 have no spectral types reported by H14, SO1075 has no optical information and SO1155 is located near the edge of the PACS coverage. The undetected classical T Tauri stars (CTTSs) have the smallest excesses at MIPS 24 (see section §4.1, Figure 5).
3 Spectral Energy Distribution
The 32 sources detected by PACS in the Ori field have stellar counterparts that have been characterized by H14. Their spectral types, effective temperatures (using the calibrations of Pecaut & Mamajek 2013), and reddening corrections Av are shown in Table 2.
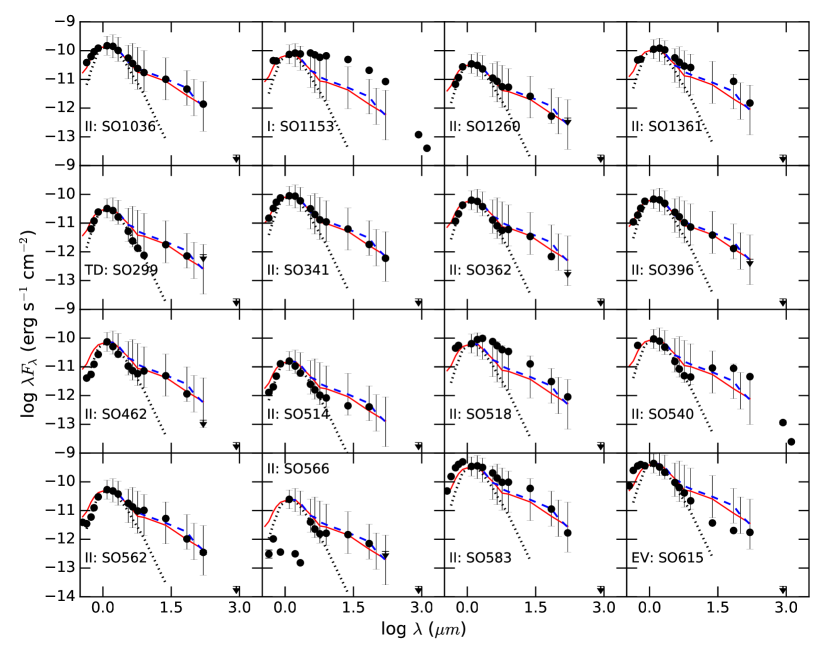
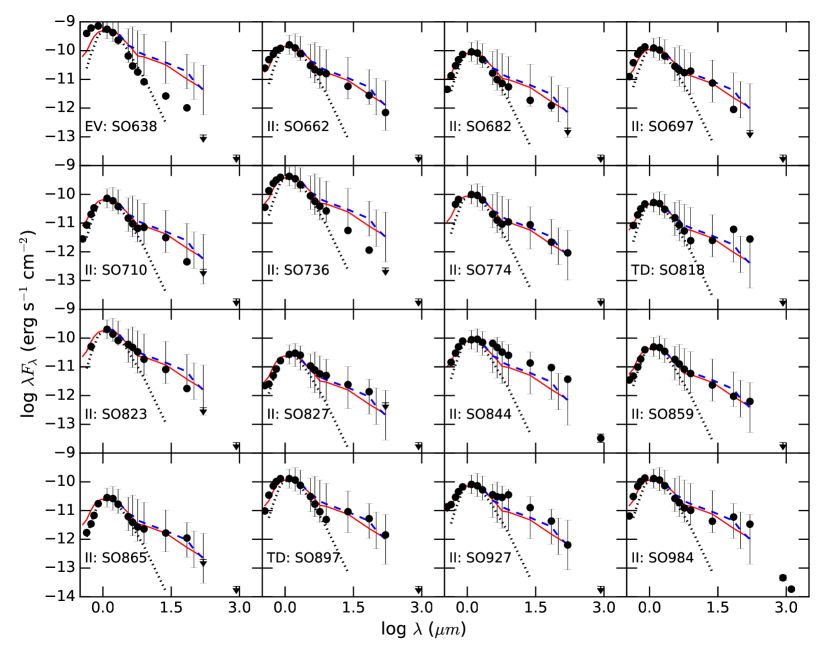
We constructed the spectral energy distributions (SEDs) for all of our targets using optical B, V, R and I magnitudes (when available), 2MASS, Spitzer IRAC and MIPS photometry taken from H07a, and adding photometry data from Herschel PACS at 70 and 160 m, reported here. We have added submillmeter data from Williams et al. (2013) for four of our PACS sources: SO540, SO844, SO984 and SO1153. The SEDs of our objects are shown in Figure 3 (filled dots).
Figure 3 also shows the Ori median, normalized to the J band of each object, for stars with PACS detections (solid red line). The median values and the first and third quartiles are in Table 4. As reference we show the Taurus median estimated from photometric data only (dashed line) with quartiles. To estimate the photometric Taurus median we used J, H and K 2MASS photometry from Hartmann et al. (2005), Spitzer IRAC and MIPS photometry from Luhman et al. (2010) and PACS 70, 100 and 160 photometry from Howard et al. (2013), with a total number of 21 stars for the calculation, covering a spectral type range from K3 to M4 (Table 5). This median was corrected for extinction using the Mathis reddening law (Mathis 1990, = 3.1) with from Furlan et al. (2006). The dotted line represents the median SEDs of non-excess stars in the Ori cluster (H07a).
The photometry of the PACS sources was corrected for extinction using the Mathis reddening law (Mathis 1990, = 3.1) with visual extinctions Av from H14. In Figure 3 each panel is labeled with the ID of the source and its classification, according to the IR excess they exhibit. We based the classification of stars with different IR excess emission, in the value of the IRAC SED slope determined from [3.6] - [8.0] color (n3.6-8.0), following H07a. In this scheme, class II stars are defined as systems with n3.6-8.0 (e.g. SO1036, SO396 and SO562, where IRAC IR excesses are comparable to the median SED of Taurus); stars with IRAC IR excesses above the photosphere and with n3.6-8.0 are termed here as evolved (EV) disks (like SO638, where its IRAC IR excesses fall below both medians); and systems without any excess emission, below the photospheric limit, are called class III stars. Objects that are classified as class III stars or EV disks by their IRAC IR excess but that exhibit strong 24 excesses are known as transitional disks, which is the case of SO299, SO818 and SO897.
4 Properties of Ori sources
4.1 Characterization of PACS Sources
As shown in Figure 2, 142 TTS in Ori (H07a) fall in the PACS FOV but only 23% of them are detected. Here we compare the detections with the entire TTS population in the field aiming to understand what makes them different.
The left panel of Figure 4 shows the PACS 70 detections in the [3.6]-[4.5] vs [5.8]-[8.0] diagram, as well as all the Ori sources in the PACS field. Sources around [0,0] are referred as diskless stars while PACS detections are identified following the disk classification of H07a. Note that most of the PACS detected sources are inside the rectangle that encompasses the optically thick disks region (Hartmann et al., 2005; D’Alessio et al., 2006) and are considered CTTSs. This is consistent with the shape of their SEDs and their similarities with the Taurus median (Figure 3). Excluding the TD/PTDs and the two evolved disks in our sample, which have a decrease of IR excess on the IRAC bands and therefore will have lower colors than colors predicted by optically thick disks, four sources fall outside the loci of CTTSs: SO823, SO462, SO774, and SO927. The source SO823 has a low [5.8]-[8.0] color. The rest (SO462, SO774 and SO927) present higher [5.8]-[8.0] colors. The stars SO462 and SO774 seem to have a slightly decay on the first three IRAC bands (3.6, 4.5, 5.8 m) which cause an apparent redder [5.8]-[8.0] color
| Wavelength | log Fλ | ||
|---|---|---|---|
| (m) | Median | Lower | Upper |
| 0.44 | -10.84 | -11.35 | -10.42 |
| 0.55 | -10.50 | -11.04 | -10.19 |
| 0.64 | -10.33 | -10.77 | -10.03 |
| 0.79 | -10.18 | -10.56 | -9.89 |
| 1.235 | -10.07 | -10.28 | -9.89 |
| 1.662 | -10.08 | -10.32 | -9.93 |
| 2.159 | -10.25 | -10.48 | -10.10 |
| 3.6 | -10.60 | -10.84 | -10.24 |
| 4.5 | -10.78 | -11.07 | -10.44 |
| 5.8 | -11.00 | -11.25 | -10.54 |
| 8.0 | -11.04 | -11.28 | -10.70 |
| 24.0 | -11.30 | -11.59 | -11.04 |
| 70.0 | -11.81 | -12.00 | -11.32 |
| 160.0 | -12.15 | -12.45 | -11.84 |
| Wavelength | log Fλ | ||
|---|---|---|---|
| (m) | Median | Lower | Upper |
| 1.235 | -9.07 | -9.25 | -8.92 |
| 1.662 | -9.09 | -9.34 | -8.94 |
| 2.159 | -9.20 | -9.50 | -9.08 |
| 3.6 | -9.64 | -9.94 | -9.36 |
| 4.5 | -9.70 | -10.09 | -9.38 |
| 5.8 | -9.86 | -10.21 | -9.48 |
| 8.0 | -9.95 | -10.25 | -9.54 |
| 24.0 | -10.23 | -10.61 | -9.88 |
| 70.0 | -10.54 | -10.85 | -10.25 |
| 100.0 | -10.87 | -11.04 | -10.40 |
| 160.0 | -11.18 | -11.33 | -10.47 |
(note their high 8 fluxes resembling that of TDs/PTDs in our sample).
The source SO927 has a peculiar SED with very large near-IR and mid-IR
excesses.
The right panel in Figure 4 displays
the K-[5.8] vs
[8.0]-[24] SED slopes.
The slope of the SED
is defined as:
| (1) |
where and are the wavelength and the observed flux at that particular wavelength, respectively. This parameter has been used to classify YSOs (Lada et al. 1987, 2006; H07a). We also indicate the lower limit of primordial disks in Taurus (Luhman et al., 2010, dashed line). Photospheric limits are shown by dotted lines. H07a have classified the object SO540 as a class II star based on its slopes between 3.6 and 8.0 , however using the K-[5.8] and the [8]-[24] slopes indicate that it could be a TD candidate. Another interesting point to notice is the fact that one of our two evolved disks, the source SO615, appears just in the limit of primordial disks and has the lowest [8.0]-[24] color of the PACS sample. This may be the result of chromospheric contamination, which is more significant in evolved stars with low mass accretion rates, where magnetic activity from the chromosphere of the star may produce an extra heating of dust which is reflected at 5.8 m (Ingleby et al., 2013).
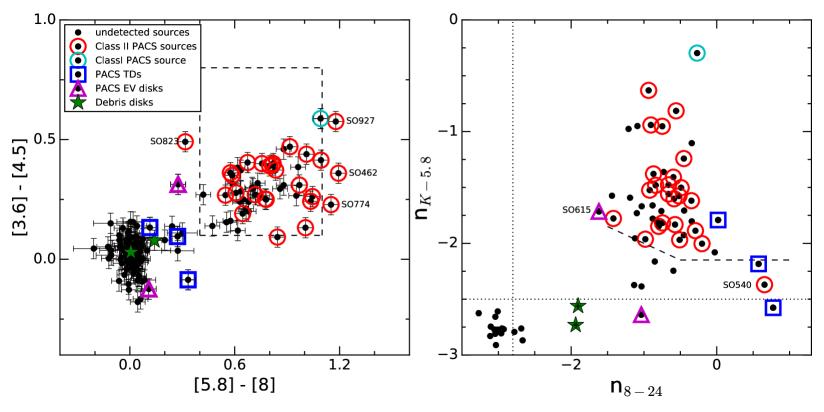
Figure 5 shows the [24] vs K-[24] color-magnitude diagram of Ori members highlighting our PACS disks. Also shown are the histograms of MIPS 24 (right) and of K-[24] color (top). As shown in the figure, our detections have the largest excesses at 24 , despite their similar near and mid IR colors with those of non detections (Figure 4), with an average magnitude of 5.65 that corresponds to a flux of 67.27 mJy. The lowest 24 magnitude detected corresponds to the source SO514 with a value of 8.3 mag. Non detections, on the other hand, present an average magnitude of 8.16. The source SO566 is a variable star with variability amplitude in J band larger than 2.7 magnitudes (H14) as can be seen in its non-contemporaneous SED in Figure 3, thus, its large K-[24] color is not real.
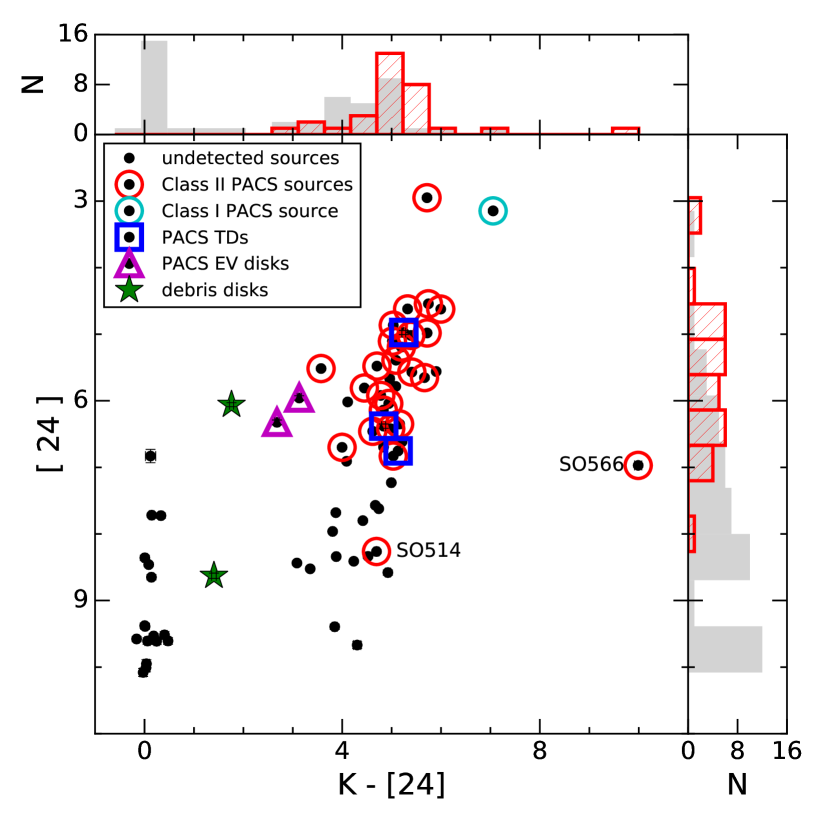
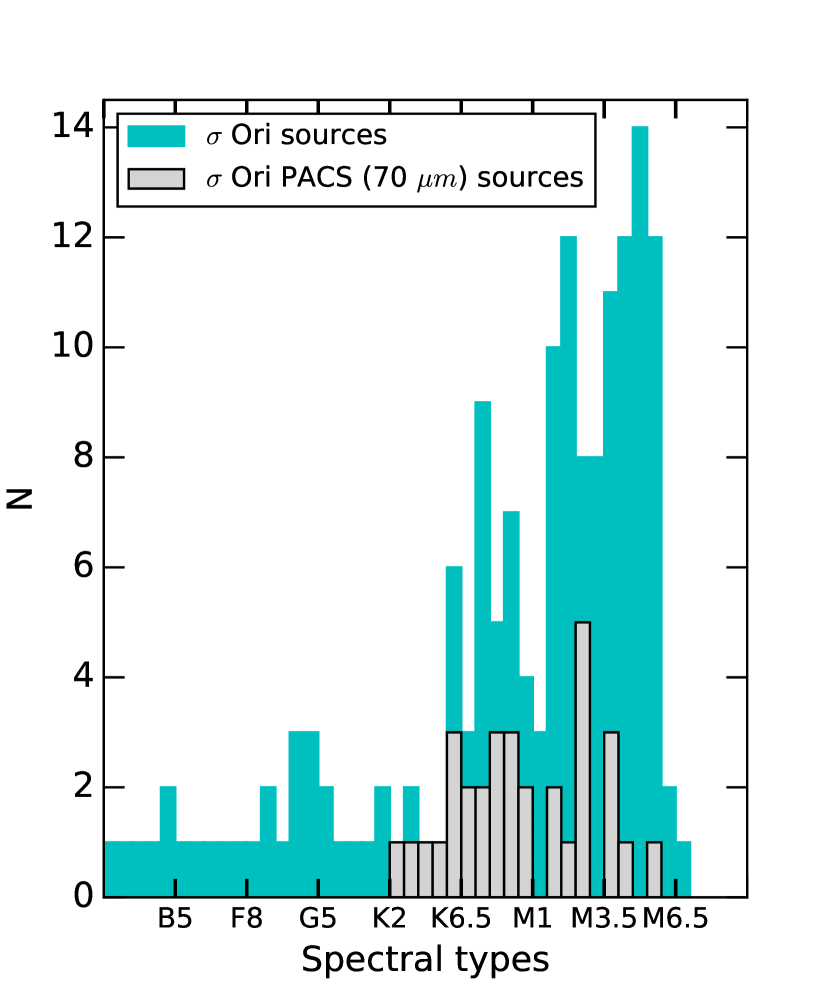
Figure 6 shows an histogram of spectral types for Ori members (H14). PACS 70 detections cover spectral types from K2.0 to M5.0. Objects with spectral types later than M5 are unlikely to be detected because the average flux at 70 m would be below the detection limit for more than a factor of 2 (§ 2). On the other hand, disk bearing stars with spectral types earlier than K0 have evolved disks with 24 m excesses below the medians of Taurus and Ori, and therefore 70 m fluxes below the detection limit, or are located out of the PACS FOV.
4.1.1 Transitional and Pre-transitional Disks Statistics
Statistical studies conducted by Muzerolle et al. (2010) in star forming regions with ages from 1 to 10 Myr have shown that the TDs fraction expected in young regions (1-2 Myr) is less that 2%, while for older regions (3 Myr) this fraction can be from 7 to 17%. However, Kim et al. (2013) estimated the TDs fraction in the Orion A star-forming region including PTDs and what they defined as WTDs -intermediate between TDs and PTDs and considered as systems with an optically thin inner disk separated by a gap from an optically thick outer disk- and found that the TDs fraction for clusters with ages 1 Myr can be quite high (11% - 25% for NGC 1333, 21% - 29% for ONC and 21% - 31% for L1641) and similar or greater than the fraction of Muzerolle et al. (2010) for clusters with ages between 1-2 Myr. Applying the exact test for the success rate in a binomial experiment (R-Statistical Software, Ihaka & Gentleman 1996), we find that the fraction of objects classified as TDs is 12.5%, with a 95% confidence interval of 0.035 - 0.290. The rather large uncertainty is due to the modest size of our sample, however, this result is consistent with the results of Muzerolle et al. (2010) for a region with an estimated age of Myr.
4.2 Stellar and Accretion Properties
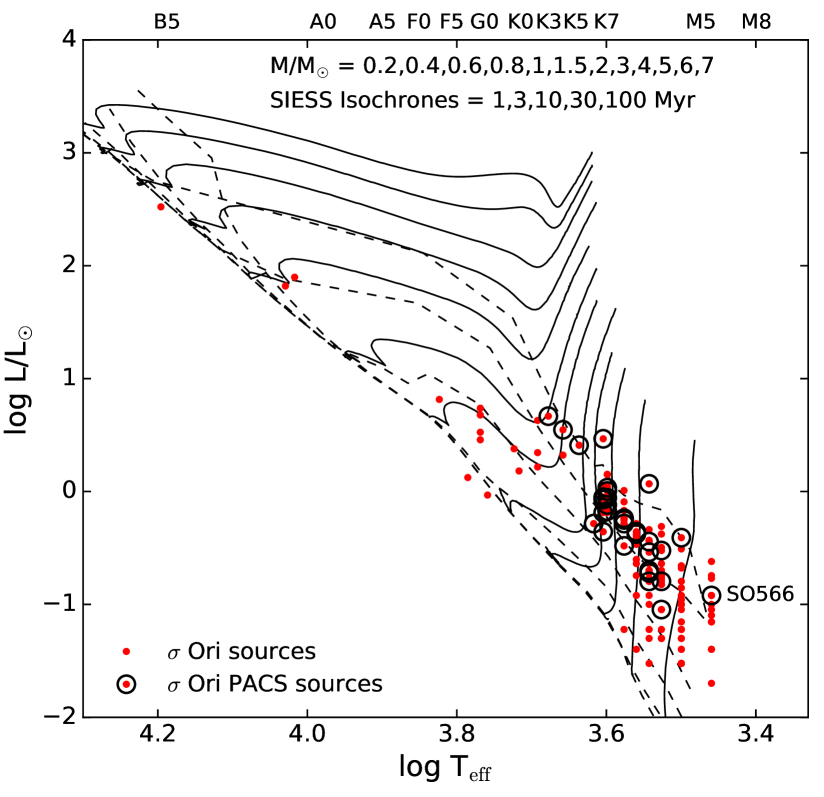
We estimated stellar and accretion properties of all the Ori members reported in H07a and H14 that lie inside the PACS FOV, for which we have the necessary spectra and photometry. This information complements the spectroscopic census of Ori sources made by H14. To characterize the stellar properties of the sources we located them in the HR diagram. For this, we estimated the luminosity of our sample using J and V photometry, visual extinctions and spectral types from H14. For stars F0 or later, bolometric correction and effective temperatures were obtained from the standard table for 5-30 Myr old pre-main sequence (PMS) stars from Pecaut & Mamajek (2013, table 6). For stars earlier than F0 we used the standard table of main sequence stars reported by Pecaut & Mamajek (2013, table 5). Using these luminosities and effective temperatures we estimated stellar radii for Ori members. We adopted the Mathis reddening law (Mathis 1990, = 3.1). We assumed a distance to the Ori cluster of 385 pc (Caballero, 2008).
The HR diagram for Ori members inside the FOV of PACS is displayed in Figure 7. Objects detected with PACS are, in general, late-type PMS stars, as discussed in section 4.1. Using the SIESS stellar models isochrones (Siess et al., 2000) we were able to calculate the age and mass of all our stars in the sample. Stellar properties are listed in Tables 2 and 3 for detected and undetected sources, respectively.
Mass accretion rates () were estimated from the line luminosity (Muzerolle et al., 2003, 2005; Ingleby et al., 2013; Rigliaco et al., 2012; Natta et al., 2004). The luminosity was estimated by approximating the flux of the line (FHα) as EW) x Fcont, where Fcont and EW) are the continuum flux around the line and the equivalent width, respectively. We calculated Fcont from the Rc magnitude of each source reported in H07a corrected by extinction, and the equivalent widths EW(H) from low resolution spectra reported in H14. Once the lines fluxes are estimated, the line luminosities are given by
| (2) |
where is the distance to the Ori cluster.
In order to obtain the accretion luminosities we used the relation between the H luminosity (LHα) and the accretion luminosity (Lacc) from Ingleby et al. (2013):
| (3) |
Finally, the Lacc can be converted into as
| (4) |
where and are the stellar mass and radius respectively. Three sources have no estimation of mass accretions rates since they do not have photometry at the band (SO540, SO566 and SO638).
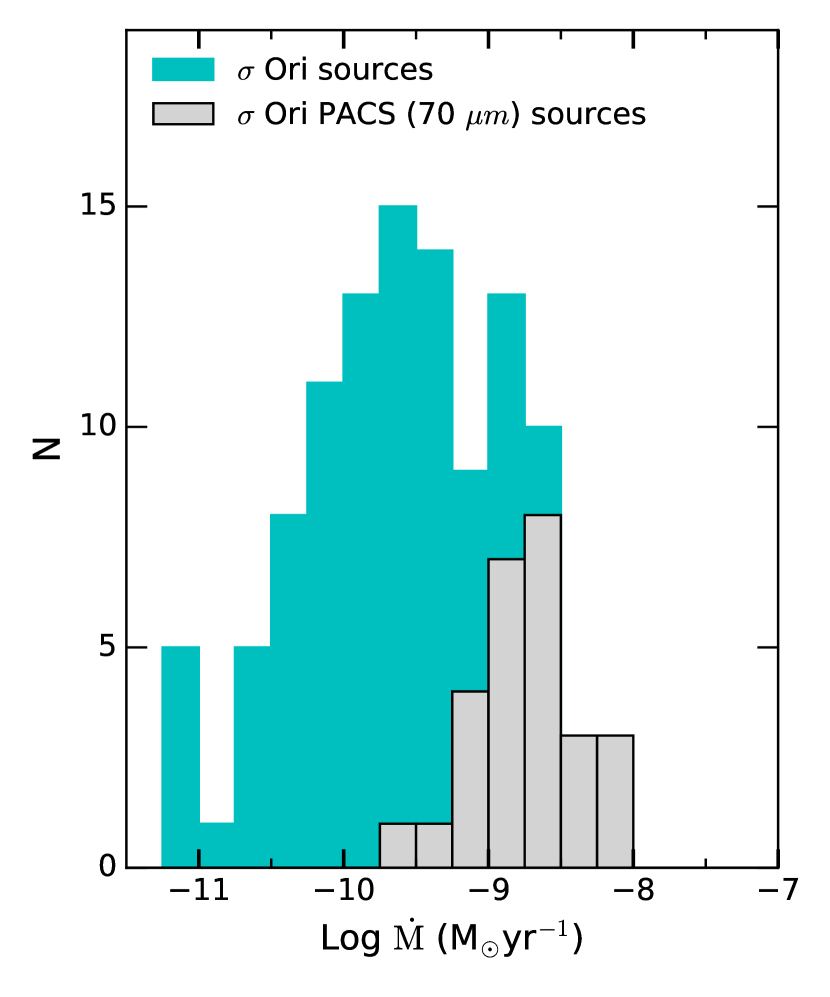
Figure 8 shows the histogram of the mass accretion rates for the Ori cluster. PACS (70 ) detections are plotted as gray bars while undetected sources as light blue bars. PACS detections exhibit . Note, however, that values of are unreliable because of chromospheric contamination as demonstrated by Ingleby et al. (2013), where an active chromosphere can mask all evidence of an accretion shock excess for the lowest accretors. Additionally, chromospheric activity adds uncertainty to the estimation of the luminosities of the lines associated with accretion, for low mass stars at later evolutionary stages (Manara et al., 2013). As noted in the figure, 23 undetected sources have , this is consistent with the discussion on Figure 4 and 5 where the undetected CTTSs in the PACS FOV are those with the lowest excesses at 24 m. Most of these sources constitutes the less massive and intrinsically weaker CTTSs in the cluster.
We compared our mass accretion rates with those reported by Rigliaco et al. (2011), who estimated from U band excesses. In general, our mass accretion rates are higher than Rigliaco’s. For the PACS sample we found that 10 out of 19 sources are consistent with the values reported by Rigliaco et al. (2011) within a factor less than 3, while for the undetected sources we got that 10 out of 16 sources agree within the same factor. Rigliaco et al. (2011) neglected extinction, but H07a found extinctions up to 2.94 magnitudes which can be significant at the U band. This can explain some of the discrepancies between their values and ours. Another source of uncertainty is due to the fact that mass accretion rates determined by the U band excess are not adequate for sources with because of chromospheric contamination (Ingleby et al., 2013), which is the case of several of our undetected sources. Therefore, we also compared our mass accretions rates with the ones reported by Rigliaco et al. (2012), who estimated from the H luminosities. Even though they also neglected extinction, accretions rates estimated by line luminosities are less affected by extinction effects than determined from U band excesses. We found that, for the six sources we have in common, all but one (SO490) agree within a factor 3. Gatti et al. (2008) used near-IR hydrogen recombination lines (Pa) to measure mass accretion rates of 35 objects in Ori . If we compare our mass accretion rates with Gatti’s we found that, for the 25 objects we have in common, all but three agree within a factor 3. The main uncertainties are due to the stellar mass adopted in each case, which in turn depends on the luminosity and the extinction of the sources, and on the spectral type.
All the accretion parameters of PACS sources are shown in Table 2. Additionally, Table 3 lists the accretion parameters for Ori members in the PACS FOV but without detections.
5 Results
In this section we examine the emission of the disks around the PACS sources in Ori and interpret it in terms of irradiated disk models including dust settling. We first make a global comparison of the spectral slopes in the PACS range with those predicted by irradiated disk models. We then model individual objects to provide a more detailed characterization of their disks. This detailed analysis of a fairly large number of disks in a young cluster, with estimated stellar and accretion parameters, will provide a census of disk properties useful for studies of the evolution of protoplanetary disks.
5.1 Disk Models
We follow the methods of D’Alessio et al. (2006) to calculate the structure and emission of accretion disk models. The main input parameters are the stellar properties (M∗, R∗, L∗), the mass accretion rate (), the viscosity parameter (), the cosine of the inclination angle (), disk outer radius (Rd), maximum grain size at the disk midplane (), and the dust settling; assumed constant throughout the disk.
The composition of the disk consists of amorphous silicates (pyroxenes) with a mass fraction of 0.004 and carbonates in the form of graphite with a mass fraction of 0.0025 (all these mass fractions are relative to gas). The PACS fluxes did not show a strong dependence on H2O abundance, so we kept this parameter fixed at . The dust disk inner edge or wall emission is calculated with the stellar properties, the maximum grain size (), and the temperature (Twall) assumed to be the sublimation temperature of silicate grains (1400 K) for the diffuse ISM (Draine & Lee, 1984; D’Alessio et al., 2006), with a dust composition entirely formed by pyroxenes.
To simulate the settling of dust, D’Alessio et al. (2006) considered the ideal case of two dust populations, which differ in grain size. Both populations follow a size-distribution function of the form ; where is the radius of the grain, whose minimum value is = 0.005 , and an exponent equal to 3.5, resembling the size-distribution found in the ISM. The first population corresponds to small grains with -characteristic of ISM dust- which is expected in unevolved disks. These grains are mostly located in the upper layers and are assumed to be well mixed with the gas throughout the disk. The second population consists of larger grains, = 1 mm, and lives in the disk midplane. As the settling process takes place on the disk, dust particles will leave the upper layer leaving behind a depleted small grains population, having a dust-to-gas mass ratio, , lower than the initial value, . On the other hand, the big grain population will have a dust-to-gas mass ratio, , larger than the initial value, since small dust particles being settled from upper layers will add mass to this population. Therefore, a decrease of automatically implies an increase (of the same proportion) of . We parametrize settling with the parameter , referred to as the dust-to-gas mass ratio and defined as , i.e., the mass fraction of the small grains relative to the standard value. Therefore, lower values of represent more settled disks.
5.2 Spectral indices
Since evolutionary effects, like dust settling and grain growth, are more apparent at longer wavelengths, we made plots of spectral indices using the PACS photometry reported here and IRAC and MIPS fluxes from H07a, in order to determine the overall degree of dust settling in our disks.
The left panel of Figure 9 displays the vs diagram for Ori members (solid circles). We compare the observed spectral indices with theoretical indices calculated for a set of models with the following parameters: , , K (all these parameters constitutes mean values in the cluster as shown in Tables 2 and 3) and two values of mass accretion rates (light blue symbols) and (red symbols), where the latter is a common value for Ori sources (Figure 8). We fixed the viscosity to a typical value of 0.01 (Hartmann et al., 1998). As we already said in section 4.2, we used a distance to the Ori cluster of 385 pc. Predicted spectral indices are indicated by open circles for models with = 250 AU, and plus signs for models with = 10 AU, where the size of the symbol varies according to the degree of dust settling, with larger symbols representing more settled disks (lower values of ). Squares and triangles account for TD/PTD disks and evolved disks, respectively. The scatter observed in each case represents the variety of properties like maximum grain size at the disk midplane, , the maximum grain size at the disk wall, , disk inclination angle, , disk external radius, , and ice abundances adopted in the models. A similar plot is shown in the right panel of Figure 9 for the spectral index in the x axis. As shown, models with different degree of settling populate different regions on this diagrams, being the more settled disks bluer than the less settled ones. Note as well the dependence in mass accretion rates on the slope. Models with = 10-9 have spectral indices as low as , while models with = 10-8 have indices higher than . As can be inferred from these diagrams, the majority of our objects falls in regions of 0.01, indicating that most of the Ori disks have significant degree of settling. In both cases (left and right panels of Figure 9) the indices and for a set of objects lay outside the region populated by the models. However, in §5.3 we modeled almost all of these outliers.
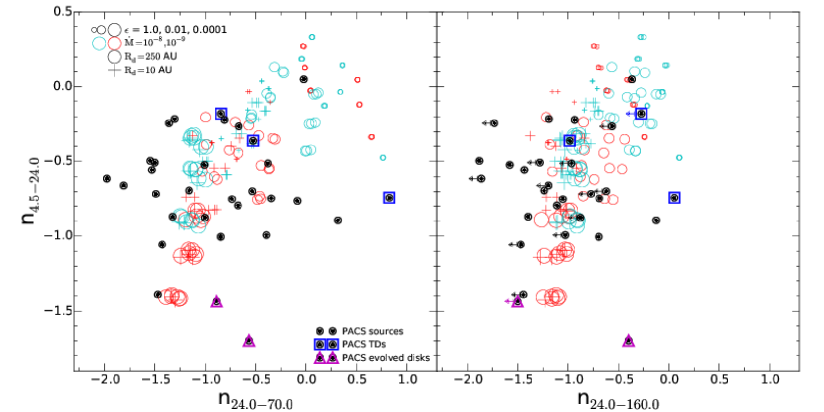
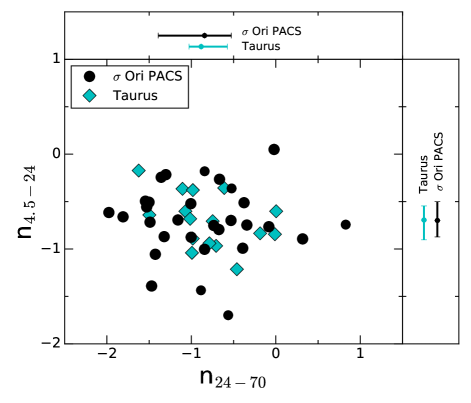
Figure 10 displays the vs spectral indices of Ori sources (black dots) compared to disks in Taurus (1-3 Myr, diamonds) from Howard et al. (2013); Luhman et al. (2010). Also shown are the medians and quartiles for the (top) and (right) indices of each region for comparison. The Ori sample has spectral indices similar to the population of Taurus.
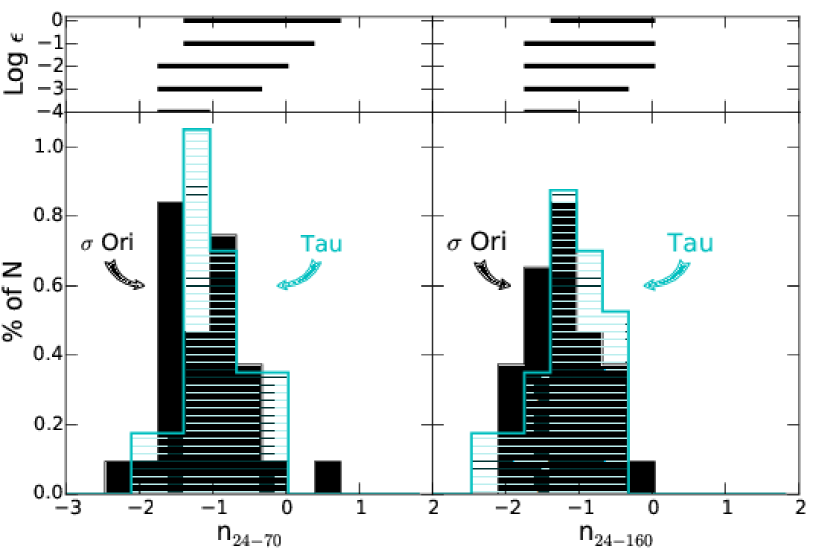
In order to inquire deeply on this subject as well as understand the degree of dust settling in the sample, we compared in Figure 11 histograms of observed and indices for Ori (black) and Taurus (light-blue) disks. The ranges of the spectral indices for the disks models shown on Figure 9, were plotted as bands on top of these figures for values of 1.0, 0.1, 0.01, 0.001 and 0.0001 from top to bottom. The Taurus histograms were made with MIPS 24 photometry from Luhman et al. (2010) while the PACS fluxes were taken from Howard et al. (2013), giving an overall average of 21 sources. As shown on the left panel, most of our objects have considerable degree of dust settling, since the peak of the histogram, labeled as Ori, falls at the same range as models with 0.01. A similar situation happens for the index, shown on the right panel. In this case, however, there is more overlap between ranges occupied by models with different degrees of settling. These results imply that disks in our sample have experienced some evolution over time. Note as well, how disks in Taurus have lower degree of dust settling, since the peaks of the Taurus histograms fall slightly to the right (bigger values of ) compared to a significant number of Ori sources with in the figures. This is consistent with previous studies of dust evolution where older disks are more settled and emit less IR excesses than young ones, which causes a decrease in the disk fraction as function of age for a given stellar group (H07a). It is important to note that, the fact that disks on Taurus already exhibit signs of dust settling indicates that this process must happen at an early evolutionary stage.
5.3 Modeling of Individual Objects
To better constrain the dust content in our PACS disks classified as class II stars and EV disks (the TDs will be studied in a future paper), we modeled the SEDs of individual objects with irradiated accretion disks models, using as input the stellar properties and accretion rates reported in Table 2, assuming a viscosity parameter and a distance to Ori of 385 pc (§ 4.2). For each object we calculated a total of 1800 disk models varying the outer radius (), the degree of dust settling (), the cosine of the inclination angle (), the maximum grain size at the disk midplane () and at the wall (). Table 6 lists all the relevant parameters. We assumed a maximum grain size at the disk upper layer of 0.25 m. We selected as best fit the model that yielded the minimum value of . Upper limits in the observed fluxes where excluded from the calculation of the value.
| Parameter | value |
|---|---|
| (AU)aaThe source SO697 needed a smaller (Table 7). ………………. | 10, 30, 50, 70, 100, 150, 200, 250, 300, 350 |
| ………………………….. | 1, 0.1, 0.01, 0.001, 0.0001 |
| ………………………….. | 0.3, 0.6, 0.9 |
| …………………….. | 100 , 1 mm, 10 cm |
| () ……………. | 0.25, 10 |
We modeled 18 sources out of 27 in the sample considered here (SO540 is taken as a TD, see section 4.1): 17 class II stars, and one EV disk. One of these objects, SO844, has mm detections taken with SCUBA-2 at 850 m and the rest, only have upper limits (Williams et al., 2013). Of the 9 stars not modelled in this work, the source SO984 also has observations at 1300 m taken with the SubMillimeter Array (Williams et al., 2013). This object exhibits a MIPS 24 m flux lower than the expected for class II stars (see Figure 3) resembling that of PTDs, so it will be model, separately, in a future work. The rest are objects with significant uncertainties in their estimations of extinction and spectral types or objects without mass accretion rates (§ 4.2), so they were not modeled here.
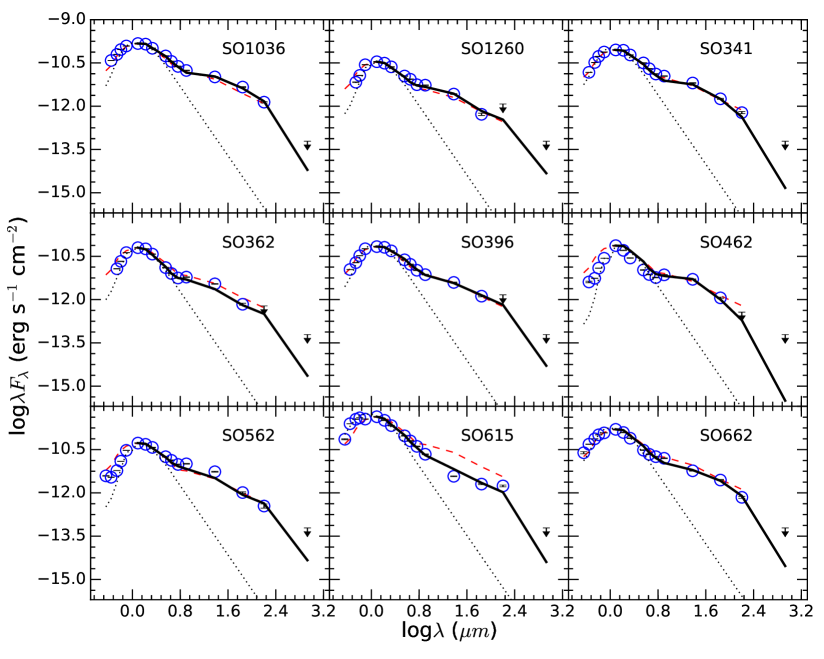
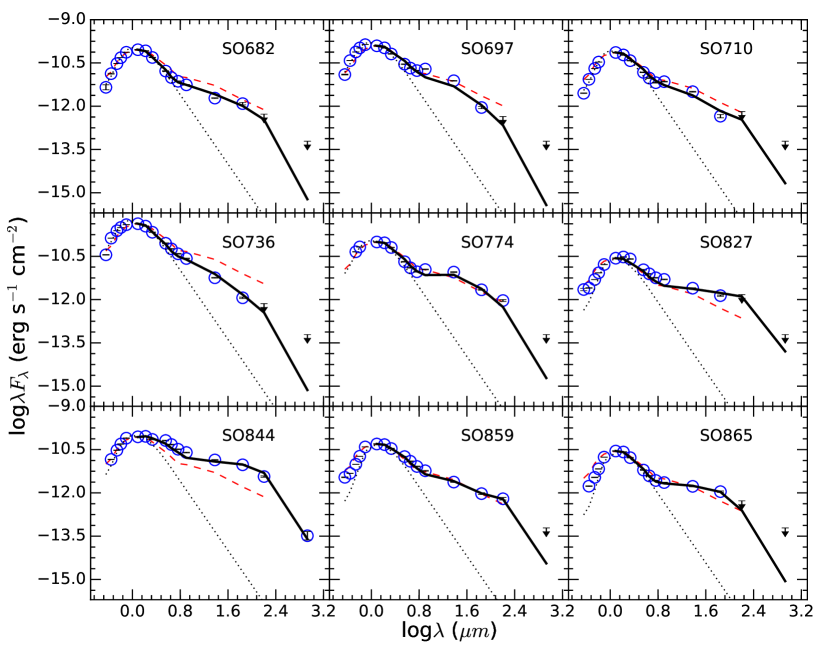
Figure 12 shows the SEDs of our PACS disks (open circles) with the resulting fit (solid lines). Dashed lines indicate the Ori median (Table 4). Photospheric fluxes, using the colors of Kenyon & Hartmann (1995), are indicated by dotted lines. Table 7 gives the parameters of the best fit model for each object with its corresponding reduced value () in the following order: target name, disk outer radius (), disk outer radius confidence interval (), degree of dust settling (), cosine of the inclination angle (), maximum grain size at the disk midplane (), maximum grain size at the wall (), disk mass () and disk mass confidence interval ().
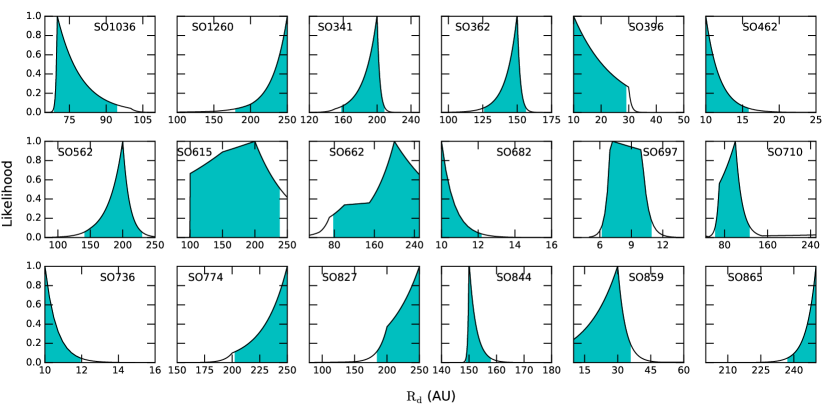
In order to calculate confidence intervals of the outer radius of the disks, we first estimated the likelihood function, , which is related to the values through the expression . Since is a multidimensional function, at every radius we have several values of , one for each one of the calculated models. Thus, the likelihood is computed using the minimum value at each radius. In Figure 13 we show plots of the normalized likelihood as a function of radius for all the 18 sources that were successfully modeled. We have restrained the axis around the maximum peak in each case in order to better visualize the likelihood function. As usual, the confidence intervals of are given as those radii and at which the area below the likelihood curve is 95% of its total area (Sivia & Skilling, 2012). These intervals are indicated by light-blue shaded regions in each panel and are reported in column 3 of Table 7. For those cases where the best radius falls on one of the edges of the range of radii used in the models, we have considered these values as upper or lower limits, and are indicated by parenthesis instead of square brackets in Table 7. On the other hand, since the mass of the disk is a parameter that correlates with size, the confidence intervals of the mass are given as the values of the mass given by the best fit model at and . These values are reported in column 9 of Table 7.
Some sources have peculiar SEDs: SO844 shows strong excess emission from the mid-IR to the far-IR, particularly in all four IRAC bands. This is probably due to variability. SO462, on the other hand, has a poor fit from H to IRAC 5.8 m, which significantly increases the value of ; it is worth noting that this source has the largest (=2.94, see Table 2). Finally, SO697 needed a smaller radius than the other sources ( = 7 AU). This is due to its low flux at 70 m combined with one of the lowest 160 m upper limits. Therefore, any disk model with an outer radius greater than 7 AU will overestimate the flux at 70 m and will produce a flux greater than the upper limit at 160 m.
We point out, that we used the values of as a guide in order to obtain the model that provides the best fit to the photometry of each source. However, the values of are expected to be large. One of the most problematic points to fit is the IRAC 8 m band. In a real spectrum, this band contains a contribution of the 10 m silicate feature. The total flux of this feature is highly dependent on the adopted composition of the silicates, as detailed modeling of IRS spectra have shown (cf. McClure et al. 2012, 2013a). However, we felt that one photometric point did not give enough constraints to justify having the silicate composition as an additional parameter. Another reason for the large values of is that we are only including the errors in the photometry, which are small, and do not include other sources of uncertainty such as the inherent uncertainties in the distance, luminosity, spectral types, and mass accretion rates. In a forthcoming paper we will model these sources including their IRS spectra, in order to characterize their silicate features, which will improve the current fit. Through this study we will characterize the inner parts of the disk in the sense of grain grow, dust processing and types of silicates present in the disks.
| Target | - | - | |||||||
|---|---|---|---|---|---|---|---|---|---|
| (AU) | (AU) | () | () | () | |||||
| SO1036 | 70 | [69 - 94] | 0.01 | 0.3 | 10 cm | 10 | 5.19 | [4.78 - 6.10] | 6.116 |
| SO1260 | 250 | [180 - 250) | 0.0001 | 0.9 | 100 | 10 | 3.11 | [2.57 - 3.11) | 14.33 |
| SO341 | 200 | [158 - 208] | 0.01 | 0.6 | 10 cm | 10 | 1.24 | [1.05 - 1.34] | 24.784 |
| SO362 | 150 | [126 - 156] | 0.0001 | 0.9 | 100 | 0.25 | 1.01 | [0.91 - 1.11] | 31.489 |
| SO396 | 10 | (10 - 29] | 0.01 | 0.3 | 100 | 10 | 1.15 | (1.15 - 2.46] | 2.040 |
| SO462 | 10 | (10 - 16] | 0.01 | 0.9 | 10 cm | 0.25 | 0.098 | (0.09 - 0.14] | 265.259 |
| SO562 | 200 | [142 - 229] | 0.0001 | 0.9 | 100 | 10 | 2.70 | [2.24- 3.26] | 55.817 |
| SO615 | 200 | [100 - 238] | 0.0001 | 0.9 | 100 | 10 | 1.25 | [0.68 - 1.49] | 51.825 |
| SO662 | 200 | [79 - 250] | 0.001 | 0.9 | 10 cm | 10 | 2.44 | [1.32 -2.91] | 52.388 |
| SO682 | 10 | (10 - 12] | 0.01 | 0.6 | 1 mm | 0.25 | 0.031 | (0.028 - 0.035] | 14.469 |
| SO697 | 7 | [6 - 11] | 0.01 | 0.6 | 10 cm | 10 | 0.11 | [0.10 - 0.16] | 110.766 |
| SO710 | 100 | [63 - 126] | 0.0001 | 0.9 | 100 | 10 | 0.69 | [0.45 - 0.85] | 44.761 |
| SO736 | 10 | (10 - 12] | 0.001 | 0.3 | 10 cm | 0.25 | 0.22 | (0.22 - 0.27] | 27.975 |
| SO774 | 250 | [203 - 250) | 0.01 | 0.9 | 10 cm | 10 | 1.68 | [1.43 - 1.68) | 47.192 |
| SO827 | 250 | [185 - 250) | 0.01 | 0.6 | 100 | 10 | 4.94 | [3.90 - 4.60) | 34.874 |
| SO844aaObject with SCUBA-2 850 m photometry from Williams et al. (2013). | 150 | [149 - 158] | 0.1 | 0.6 | 10 cm | 10 | 39.40 | [39.40 - 43.70] | 48.159 |
| SO859 | 30 | [10 - 36] | 0.01 | 0.3 | 100 | 10 | 0.47 | [0.23 - 0.57] | 16.131 |
| SO865 | 250 | [237 - 250) | 0.01 | 0.9 | 10 cm | 0.25 | 0.85 | [0.77 - 0.85) | 3.450 |
Note. — Column 1: ID following H07a; Column 2: disk outer radius; Column 3: disk outer radius confidence interval; Column 4: degree of dust settling; Column 5: cosine of the inclination angle; Column 6: maximum grain size at the disk midplane; Column 7: maximum grain size at the disk wall; Column 8: disk mass; Column 9: disk mass confidence interval; Column 10: value of the fit.
The flux in the mid IR is mostly dictated by the mass accretion rate and the inclination, since for settled disks a large fraction of the flux arises in the innermost disk regions. For instance, 80% the flux at 24 m and shorter wavelengths arises inside 2 AU for a disk with = 0.001, instead of 20 AU for a well mixed disk (D’Alessio et al., 2006; McClure et al., 2013b). In addition, as settling increases the depleted upper layers become optically thin, exposing the disk midplane. Therefore, highly settled disks are colder and radiate less than disks with low degree of settling (D’Alessio et al., 2006). We found that most of our objects (60%) can be explained by a significant degree of dust settling, , consistent with studies in young regions like Taurus and Ophiuchus (Furlan et al., 2006; McClure et al., 2010). We also found that some of our objects have an even higher degree of dust settling (), which, in turn, is consistent with previous studies of disk frequency as a function of age in different young stellar populations (H07a).
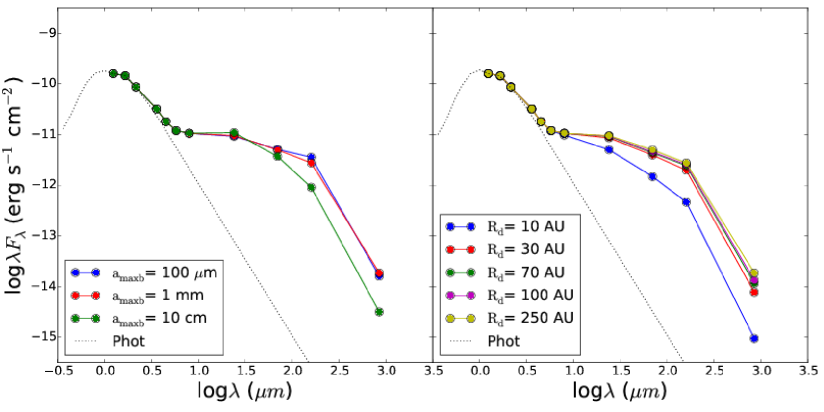
The dependence of the flux with has been discussed by D’Alessio et al. (2001). Even though we found 9 sources to have = 100 m (Table 7), the left panel of Figure 14 shows that models with = 0.01 and 1mm only differ by less than 10%, factor that is even smaller for = 0.0001, so we cannot discriminate sizes of 1 mm. The right panel, on the other hand, shows the effects of changing the disk radius on the SED. As expected, smaller disks produced steeper mid and far-IR slopes and lower fluxes. Differences in disks radii are more apparent for AU. We found that 61% of our objects can be modeled with large sizes, AU. The rest, have dust disk radii less than 80 AU. Note how changes in affects the SED from MIPS 24 m to mm wavelengths while changes in are only apparent beyond 24 m.
We found no correlation between the mass accretion rate and the degree of dust settling. The disks with highest and lowest mass accretion rate in our sample have . This seems to imply that the turbulence expected in the high accretors is not influencing the vertical distribution of dust in disks, which is contrary to expectations.
6 Discussion: Disk evolution in the Ori cluster
6.1 Disk properties
We have obtained detailed disk structures for 18 disks in the Ori cluster using irradiated accretion disk models (D’Alessio et al., 2006), constrained by mass accretion rates estimated independently from optical spectra. As a result of our modeling, we inferred disk masses and radii, assuming a gas-to-dust ratio close to that of the ISM. The masses of the best fit models are given in Table 7; most of the masses are of the order of to 10-4 M⊙. By analyzing possible degeneracies in SED fitting using a set of 1800 generic models with different parameters, we estimated that the uncertainty in the inferred disk masses is a factor of 3, if the mass accretion rate of the sources are known.
Our mass determinations are consistent with those inferred by Williams et al. (2013) from 850 m SCUBA-2 observations. Williams et al. (2013) detected 9 disks, but only five of these lie inside the FOV of our PACS observations. Four of these sources (SO540, SO844, SO984 and SO1153) were detected at 70 and 160 m. The only source not detected, SO609, is a class III star (H07a). Of the detections, SO1153 is a class I star, as seen in Figure 3, and it was not modeled here. Similarly, the source SO984 will be modeled in a future work together with other TDs such as SO540 (see section 5.3). The SED and best-fit model for the source SO844 is shown in Figure 12 with inferred properties in Table 7. The disk mass for this object, 39 MJup, is a factor of 8 higher than the mass estimated by Williams et al. (2013). The reason for this is that our dust grain opacity () at 850m for this object is significantly lower than them. Unlike Williams et al. (2013), which assumed a dust opacity of , we used a consistent opacity law (estimated through detailed modeling of the SEDs) for each one of our objects. This opacity depends on the mix of materials assumed in our disk models (silicates, graphite, water, etc), their abundances and their grain size distributions. Therefore, each object has a distinct disk dust opacity. With our dust opacity we can reproduce not only the flux at 850 m, but the entire SED (cf. Figure 12).
Figure 15 shows the disk mass distribution for our Ori sources in black compared to the mass distribution found by Williams et al. (2013) in red. Our detections include significantly lower values than the Williams et al. (2013) survey. The fact that we have detected 24 more sources than Williams et al. (2013) inside the FOV of their observations, indicates that the PACS photometry was more suitable for detecting even small young disks than the shallow submillimeter observations. However, since our longest wavelength is 160m, we may be missing emission from the largest grains and underestimating our masses. Our models are consistent with the upper limits of the 850 m SCUBA-2 observations (Figure 12), which suggests that the mass deficit is not large. Moreover, Williams et al. (2013) reported a 3 limit of , so their non detections imply disks masses 5 , a value that is very similar to the upper limit of our disks masses for sources not detected with mm observations (5.5 , source SO1036. See Table 7). This supports the fact that we are truly looking at disks with very low masses. More sensitive mm observations are still required to determine this mass deficit. In any event, the masses of the Ori disks besides SO844, range between 0.03 to 6 MJup, with 35% lower than 1 . Like Williams et al. (2013), we conclude that Jupiter scale giant planet formation must be complete in these objects, which indicates that either giant planets form in less than 3 Myr or that it is difficult to make them in clustered environments.
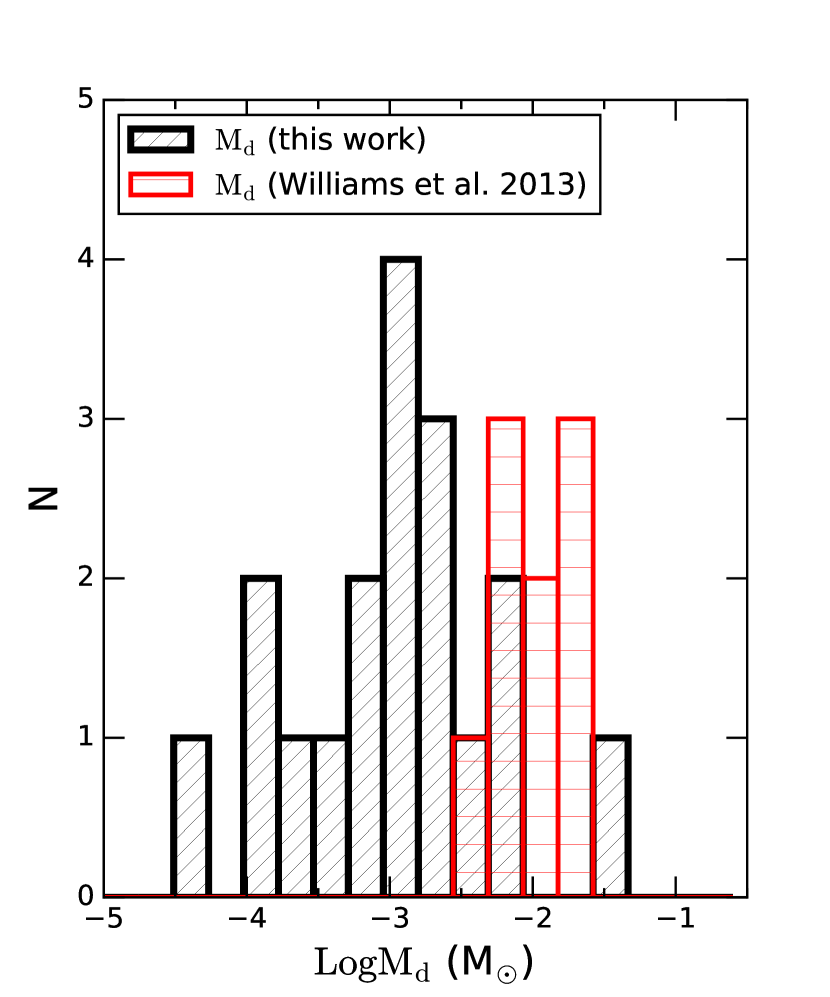
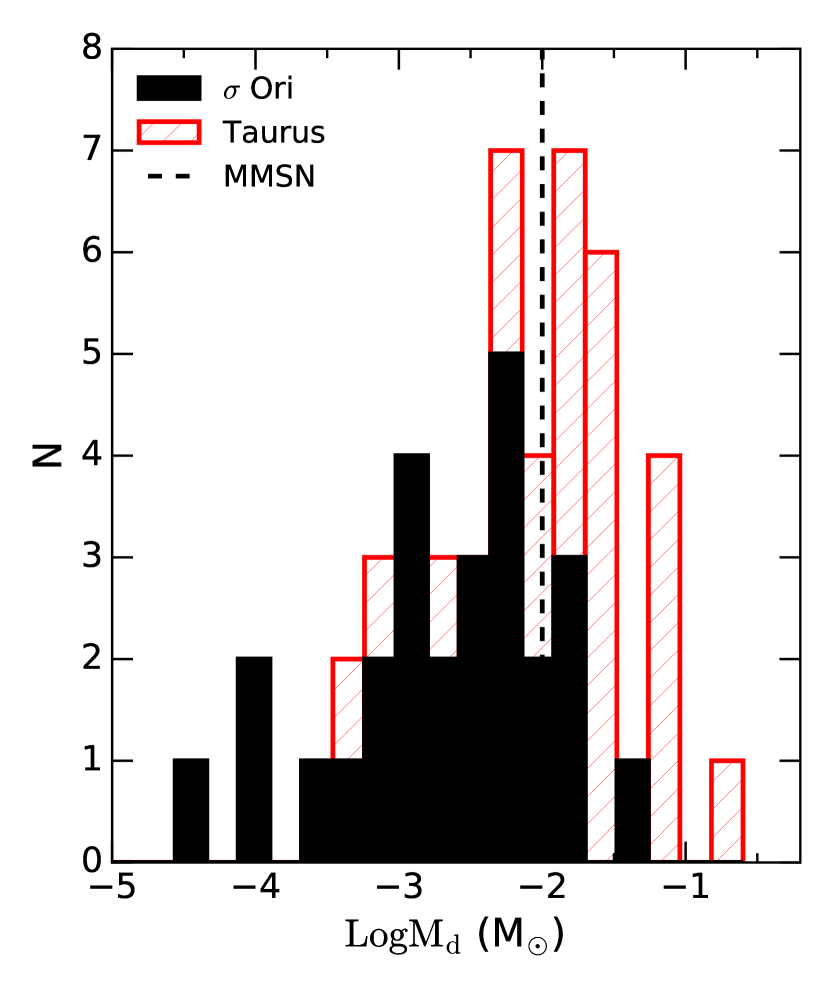
Figure 16 shows the disk mass distribution of Ori (our sample and Williams’) compared to that of Taurus. An overall decrease in disk mass is clearly seen. This behavior of disk mass with age is expected from viscous evolution (Hartmann et al. 1998). For instance, between 1-3 Myr, the ages of Taurus and Ori, the disk mass should decrease by a factor of 1.5. However, the disk sizes should correspondingly increase by a factor of 2.5, which we do not see (see next section and Table 7). One possibility is that these disks have been subject to radial drift, according to which the millimeter-size grains have drifted inwards and have piled up into pressure bumps, resulting in an observationally smaller dust disk (Birnstiel & Andrews, 2014; Pinilla et al., 2012b) an effect that may be at play in TW Hya (Andrews et al., 2012) and other disks (Panić et al., 2009; Pinilla et al., 2012a; Laibe et al., 2012; Rosenfeld et al., 2013; Zhang et al., 2014). Another possible explanation for the presence of small disks is due to interactions with stellar companions. This effect has been observed in Taurus for close binaries with separations 40 AU (Kraus & Hillenbrand, 2012). Multiplicity in Ori has been reviewed by Caballero (2014), where he notes that outside the central arcminute, only ten close binaries have been reported with angular separations between 0″.4-3.″0 (150-1200 AU). Of these, only two have been imaged with adaptive optics. In short, more high-resolution imaging surveys of close binaries in Ori are needed in order to determine if multiplicity is a main factor affecting the evolution of disks. Alternatively, these disks may have suffered the effects of photoevaporation, in which case both the dust and the gas have dissipated from the outer disk. We explore this possibility in the next section.
6.2 Disk photoevaporation in Ori
The age of the Ori cluster is estimated to be 3 Myr (H07a), older than Taurus (Kenyon & Hartmann, 1995, 1-2 Myr) or the ONC (Hillenbrand, 1997, 1 Myr). Therefore, Ori disks must have evolved relative to these younger clusters. By applying Kolmogorov-Smirnov (K-S) tests for the and spectral indices between disks in Taurus and Ori (see Figure 11), we found that the levels of significance for these indices are not small enough (compared to the statistics ) as to say that the distributions are intrinsically different (Table 8). However, testing differences in the inner parts of the disks between both distributions (using , and spectral indices), shows that, as the wavelength increases, the distributions become substantially different, such that for the case of the last index, , we can reject the null hypothesis that the samples are drawn from the same distribution (, Table 8). This may imply that dissipation due to nearby massive stars dominates in the Ori cluster, photoevaporating the outer disks, in contrast to the inside-out dissipation in regions without massive stars, like Taurus.
Since disks in Ori are accretion disks, with substantial mass accretion rates (§ 4.2), viscous evolution must also be at play. Two alternatives are then possible, isolated viscous evolution or viscous evolution mediated by external photoevaporation. To consider photoevaporation-mediated viscous evolution as a possibility, we must first consider its feasibility. To do so, we estimated the field intensity, , produced by the three brightest objects in the system, the Ori Aa,Ab (O9.5, B0.5) pair and Ori B (B0-B2) with a total mass of 44 (Simón-Díaz et al., 2015; Caballero, 2014). Using the reported stellar luminosities for these stars, and assuming that most of the stellar radiation is in the form of FUV photons, we estimated the intensity of the incident radiation at a given distance from the source:
| (5) |
where is the typical interstellar flux level with a value of 1.6 x 10⁻³ erg s-1 cm-2 (Habing, 1968), is the FUV luminosity of the Ori multiple system and the true distance to the ionizing sources. We used Montecarlo simulations to calculate the distribution of true distances to the center for a given impact parameter, and from this the expected distribution of , following Anderson et al. (2013).
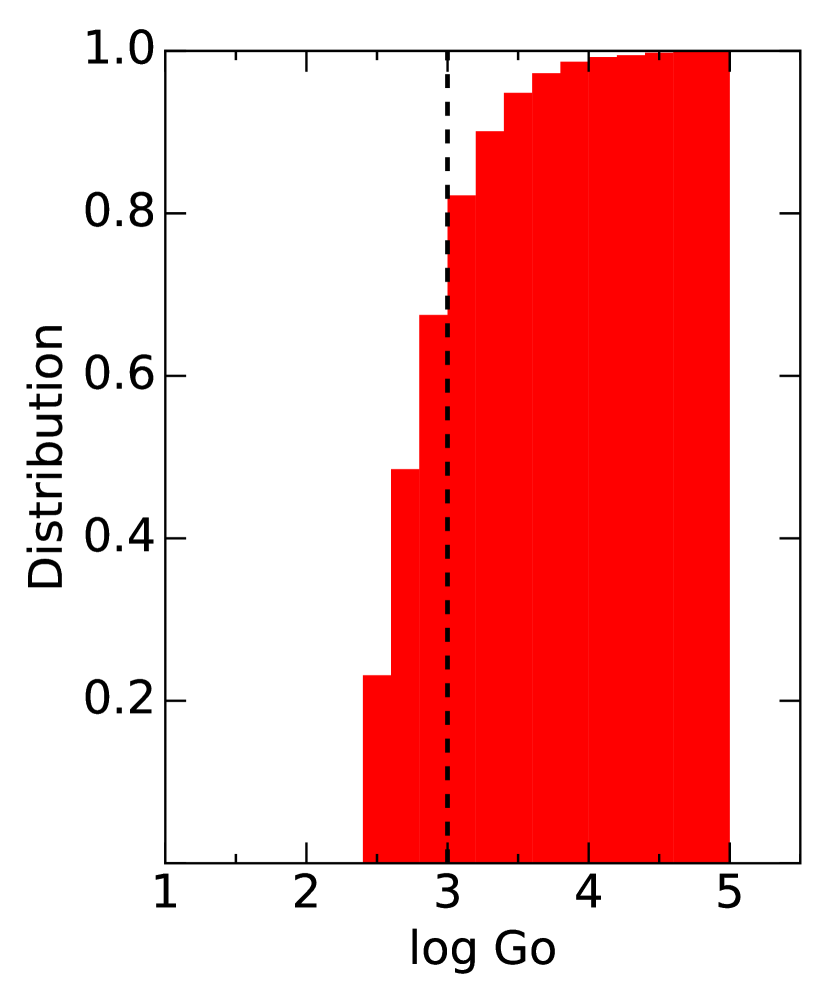
We obtained that 80% of our disks are exposed to flux levels of (see Figure 17). Even though these are modest values of , Anderson et al. (2013) show that even with values of external FUV radiation fields as low as , external photoevaporation can play a significant role by greatly reducing the lifetime of the disks, as well as truncating their outer edges. This is consistent with the fact that a third of our disks have radii 30 AU (see Table 7). As showed in §5.3 small radii can reliably be determined from the SED. These radii refer to the extent of the dust disk since we lack resolved gas observations, nevertheless, this result indicates that a possible explanation for the presence of small disks in populated regions is due to external photoevaporation by massive OB stars.
| index | D | p |
|---|---|---|
| 0.27 | 0.35 | |
| 0.19 | 0.77 | |
| 0.14 | 0.96 | |
| 0.24 | 0.37 | |
| 0.29 | 0.19 |
Even though there is no correlation between disk radii and projected distance, a result also found in the ONC proplyds (Vicente & Alves, 2005; Mann & Williams, 2010; Mann et al., 2014), our argument is reinforced by the fact that (a) two of our smallest disks, the sources SO697 ( AU) and SO682 ( AU), have the closest projected distances to the Ori multiple system (0.45 and 0.14 pc, respectively) (b) 81% of our largest disks (e.g. the sources SO774, SO865 and SO1260) are located at projected distances greater than 1 pc and (c) Most of the 850 m SCUBA-2 detections of Williams et al. (2013) are outside the PACS field, at distances pc from the central ionizing sources.
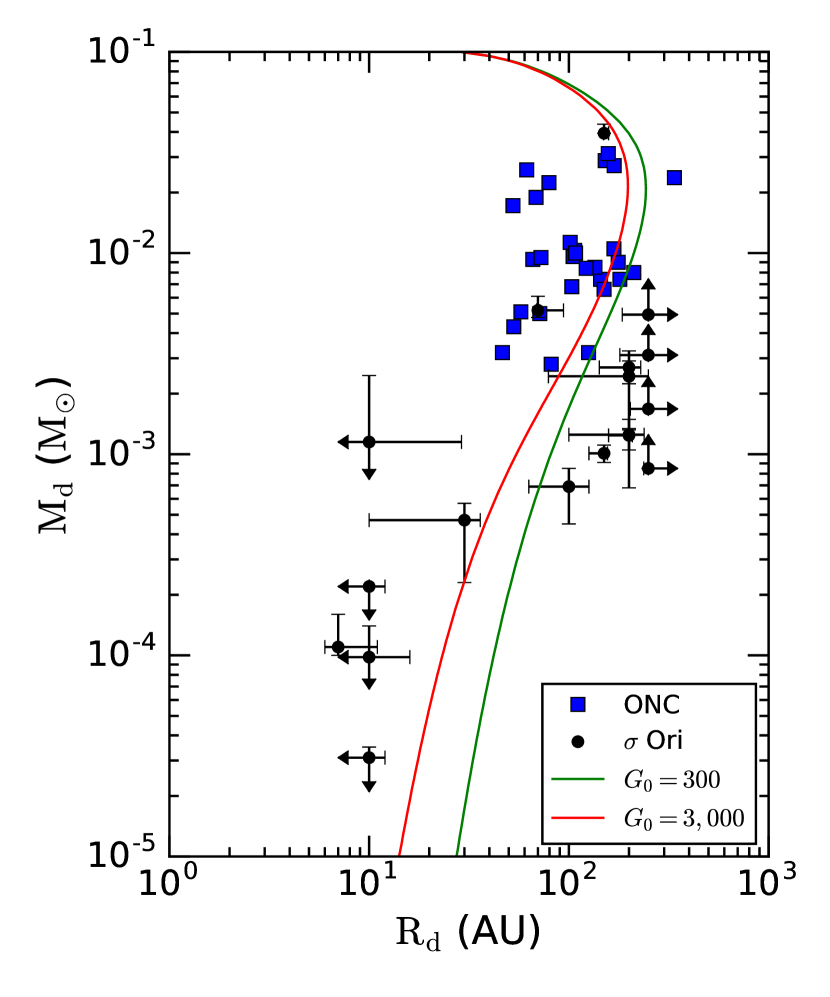
In Figure 18 we show our determinations of disk masses and radii in Ori compared to those of proplyds in the ONC. We have included in the figure the confidence intervals of and estimated in section 5.3. The disk masses for the ONC are taken from Mann & Williams (2010) and radii from Vicente & Alves (2005). We also show the expected evolution of viscous disks subject to photoevaporation from Anderson et al. (2013). Unlike isolated viscous evolution, in which disks expand as the disk mass increases, viscous disks subject to external photoevaporation first expand until they reach the evaporation radius where photoevaporation begins to act and to rip out the external disk regions. As a result, both the disk mass and radius decrease with age (Anderson et al., 2013). The Ori disks fit this trend. Their masses are lower than those of the ONC disks, since they are older, while their radii are comparable or smaller. The two models shown in Figure 18 correspond to values of , 300 and 3000, with the lower value corresponding to overall larger disk radii. This suggests that the shift between the ONC disks and the Ori disks may be due to the latter being subject to comparatively lower levels of FUV flux (which explains the slightly larger radii) for a longer period of time (which may explain the smaller radii). However, given that disk radii of proplyds were measured from HST/WFPC2 H images, and hence these values are related to the gaseous disks, and we estimated disk radii from modeling the SEDs, which are associated with the dusty disks, there are likely systematic differences between the two disk radius measurements done using very different methods. We need more sensitive mm observations of gas on these disks in order to make a more robust comparison.
The evolutionary models shown in Figure 18 assume a constant value of throughout the disk evolution. This in only an approximation since stars are not static, they orbit around the cluster center and therefore will experience different FUV flux levels during their lifetime. For very eccentric orbits the stars will stay longer in outer regions, where the FUV field is low, retaining their disk masses longer. Furthermore, these models assume a constant value of alpha; adopting a non-uniform radial profile for the viscosity alters the disk structure (Kalyaan et al., 2015), and therefore the mass-radius evolutionary tracks. We adopted a viscosity parameter of = 0.01. With this viscosity the disks are depleted down to very quickly ( 1Myr). Using a lower will increase the lifetime of the disks but will not produce disks as large as observed. Note that the timescale for disk dispersal depends strongly on the assumed disk viscosity, and therefore a relatively small range of alpha can lead to a wide range in the disk mass and radius at a given time. The models also assume an initial disk radius of 30 AU. In reality, disks will exhibit a wide range of radii depending on the initial conditions of the core where the stars are formed. However, Anderson et al. (2013) showed that varying the initial radius by a factor of two does not change the evolutionary tracks. Another approximation of the models is assuming a stellar mass of = 1 . Stars with smaller masses will produce shallower gravitational potential wells, allowing the unbound material to be located closer to the star, and possibly producing smaller disks. All these approximations may be responsible for the differences in radii observed between the models and disks in Ori. Finally, as mentioned above, the radial distribution of dust may differ from that of the gas. However, even with these simplifying assumptions, the models reproduce remarkably well the observations of the ONC and qualitatively well the Ori disks sample.
Additional support for the photoevaporative hypothesis comes from the presence of forbidden lines in the optical spectra of the disk sources. These lines are expected to form in a photoevaporating wind (Hartigan et al., 1995; Acke et al., 2005; Pascucci & Sterzik, 2009; Gorti et al., 2011; Rigliaco et al., 2009, 2012; Rigliaco et al., 2013; Natta et al., 2014). Rigliaco et al. (2009) found forbidden lines of [SII] and [NII] in high resolution spectra of SO587, located at pc. They associated these emission lines with a photoevapotaring wind estimated with a 10-9 . Unfortunately, we did not model this object because it was not detected with PACS.
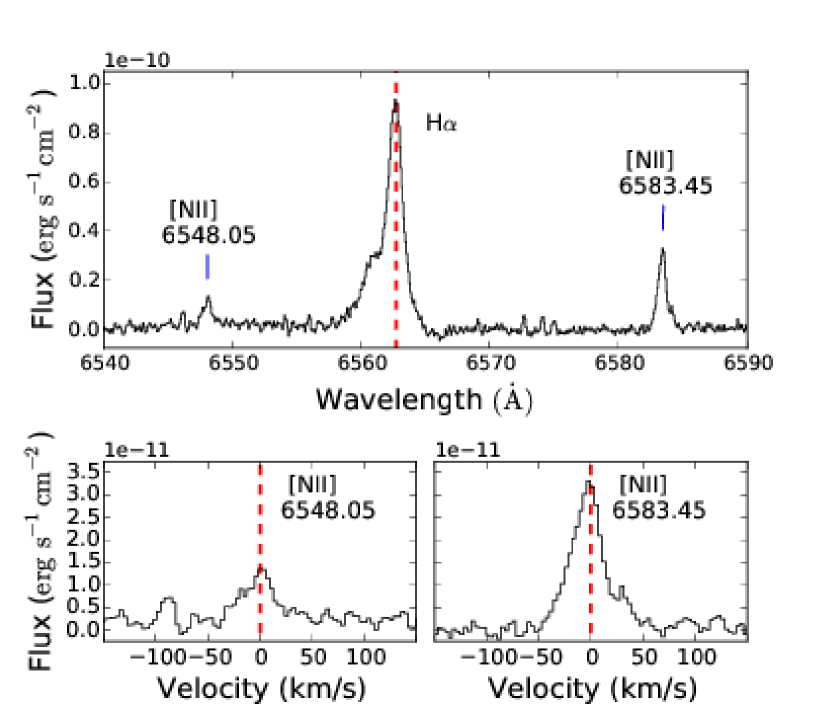
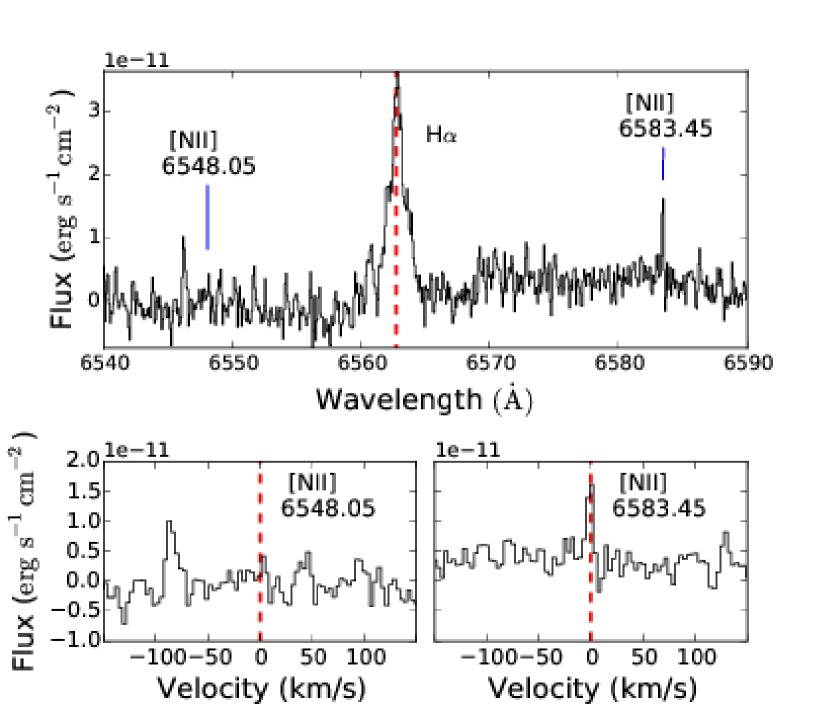
The survey of H14 includes high resolution spectra of some of the PACS sources; these spectra cover the region around H and include the [NII] 6548.05 and 6583.45 forbidden lines. Figure 19 displays on the top panel the spectrum of SO662 ( = 200 AU, ; Table 7) showing the H line in emission, characteristic of TTSs, and the forbidden lines of [NII]. This object is located at = 0.6 pc. On the bottom panel we also show the lines in velocity space. The blue-shift of these lines, if any, is smaller than 3 (our velocity determination error) consistent with the lowest blueshifts found in TTSs for the [OI] line (Rigliaco et al., 2013; Natta et al., 2014). The low velocity value indicates that the forbidden line emission does not come from a jet for which velocities range the hundreds of (Hartigan et al., 1995). Figure 20, on the other hand, shows the spectrum of SO697, our smallest disk ( = 7 AU, ; Table 7) located at = 0.45 pc. This object does not exhibit the [NII] forbidden line at 6548.05 and has a very weak emission at 6583.45 (bottom right panel). Similarly, none of our small disks with high resolution spectra (SO396, SO462 and SO859) show any emission lines of [NII].
Since strong optical forbidden emission lines are expected to form in highly ionized regions, as in the bright cusps characteristic of proplyds in the ONC, the fact that within the first 0.6 pc from Ori, one of our largest disks exhibits these lines while none of our small disks have any features, suggests that photoevaporation is in action in the cluster. If this is indeed the case, then SO662 is a photoevaporating disk in its initial phase while the small disks are those that moved close enough to the hot stars during the lifetime of the cluster to be stripped out of their outermost regions and hence cannot produce the forbidden lines. We need a greater sample of disks with high resolution spectra covering a range of projected distances from the central stars to confirm this hypothesis and characterize the region in the cluster being affected by photoevaporation.
7 Conclusions
We analyzed the IR emission of 32 TTSs (mostly class II stars) with PACS detections belonging to the Ori cluster located in the Ori OB1b subassociation. We modeled 18 sources using the irradiated accretion disk models of D’Alessio et al. (2006). Our main conclusions are as follows:
-
1.
PACS detections are consistent with stars surrounded by optically thick disks with high 24-µm excesses and spectral types between K2.0 and M5.0.
- 2.
-
3.
61% of our disks can be modeled with large sizes (R 100 AU). The rest, have dust disk radii of less than 80 AU. These disks may have been subject to photoevaporation. We estimated that 80% of our disks are exposed to FUV fluxes between 300 G 1000. These values may be high enough to photoevaporate the outer edges of the closer disks. Additionally, within the first 0.6 pc from the central ionizing sources we found forbidden emission lines of [NII] in SO662 ( AU) while none of the small disks exhibit any features. This suggests that the region producing the lines is located in the outer disk. Therefore, SO662 may be a photoevaporative disk in its initial phase while the small disks have already photoavaporated most of their material and hence cannot produce the [NII] lines.
-
4.
The masses of our disks range between 0.03 to 39 MJup, with 35% of the disks having masses lower than 0.001 M⊙, i.e., 1 Jupiter mass. These low masses suggest that the formation of giant planets is probably over in the cluster. If this is the case, then time scales for giant planet formation should be less than 3 Myr, or giant planets are difficult to form in clustered environments.
This work was supported by UNAM-PAPIIT grant number IN110816 to JBP. Model calculations were performed in the supercomputer Miztli, at DGTIC-UNAM. KM acknowledges a scholarship from CONACYT and financial support from CONACyT grant number 168251. JH acknowledges UNAM-DGAPA’s PREI program for visiting research at IRyA. We have made extensive use of NASA-ADS database.
References
- Acke et al. (2005) Acke, B., van den Ancker, M. E., & Dullemond, C. P. 2005, A&A, 436, 209
- Adams et al. (2004) Adams, F. C., Hollenbach, D., Laughlin, G., & Gorti, U. 2004, ApJ, 611, 360
- Adams et al. (1987) Adams, F. C., Lada, C. J., & Shu, F. H. 1987, ApJ, 312, 788
- Anderson et al. (2013) Anderson, K. R., Adams, F. C., & Calvet, N. 2013, ApJ, 774, 9
- Andrews & Williams (2005) Andrews, S. M., & Williams, J. P. 2005, ApJ, 631, 1134
- Alexander et al. (2006) Alexander, R. D., Clarke, C. J., & Pringle, J. E. 2006, MNRAS, 369, 229
- Anderson et al. (2013) Anderson, K. R., Adams, F. C., & Calvet, N. 2013, ApJ, 774, 9
- Andre & Montmerle (1994) Andre, P., & Montmerle, T. 1994, ApJ, 420, 837
- Andrews et al. (2012) Andrews, S. M., Wilner, D. J., Hughes, A. M., et al. 2012, ApJ, 744, 162
- Balog et al. (2014) Balog, Z., Müller, T., Nielbock, M., et al. 2014, Experimental Astronomy, 37, 129
- Barrado y Navascués et al. (2003) Barrado y Navascués, D., Béjar, V. J. S., Mundt, R., et al. 2003, A&A, 404, 171
- Birnstiel & Andrews (2014) Birnstiel, T., & Andrews, S. M. 2014, ApJ, 780, 153
- Bouwman et al. (2006) Bouwman, J., Lawson, W. A., Dominik, C., et al. 2006, ApJ, 653, L57
- Briceño et al. (2013) Briceño, C., Calvet, N., Anderson, K., et al. 2013, Protostars and Planets VI Posters, 46
- Briceño et al. (2007) Briceño, C., Hartmann, L., Hernández, J., et al. 2007, ApJ, 661, 1119
- Briceño et al. (2005) Briceño, C., Calvet, N., Hernández, J., et al. 2005, AJ, 129, 907
- Caballero (2007) Caballero, J. A. 2007, A&A, 466, 917
- Caballero (2008) Caballero, J. A. 2008, MNRAS, 383, 750
- Caballero et al. (2010) Caballero, J. A., Cornide, M., & de Castro, E. 2010, Astronomische Nachrichten, 331, 257
- Caballero (2014) Caballero, J. A. 2014, The Observatory, 134, 273
- Calvet et al. (2005) Calvet, N., D’Alessio, P., Watson, D. M., et al. 2005, ApJ, 630, L185
- Calvet et al. (2002) Calvet, N., D’Alessio, P., Hartmann, L., et al. 2002, ApJ, 568, 1008
- Carpenter et al. (2006) Carpenter, J. M., Mamajek, E. E., Hillenbrand, L. A., & Meyer, M. R. 2006, ApJ, 651, 49
- Carpenter et al. (2009) Carpenter, J. M., Mamajek, E. E., Hillenbrand, L. A., & Meyer, M. R. 2009, ApJ, 705, 1646
- Clarke (2007) Clarke, C. J. 2007, MNRAS, 376, 1350
- Daemgen et al. (2015) Daemgen, S., Jayawardhana, R., Petr-Gotzens, M. G., & Meyer, E. 2015, arXiv:1506.05132
- Dahm & Carpenter (2009) Dahm, S. E., & Carpenter, J. M. 2009, AJ, 137, 4024
- de Zeeuw et al. (1999) de Zeeuw, P. T., Hoogerwerf, R., de Bruijne, J. H. J., Brown, A. G. A., & Blaauw, A. 1999, AJ, 117, 354
- Draine & Lee (1984) Draine, B. T., & Lee, H. M. 1984, ApJ, 285, 89
- Dullemond et al. (2007) Dullemond, C. P., Hollenbach, D., Kamp, I., & D’Alessio, P. 2007, Protostars and Planets V, 555
- D’Alessio et al. (2001) D’Alessio, P., Calvet, N., & Hartmann, L. 2001, ApJ, 553, 321
- D’Alessio et al. (2005) D’Alessio, P., Hartmann, L., Calvet, N., et al. 2005, ApJ, 621, 461
- D’Alessio et al. (2006) D’Alessio, P., Calvet, N., Hartmann, L., Franco-Hernández, R., & Servín, H. 2006, ApJ, 638, 314
- Eisner et al. (2008) Eisner, J. A., Plambeck, R. L., Carpenter, J. M., et al. 2008, ApJ, 683, 304 P. R., Espaillat, C., Hartmann, L., & Calvet, N. 2010, ApJS, 186, 111
- Espaillat et al. (2014) Espaillat, C., Muzerolle, J., Najita, J., et al. 2014, Protostars and Planets VI, 497
- Espaillat et al. (2008) Espaillat, C., Calvet, N., Luhman, K. L., Muzerolle, J., & D’Alessio, P. 2008, ApJ, 682, L125
- Espaillat et al. (2007) Espaillat, C., Calvet, N., D’Alessio, P., et al. 2007, ApJ, 670, L135
- Facchini et al. (2016) Facchini, S., Clarke, C. J., & Bisbas, T. G. 2016, MNRAS
- Fischer et al. (2013) Fischer, W. J., Megeath, S. T., Stutz, A. M., et al. 2013, Astronomische Nachrichten, 334, 53
- Furlan et al. (2009) Furlan, E., Watson, D. M., McClure, M. K., et al. 2009, ApJ, 703, 1964
- Furlan et al. (2006) Furlan, E., Hartmann, L., Calvet, N., et al. 2006, ApJS, 165, 568
- García-Arredondo et al. (2001) García-Arredondo, F., Henney, W. J., & Arthur, S. J. 2001, ApJ, 561, 830
- Gatti et al. (2008) Gatti, T., Natta, A., Randich, S., Testi, L., & Sacco, G. 2008, A&A, 481, 423
- Gautier et al. (2008) Gautier, T. N., III, Rebull, L. M., Stapelfeldt, K. R., & Mainzer, A. 2008, ApJ, 683, 813
- Gorti et al. (2011) Gorti, U., Hollenbach, D., Najita, J., & Pascucci, I. 2011, ApJ, 735, 90
- Habing (1968) Habing, H. J. 1968, Bull. Astron. Inst. Netherlands, 19, 421
- Haisch et al. (2001) Haisch, K. E., Jr., Lada, E. A., & Lada, C. J. 2001, ApJ, 553, L153
- Hartigan et al. (1995) Hartigan, P., Edwards, S., & Ghandour, L. 1995, ApJ, 452, 736
- Hartmann (2009) Hartmann, L. 2009, Accretion Processes in Star Formation: Second Edition, by Lee Hartmann. ISBN 978-0-521-53199-3. Published by Cambridge University Press, Cambridge, UK, 2009.,
- Hartmann et al. (2005) Hartmann, L., Megeath, S. T., Allen, L., et al. 2005, ApJ, 629, 881
- Hartmann et al. (1998) Hartmann, L., Calvet, N., Gullbring, E., & D’Alessio, P. 1998, ApJ, 495, 385
- Henney & O’Dell (1999) Henney, W. J., & O’Dell, C. R. 1999, AJ, 118, 2350
- Hernández et al. (2014) Hernández, J., Calvet, N., Perez, A., et al. 2014, ApJ, 794, 36
- Hernandez et al. (2011) Hernandez, J., Calvet, N., Hartmann, L., et al. 2011, Revista Mexicana de Astronomia y Astrofisica Conference Series, 40, 243
- Hernández et al. (2010) Hernández, J., Morales-Calderon, M., Calvet, N., et al. 2010, ApJ, 722, 1226
- Hernández et al. (2008) Hernández, J., Hartmann, L., Calvet, N., et al. 2008, ApJ, 686, 1195
- Hernández et al. (2007a) Hernández, J., et al. 2007a, ApJ, 662, 1067
- Hernández et al. (2007b) Hernández, J., et al. 2007b, ApJ, 671, 1784
- Hillenbrand (1997) Hillenbrand, L. A. 1997, AJ, 113, 1733
- Hollenbach et al. (2000) Hollenbach, D. J., Yorke, H. W., & Johnstone, D. 2000, Protostars and Planets IV, 401
- Howard et al. (2013) Howard, C. D., Sandell, G., Vacca, W. D., et al. 2013, ApJ, 776, 21
- (62) Ihaka, R., & Gentleman R. 1996, J. Comput. Graphic. Stat., 5, 299–314
- Ingleby et al. (2014) Ingleby, L., Calvet, N., Hernández, J., et al. 2014, ApJ, 790, 47
- Ingleby et al. (2013) Ingleby, L., Calvet, N., Herczeg, G., et al. 2013, ApJ, 767, 112
- Johnstone et al. (1998) Johnstone, D., Hollenbach, D., & Bally, J. 1998, ApJ, 499, 758
- Kalyaan et al. (2015) Kalyaan, A., Desch, S. J., & Monga, N. 2015, ApJ, 815, 112
- Kenyon & Hartmann (1995) Kenyon, S. J., & Hartmann, L. 1995, ApJS, 101, 117
- Kim et al. (2013) Kim, K. H., Watson, D. M., Manoj, P., et al. 2013, ApJ, 769, 149
- Kraus & Hillenbrand (2012) Kraus, A. L., & Hillenbrand, L. A. 2012, ApJ, 757, 141
- Lada et al. (2006) Lada, C. J., et al. 2006, AJ, 131, 1574
- Lada (1987) Lada, C. J. 1987, Star Forming Regions, 115, 1
- Laibe et al. (2012) Laibe, G., Gonzalez, J.-F., & Maddison, S. T. 2012, A&A, 537, A61
- Lanz & Hubeny (2007) Lanz, T., & Hubeny, I. 2007, ApJS, 169, 83
- Lanz & Hubeny (2003) Lanz, T., & Hubeny, I. 2003, ApJS, 146, 417
- Luhman & Mamajek (2012) Luhman, K. L., & Mamajek, E. E. 2012, ApJ, 758, 31
- Luhman et al. (2010) Luhman, K. L., Allen, P. R., Espaillat, C., Hartmann, L., & Calvet, N. 2010, ApJS, 186, 111
- Manara et al. (2013) Manara, C. F., Testi, L., Rigliaco, E., et al. 2013, A&A, 551, A107
- Mann et al. (2014) Mann, R. K., Di Francesco, J., Johnstone, D., et al. 2014, ApJ, 784, 82
- Mann & Williams (2010) Mann, R. K., & Williams, J. P. 2010, ApJ, 725, 430
- Manoj et al. (2011) Manoj, P., Kim, K. H., Furlan, E., et al. 2011, ApJS, 193, 11
- Mathews et al. (2013) Mathews, G. S., Pinte, C., Duchêne, G., Williams, J. P., & Ménard, F. 2013, A&A, 558, A66
- Mathis (1990) Mathis, J. S. 1990, ARA&A, 28, 37
- Megeath et al. (2005) Megeath, S. T., Hartmann, L., Luhman, K. L., & Fazio, G. G. 2005, ApJ, 634, L113
- McClure et al. (2015) McClure, M. K., Espaillat, C., Calvet, N., et al. 2015, ApJ, 799, 162
- McClure et al. (2013a) McClure, M. K., D’Alessio, P., Calvet, N., et al. 2013, ApJ, 775, 114
- McClure et al. (2013b) McClure, M. K., Calvet, N., Espaillat, C., et al. 2013, ApJ, 769, 73
- McClure et al. (2012) McClure, M. K., Manoj, P., Calvet, N., et al. 2012, ApJ, 759, L10
- McClure et al. (2010) McClure, M. K., Furlan, E., Manoj, P., et al. 2010, ApJS, 188, 75
- McClure et al. (2008) McClure, M. K., Forrest, W. J., Sargent, B. A., et al. 2008, ApJ, 683, L187
- Megeath et al. (2005) Megeath, S. T., Hartmann, L., Luhman, K. L., & Fazio, G. G. 2005, ApJ, 634, L113
- Muzerolle et al. (2010) Muzerolle, J., Allen, L. E., Megeath, S. T., Hernández, J.,
- Muzerolle et al. (2005) Muzerolle, J., Luhman, K. L., Briceño, C., Hartmann, L., & Calvet, N. 2005, ApJ, 625, 906
- Muzerolle et al. (2003) Muzerolle, J., Hillenbrand, L., Calvet, N., Briceño, C., & Hartmann, L. 2003, ApJ, 592, 266 & Gutermuth, R. A. 2010, ApJ, 708, 1107
- Natta et al. (2014) Natta, A., Testi, L., Alcalá, J. M., et al. 2014, A&A, 569, A5
- Natta et al. (2004) Natta, A., Testi, L., Muzerolle, J., et al. 2004, A&A, 424, 603
- Olofsson et al. (2013) Olofsson, J., Szűcs, L., Henning, T., et al. 2013, A&A, 560, A100
- Ott (2010) Ott, S. 2010, Astronomical Data Analysis Software and Systems XIX, 434, 139
- O’dell & Wen (1994) O’dell, C. R., & Wen, Z. 1994, ApJ, 436, 194
- Panić et al. (2009) Panić, O., Hogerheijde, M. R., Wilner, D., & Qi, C. 2009, A&A, 501, 269
- Pascucci & Sterzik (2009) Pascucci, I., & Sterzik, M. 2009, ApJ, 702, 724
- Pecaut & Mamajek (2013) Pecaut, M. J., & Mamajek, E. E. 2013, ApJS, 208, 9
- Pinilla et al. (2012a) Pinilla, P., Benisty, M., & Birnstiel, T. 2012, A&A, 545, A81
- Pinilla et al. (2012b) Pinilla, P., Birnstiel, T., Ricci, L., et al. 2012, A&A, 538, A114
- Pinte & Laibe (2014) Pinte, C., & Laibe, G. 2014, A&A, 565, A129
- Rebull et al. (2010) Rebull, L. M., Padgett, D. L., McCabe, C.-E., et al. 2010, ApJS, 186, 259
- Press et al. (1992) Press, W. H., Teukolsky, S. A., Vetterling, W. T., & Flannery, B. P. 1992, Cambridge: University Press, —c1992, 2nd ed.,
- Rigliaco et al. (2013) Rigliaco, E., Pascucci, I., Gorti, U., Edwards, S., & Hollenbach, D. 2013, ApJ, 772, 60
- Rigliaco et al. (2012) Rigliaco, E., Natta, A., Testi, L., et al. 2012, A&A, 548, AA56
- Rigliaco et al. (2011) Rigliaco, E., Natta, A., Randich, S., Testi, L., & Biazzo, K. 2011, A&A, 525, A47
- Rigliaco et al. (2009) Rigliaco, E., Natta, A., Randich, S., & Sacco, G. 2009, A&A, 495, L13
- Riviere-Marichalar et al. (2013) Riviere-Marichalar, P., Pinte, C., Barrado, D., et al. 2013, A&A, 555, A67
- Rosenfeld et al. (2013) Rosenfeld, K. A., Andrews, S. M., Wilner, D. J., Kastner, J. H., & McClure, M. K. 2013, ApJ, 775, 136
- Roussel (2013) Roussel, H. 2013, PASP, 125, 1126
- Siess et al. (2000) Siess, L., Dufour, E., & Forestini, M. 2000, A&A, 358, 593
- Simón-Díaz et al. (2015) Simón-Díaz, S., Caballero, J. A., Lorenzo, J., et al. 2015, ApJ, 799, 169
- Smith et al. (2005) Smith, N., Bally, J., Shuping, R. Y., Morris, M., & Kassis, M. 2005, AJ, 130, 1763
- Sivia & Skilling (2012) D. S. Sivia. 2012, Data Analysis a Bayesian Tutorial: Second Edition, by D. S. Sivia & J. Skilling. ISBN 978-0-19-856832-2. Published by Oxford University Press, Oxford, UK, 2012.,
- Störzer & Hollenbach (1999) Störzer, H., & Hollenbach, D. 1999, ApJ, 515, 669
- Thi et al. (2010) Thi, W.-F., Mathews, G., Ménard, F., et al. 2010, A&A, 518, L125
- Uchida et al. (2004) Uchida, K. I., Calvet, N., Hartmann, L., et al. 2004, ApJS, 154, 439
- Vicente & Alves (2005) Vicente, S. M., & Alves, J. 2005, A&A, 441, 195
- Ward-Thompson et al. (2005) Ward-Thompson, D., Hartmann, L., & Nutter, D. J. 2005, MNRAS, 357, 687
- Watson et al. (2009) Watson, D. M., Leisenring, J. M., Furlan, E., et al. 2009, ApJS, 180, 84
- Williams et al. (2013) Williams, J. P., Cieza, L. A., Andrews, S. M., et al. 2013, MNRAS, 435, 1671
- Williams et al. (2005) Williams, J. P., Andrews, S. M., & Wilner, D. J. 2005, ApJ, 634, 495
- Zhang et al. (2014) Zhang, K., Isella, A., Carpenter, J. M., & Blake, G. A. 2014, ApJ, 791, 42