A Crowdsourcing Approach To Collecting Tutorial Videos –
Toward Personalized Learning-at-Scale
Abstract
We investigated the feasibility of crowdsourcing full-fledged tutorial videos from ordinary people on the Web on how to solve math problems related to logarithms. This kind of approach (a form of learnersourcing [10, 12]) to efficiently collecting tutorial videos and other learning resources could be useful for realizing personalized learning-at-scale, whereby students receive specific learning resources – drawn from a large and diverse set – that are tailored to their individual and time-varying needs. Results of our study, in which we collected 399 videos from 66 unique “teachers” on Mechanical Turk, suggest that (1) approximately 100 videos – over of which are mathematically fully correct – can be crowdsourced per week for $5/video; (2) the crowdsourced videos exhibit significant diversity in terms of language style, presentation media, and pedagogical approach; (3) the average learning gains (posttest minus pretest score) associated with watching the videos was stat. sig. higher than for a control video ( versus ); and (4) the average learning gains () from watching the best tested crowdsourced videos was comparable to the learning gains () from watching a popular Khan Academy video on logarithms.
1 Introduction & Related Work
The goal of personalized learning, in which students’ learning experiences are tailored to their individual and time-varying needs, has been been pursued by psychologists, computer scientists, and educational researchers for over five decades. Over the years, personalized learning systems have taken various forms: computer-aided instruction systems in the 1960-1970s; intelligent tutoring systems in the 1980-2000s [22, 1, 26]; web-based e-learning platforms in 2000-2010s [4, 9, 5]; and adaptive learning engines – as developed by companies such as Knewton, Pearson, and McGraw-Hill – from 2010-present. From an abstract perspective, the common goal of all these technologies is to provide each student at each moment in time with specific learning resources – e.g., illuminating tutorials of key concepts, edifying practice problems, helpful explanations of how to solve these problems, etc. – that can help students to learn more effectively than they could with a one-size-fits-all instructional approach.
A key challenge when developing personalized learning systems is how to efficiently collect a set of learning resources that are used to personalize instruction. Without a sufficiently large and diverse set of resources from which to draw, personalized learning may not offer much advantage over traditional, single-path instruction. Intelligent tutoring systems in particular, for which the empirical benefits of personalized learning are arguably strongest [18, 13], can be extremely laborious to create, and a significant part of the effort that must be invested is in the creation of good explanations and hints [17]. Moreover, in order to be maximally effective, personalized learning systems should consider interactions between the learner and the resources with which they interact: these interactions could be based on shared demographics of the learner and the teacher (e.g., role model effects [19, 16, 6]), language complexity of the resource that is tuned to the proficiency of the learner [7], affective sentiment (e.g., enthusiasm [14], humor [27]) of the resource that matches the emotional state of the learner, and more. Unfortunately, as the number of possible interactions between learners and resources increases, the problem of how to collect a large and diverse enough pool of resources becomes increasingly severe.
One recently proposed and promising approach to collecting and curating large volumes of educational resources is to crowdsource data from learners themselves. This process, sometimes known as learnersourcing, has been used, for example, to identify which parts of lecture videos are confusing [10], and to describe the key instructional steps [12] and subgoals [11] of “how-to” videos. More recently, learnersourcing has been used not only to annotate existing educational content, but also to create novel content itself. In particular, [25] explored a crowdsourcing-based strategy toward personalized learning in which learners were asked to author paragraphs of text explaining how to solve statistics problems. The explanations generated by learners were found to be comparable in both learning benefit and rated quality to explanations produced by expert instructors.
In this paper, we too explore an approach to efficiently collecting a large and diverse set of learning resources that is based on crowdsourcing. However, in contrast to [25], in which short text-based explanations were gathered from learners who were already engaged in a learning task, our work is concerned with asking ordinary people from a crowdsourcing web site to take on the role of a teacher (which has been dubbed “teachersourcing” [8]) and to create novel, full-fledged, video-based explanations that provide worked examples [3] of how to solve a variety of mathematics problems that could potentially help math students to learn. In contrast to static text, multimedia videos such as whiteboard animations can help to focus students’ attention on the most salient parts of an explanation – e.g., by pointing to a specific mathematical expression with the mouse pointer while talking. Moreover, some students may find video to be more engaging than text, and there is preliminary evidence from the education literature that multimedia presentations lead to greater knowledge retention compared to static text-based presentations [21]. We note that the effort involved for the “teachers” in creating these videos is considerable – often an hour or more of total time according to self-reports by the participants in our study. It is thus unclear how many people on crowdsourcing websites such as Mechanical Turk would even respond to such a task, and even less clear how useful such crowdsourced explanations might be in terms of helping students to learn.
This paper describes what we believe to be the first investigation into crowdsourcing entire tutorial videos from ordinary people on the Web. In particular, the rest of the paper investigates the following research questions:
-
1.
How can we design a crowdsourcing task to convince ordinary people to create, for a modest amount of compensation, a novel tutorial video (not just a link to an existing video) that might realistically be used to help students learn? What is the throughput (videos/week) that we can attain, and how many of these videos are mathematically correct?
-
2.
What kinds of qualitative diversity – e.g., presentation style, pegagogical approach, language style – do the crowdsourced videos exhibit?
-
3.
How effective are these videos in helping students learn about the subject matter they are supposed to explain? How do they compare with a video produced by Khan Academy?
2 Experiment I: Crowdsourcing Videos
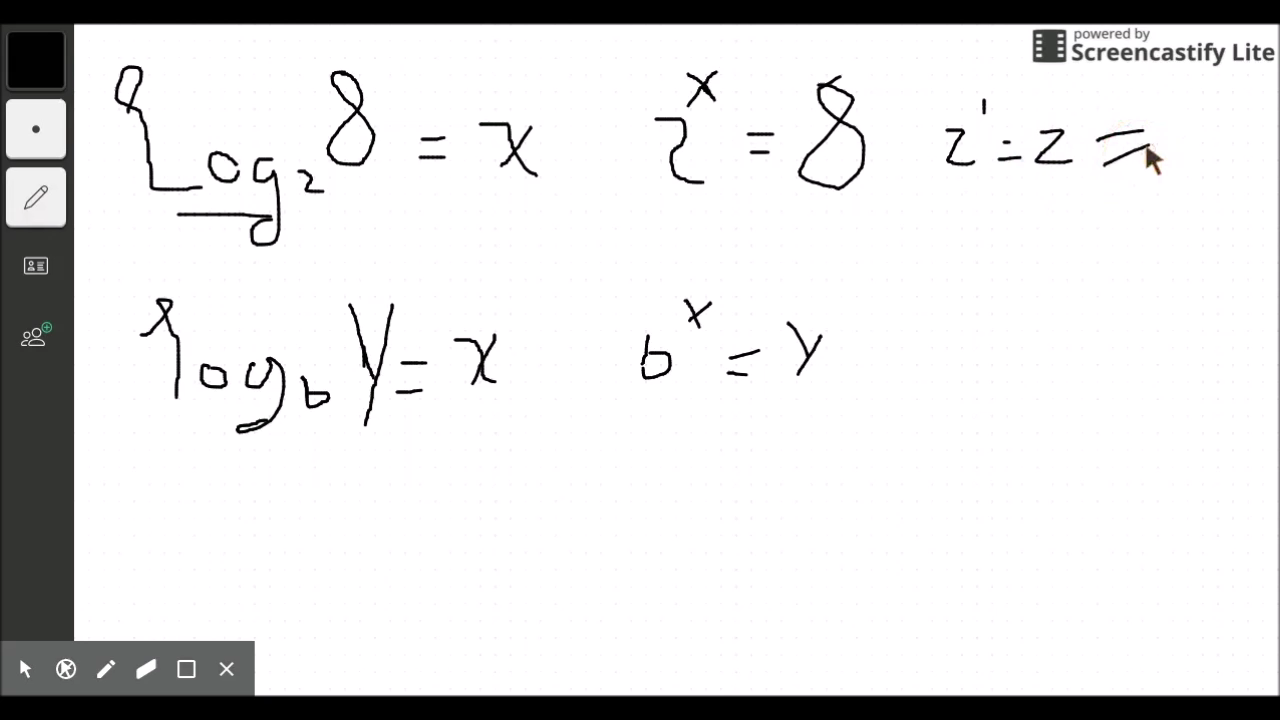
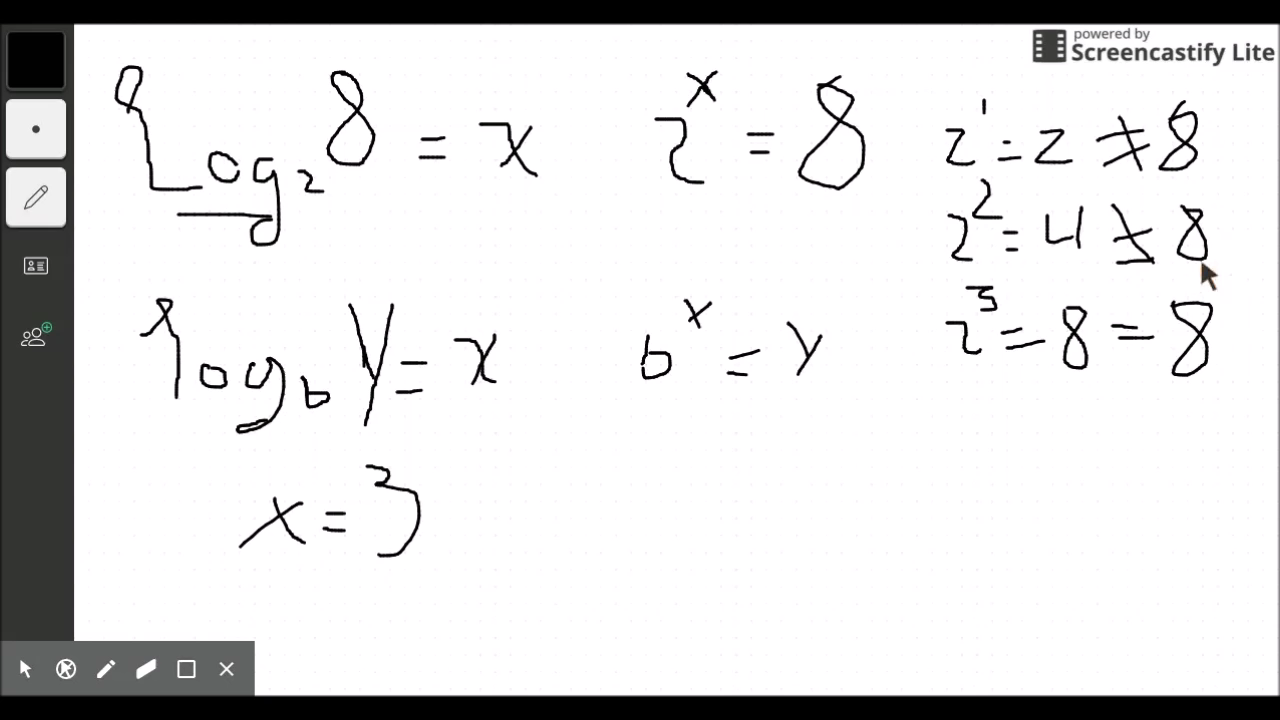
In this study we focused on crowdsourcing tutorial videos that explain how to simplify mathematical expressions and solve equations involving logarithms. Logarithms are well-suited for this study because many people know what they are; many other people – even those who once learned them many years ago – do not; and people who are not familiar with logartithms can still learn something useful about them in a small (say, less than 10 minutes) amount of time. In particular, we chose 18 math problems (see Figure 1) that were given as part of a pre-test from another research project that was conducted by [20] on how math tutors interact with their students in traditional classroom settings. As we will discuss in Experiment II, we will later also use the post-test from that same study.
Basic Logarithms
Simplify:
Logarithms and Variables
Simplify:
Equations with Logarithms
Solve:
2.1 Participants
The “teachers” in our study were adult (18 years or older) workers on Amazon Mechanical Turk. All participants were first required to give informed consent (the experiment was approved by our institution’s IRB (IRB15-0867) and also sign a video recording release form so that their video explanations can be used in subsequent experiments on learning. Participants who completed the experiment received a payment of $5.
2.2 Apparatus
When interacting with the Mechanical Turk, workers complete one or more Human Intelligence Tasks (“HITs”). A synopsis of the HIT we posted is shown in the Appendix in Figure 5. In place of the text “PROBLEM”, one of the problems from Figure 1 – such as “Simplify ” – is shown to the worker; it is then her/his job to create a video explaining how to solve this problem. For each problem of the 18 problems, we solicited workers on the Mechanical Turk to produce a video to explain how to solve this problem to a student. Teachers were allowed to create one video for multiple problems if they desired, but not multiple videos for the same problem.
2.3 Procedure
The experiment was conducted as follows:
-
1.
We asked the participant to answer a brief survey about their age, gender, level of education, and interest in mathematics.
-
2.
In order to give the participant an idea of what we were looking for, we asked her/him to watch several examples of what a good video explanation might look like; the examples we chose were popular videos from Youtube about long division and quadratic equations.
-
3.
For the benefit of participants who chose to record their own handwriting, we provided explicit guidelines on handwriting quality and showed good and bad examples of each.
-
4.
We presented one of the 18 problems mentioned above and asked them to create and upload a video explaining how to solve it.
-
5.
The participant uploaded her/his video and completed the HIT.
2.4 Dependent variables
We measured (1) the number of participants (“teachers”) who created a tutorial video, (2) the average number of tutorial videos created by each participant, and (3) the fraction of submitted videos that were mathematically correct.
2.5 Results
Over 2 data collection periods consisting of approximately 2 weeks each, we collected 399 videos from 66 unique teachers (17% female; minimum reported age of 18, maximum reported age of 55) – approximately 6 vidoes per participant. This corresponds to approximately 100 videos per week of active data collection. The duration of most videos was between 1 and 3 minutes. Interestingly, several of the participants in our study expressed to us via email their enjoyment in completing the HIT, and many of them created explanations for several different problems. See Figure 2 for a representative sample of the crowdsourced videos.
Video 1


Video 2
Video 3


Video 4
Video 5

2.5.1 Analysis of correctness
We have manually annotated 145 out of these 399 videos (annotation is still ongoing) as being (a) proper submissions and (b) mathematically correct. In order to be considered a proper submission, the video had to be both novel (e.g., not just copied from Youtube) and a bona fide video (e.g., not just a static image frame with no accompanying audio that was packaged as a video file). In order to be considered mathematically correct, the video needed to begin with the problem statement, end with the correct solution, and contain no statement that was objectively false. (At this stage, we made no attempt to judge the pedagogical effectiveness of the videos; we will explore this in Experiment II). Finally, we labeled a video as “borderline” (rather than correct or incorrect) for minor missteps such as when the teacher referred to a mathematical expression (e.g., ) as an equation even though there was no equals sign.
Of the 145 annotated videos, 117 ( of 145) were judged to be mathematically fully correct; 16 videos () were judged as incorrect; 7 () were judged as “borderline”; and 5 () were not proper submissions.
2.5.2 Examples of mistakes
Some of the mistakes were incorrect verbal usage of terminology even if the written derivation itself was correct. For example, one teacher read the expression as “log times x” instead of “log of x”. Other mistakes were more egregious. For instance, in one video, the teacher “canceled” two occurrences of the function – one in the numerator and one in the denominator:
(Interestingly, his final answer to the problem – due to another mistake – was actually correct.)
3 Examining the diversity of the videos
In order for personalized learning systems to be effective for a wide variety of students, they must be able to draw from a large and diverse set of learning resources in order to give each individual student the kind of help she/he needs most. We thus performed a qualitative analysis of the crowdsourced videos for diversity along the dimensions of presentation format, language, and pedagogical approach used to solve the math problem.
3.1 Presentation format
As shown in Figure 2, there was diversity in the presentation formats and styles used in the videos. The five most common formats include: (1) a video of the teacher writing on paper (2) a video of the teacher’s computer screen that is used as an electronic notepad; (3) a video of the teacher speaking directly to the learner in a face video along with written materials (sometimes held up to the camera) to show the derivation; (4) a step-by-step “Powerpoint”-style presentation; and (5) a static Powerpoint slide to which the instructor points using the mouse. In addition, all videos included accompanying audio to explain the solution. Some teachers also mixed styles by writing on the Powerpoint slide using a mouse-based paint tool.
3.2 Language
Although all crowdsourced videos were in English, there was variability in the geographical origin and dialect of the spoken English. In particular, several teachers used terminology such as “5 into x” to express the multiplication of 5 with , i.e., . This terminology is widely used in India [23]. This also highlights the need for both a large, diverse set of explanations as well as smart decision-making in determining which learners are assigned to which explanation.
3.3 Pedagogical style
Over the 18 math problems for which tutorial videos were crowdsourced, we observed two general approaches that teachers used to derive the solutions to the problems. In some explanations, the definition of logarithm – i.e., the logarithm of base is the power to which must be raised to equal – was invoked to solve the problem. For example, to reduce , one can use the fact that clearly to arrive at the correct answer of . In other explanations, the teacher emphasized the syntax of logarithms and how rules can be applied to transform a problem step-by-step into the solution. For example, to simplify , the teacher would note that for all to derive ; then, he/she would note that for all to derive .
3.3.1 Path Analysis
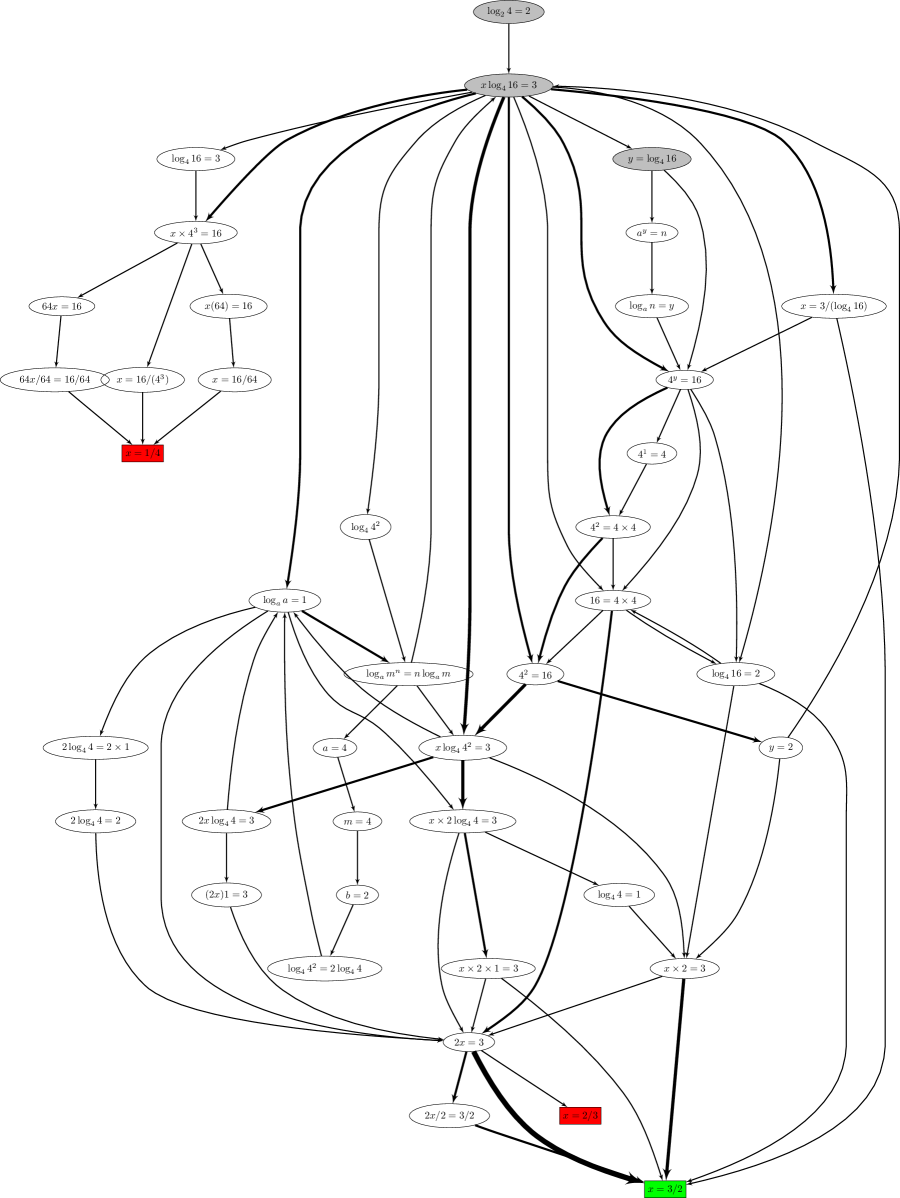
One important way in which personalized learning systems can help students is to provide feedback and hints that are tailored to the particular solution path that student took toward finding a solution [2]. We thus investigated whether the crowdsourced explanations exhibited diversity in terms of the teachers’ own solution paths. In particular, for the particular math problem, “Solve for : ”, we performed a path analysis in which we compared the different derivations paths that the different teachers used to arrive at a solution. We watched each of the 17 different explanation videos that were crowdsourced from people on Mechanical Turk and manually coded for all equations that the teacher wrote, in the order that she/he wrote them. Since different teachers would express the exact same mathematical relationships in different ways, we devised a set of 10 “equivalency rules” to eliminate trivial syntactic differences. For example, one equivalency rule was is equivalent to . Even after applying these rules to each pedogogical path, each of the teacher’s paths was unique.
To represent visually the collection of all paths, we constructed a graph (see Figure 3) whose nodes consisted of the union over all teachers of the states reached by their pedagogical paths. The weight of each directed edge in the graph corresponded to the number of teachers whose path transitioned from one state to another. Rectangular graph nodes are terminal states (i.e., the end of a solution path), where red indicates an incorrect solution (e.g., ) and green indicates correct solution (). Gray ellipsoid nodes are the start states taken by different teachers. While most teachers started with the problem statement, a few teachers did not; e.g., one teacher first introduced an easier logarithm calculation “” before returning to the actual problem.
Results: Although there was substantial overlap in the teachers’ solution paths, all 17 of them were unique – see Figure 3. In particular, we observe several dimensions of variability in teachers’ pedagogical approaches:
-
1.
Strategy: Some teachers applied syntactic laws of logarithms to derive their solution; such solutions passed through nodes in the lower left quadrant of the graph (e.g., , ). Other teachers appealed to the definition of logarithm to infer, for example, that (since – see upper right quadrant of graph).
-
2.
Sequence: Paths that passed through the same states varied in the order in which states were visited. For example, some paths presented before , and some paths did the reverse.
-
3.
Granularity: Some paths contained considerably more detail than others. For example, in paths that tackled the sub-problem of determining what value solves , some paths first provided simple arithmetic examples of exponentiation (, , etc.), whereas other jumped directly to the answer ).
4 Experiment II: Finding the Best Videos
Experiment I revealed that the majority () of the submitted videos were both proper submissions (i.e., were novel bona fide videos) and were mathematically correct. In this section, we explore whether the videos show any promise for actually helping students to learn. Because this study is about crowdsourcing novel explanations from ordinary people around the world who may have varying mathematical skill and pedagogical expertise, we do not expect all the videos to be effective in helping students to learn. Rather, we assessed whether the average learning effectiveness of the videos – quantified by posttest-minus-pretest score of participants who watched the videos in a separate experiment – was statistically significantly higher than the learning effectiveness of a “control” video about a math topic unrelated to logarithms (specifically, a historical tutorial about the number ).
With this goal in mind, we randomly sampled 40 videos from the 117 that were confirmed (out of the 145 total that were annotated) to be mathematically correct and conducted an experiment in which each participant took a pretest on logarithms, watched a randomly assigned video (either one of the 40 crowdsourced videos or the control video), and then took a posttest. In contrast to Experiment I, the participants in this experiment were not expected to know anything a priori about logarithms.
4.1 Participants
We recruited participants from Amazon Mechanical Turk. Each participant who completed the experiment received payment.
4.2 Apparatus
4.3 Procedure
The experiment proceeded as follows:
-
1.
The participant took the pretest.
-
2.
The participant was randomly assigned a video to watch. With probability , the participant was assigned the control video, and with uniform probability of , the participant was assigned to watch one of the 40 crowdsourced videos.
-
3.
The participant took the posttest.
4.4 Dependent variables
The dependent variables in this experiment were the average learning gains
for each video , where and are the pretest and posttest scores for participant , and is the set of participants who were assigned to watch video .
4.5 Results
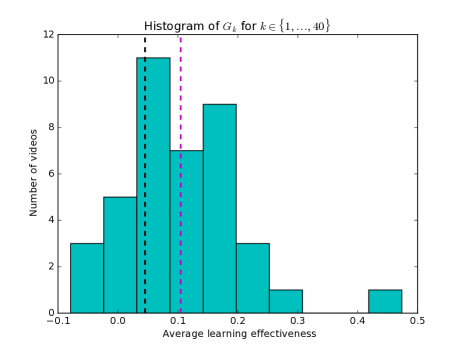
The histogram of the for is shown in Figure 4. The average learning gains () for the crowdsourced videos was higher than for the control video (); the difference was statistically significant (, , two-tailed).
4.6 Differential Drop-out
Since some subjects started but did not complete the experiment, the number of subjects collected per video varied. This issue of differential drop-out can lead to distorted estimates: for example, if one tutorial video is particularly bad and only those students who are already proficient in logarithms decide to persist through the bad video and complete the HIT, then the estimated learning gains for that video might be positively biased. Unfortunately, Amazon Mechanical Turk does not provide an easy mechanism to track which workers started, but did not complete, the experiment – data are available only for participants who finished the post-test and submitted the HIT. However, since we do know how many participants completed the HIT for each video, and since we know the prior probability of assigning each participant to each video, we can assess whether some videos resulted in drop out more often than others. Specifically, we conducted a Pearson’s test where the vector of probabilities for the 41 videos (1 control plus 40 crowdsourced videos) was . The result of the test (, ) indicate that the completion rates for the videos were not statistically significantly different from the assignment rates. Though this result does not mean that the estimates of learning effectiveness in Figure 4 are completely unbiased, it provides some evidence that they are not to be completely discounted.
5 Experiment III: Comparing to Khan Academy
In our third experiment, we compared the learning gains of the best 4 videos as estimated in Experiment II, to the learning gains of a popular tutorial video on logarithms produced by Khan Academy (specifically https://www.youtube.com/embed/Z5myJ8dg_rM, with views as of October 20, 2016).
5.1 Participants
We recruited participants from Amazon Mechanical Turk. Each participant who completed the experiment received payment.
5.2 Apparatus
Same as in Experiment II.
5.3 Procedures
Same as in Experiment II, except that each participant was assigned uniformly at random to watch one of five different tutorial videos: 4 of these videos were crowdsourced videos, and 1 was the Khan Academy video.
5.4 Dependent variables
Same as in Experiment II.
5.5 Results
| Video | Participants | |
|---|---|---|
| 1 | 58 | 0.1416 |
| 2 | 42 | 0.1140 |
| 3 | 57 | 0.0942 |
| 4 | 35 | 0.0932 |
| Khan | 58 | 0.1506 |
As shown in Table 1, the learning gains associated with the Khan Academy video compared to the best of the 4 crowdsourced videos were very similar – versus , respectively. The difference between them was not statistically significant (, two-tailed).
We note the following issues when comparing the crowdsourced math videos to the Khan Academy video: On the one hand, the Khan Academy video was substantially longer (7 minutes and 2 seconds) than the 4 crowdsourced videos (maximum length 2 minutes and 16 seconds) and hence can contain subtantially more potentially useful math content. On the other hand, the content presented in the crowdsourced videos was arguably more closely aligned to the post-test (though none of the questions explained in the video was exactly the same as any problem on the post-test) than was the Khan Academy video. Nonetheless, the results suggest that math tutorials crowdsourced from ordinary people on the Web can, at least sometimes, produce high-quality educational content.
6 Results & Conclusions
In the study described in this paper we explored how to devise a crowdsourcing task for use on Amazon Mechanical Turk in which ordinary people are asked to take on the role of a “teacher” and create novel tutorial videos that explain how to solve specific math problems related to logarithms. Further, we analyzed qualitatively the crowdsourced videos for mathematical correctness, diversity across several dimensions including pedagogical approach, presentation format, and language style. Finally, we assessed the utility of the best such videos in terms of helping students to learn, measured as posttest minus pretest performance by students who were asked to watch one of the crowdsourced videos in a separate experiment.
Results from this study suggest that: (1) Crowdsourcing of full-fledged tutorial videos from ordinary people is feasible, provided that appropriate guidelines (e.g., about using clear handwriting) on how to craft the explanations are provided. In fact, several of the crowdsourced workers expressed enthusiasm for the task, which likely requires more creativity than the kinds of tasks that are typically crowdsourced (e.g., image tagging). (2) Crowdsourcing from a large number of “teachers” (66 teachers collectively produced 399 videos in our study) can produce a set of learning resources that exhibits considerable diversity along the dimensions listed above. (3) Although a few of the crowdsourced tutorial videos – which would need to be filtered out – contained important mathematical errors, the best of these videos were statistically significantly more effective, in terms of helping students to learn, than what would be expected from a “control” video on an irrelevant math topic. In fact, in terms of associated learning gains, the very best crowdsourced videos were comparable – and statistically indistinguishable from – a popular tutorial video on logarithms produced produced by Khan Academy. In sum, these findings provide support for the hypothesis that crowdsourcing can play an important role in collecting large, rich, and diverse sets of educational resources that enable personalized learning at scale.
Future work within this project will investigate machine learning-based methods (e.g., [25, 24, 15]) to inferring which students should receive which tutorial videos – based on joint properties of students and teachers – in order to maximize their learning gains. Moreover, computer vision techniques based on deep neural networks will be explored in order to facilitate large-scale, automatic annotation of learning resources for important characteristics – such as pedagogical approach and presentation style – that can be used to recommend specific resources to specific learners.
Appendix
Figure 5 shows a synopsis of the most important content of our HIT (which was rendered in HTML).
Consent Form & Video Recording Release Form
… You will then be asked to create a novel video in which you explain how to solve a short mathematical exercise: PROBLEM. The content and format of the video are up to you, but the video must address the problem and must be mathematically correct. For example, the video might contain a screencast showing an electronic “blackboard” on which you explain how to answer the problem. Alternatively, you might prefer to talk into a web camera and record a video of your face and your voice. …
Survey
Please answer the questions below. When you are done, click ”Next”.
1.
How old are you (in years)?
2.
What is your gender?
3.
What is the highest level of education you have completed?
…
4.
How much do you enjoy mathematics?
…
Sample Problems & Explanations
This page contains some example videos that explain how to solve math problems.
Please watch the videos carefully so you know what we are looking for in this HIT.


Hints on Making a Good Video
When you make your video, you may sometimes record images of your own handwriting.
Please look at the following handwriting examples so you know what distinguishes a good video
from a bad video. Note that a bad video may be rejected due to poor image quality.
The following 2 examples are OK – the writing is dark, big, and clear.
 The following 3 examples are not OK – the writing is too small, blurry, and/or hard to read.

Problem & Instructions
Please examine the following math problem: PROBLEM
Instructions:
1.
Think carefully about how you would explain to someone else how to solve this problem.
2.
Create a video that explains how to solve the problem.
3.
Upload the video to our server.
Rules:
•
Your video must explain how to answer the following math problem: PROBLEM
•
Your video must be original - it cannot be an existing video.
•
Your video must be mathematically correct.
•
Your video may not contain any images of children (less than 18 years old).
•
Your video may not contain any nudity or profanity.
Submission
…
References
- [1] J. R. Anderson, C. F. Boyle, and B. J. Reiser. Intelligent tutoring systems. Science(Washington), 228(4698):456–462, 1985.
- [2] T. Barnes and J. Stamper. Toward automatic hint generation for logic proof tutoring using historical student data. In International Conference on Intelligent Tutoring Systems, pages 373–382. Springer, 2008.
- [3] J. L. Booth, K. E. Lange, K. R. Koedinger, and K. J. Newton. Using example problems to improve student learning in algebra: Differentiating between correct and incorrect examples. Learning and Instruction, 25:24–34, 2013.
- [4] P. Brusilovsky and C. Peylo. Adaptive and intelligent web-based educational systems. International Journal of Artificial Intelligence in Education (IJAIED), 13:159–172, 2003.
- [5] C.-M. Chen. Intelligent web-based learning system with personalized learning path guidance. Computers & Education, 51(2):787–814, 2008.
- [6] T. S. Dee. A teacher like me: Does race, ethnicity, or gender matter? The American economic review, 95(2):158–165, 2005.
- [7] N. Haag, B. Heppt, P. Stanat, P. Kuhl, and H. A. Pant. Second language learners’ performance in mathematics: Disentangling the effects of academic language features. Learning and Instruction, 28:24–34, 2013.
- [8] N. T. Heffernan, K. S. Ostrow, K. Kelly, D. Selent, E. G. Inwegen, X. Xiong, and J. J. Williams. The future of adaptive learning: Does the crowd hold the key? International Journal of Artificial Intelligence in Education, pages 1–30, 2016.
- [9] G.-J. Hwang, F.-R. Kuo, P.-Y. Yin, and K.-H. Chuang. A heuristic algorithm for planning personalized learning paths for context-aware ubiquitous learning. Computers & Education, 54(2):404–415, 2010.
- [10] J. Kim, P. J. Guo, D. T. Seaton, P. Mitros, K. Z. Gajos, and R. C. Miller. Understanding in-video dropouts and interaction peaks inonline lecture videos. In Proceedings of the first ACM conference on Learning@ scale conference, pages 31–40. ACM, 2014.
- [11] J. Kim, R. C. Miller, and K. Z. Gajos. Learnersourcing subgoal labeling to support learning from how-to videos. In CHI’13 Extended Abstracts on Human Factors in Computing Systems, pages 685–690. ACM, 2013.
- [12] J. Kim, P. T. Nguyen, S. Weir, P. J. Guo, R. C. Miller, and K. Z. Gajos. Crowdsourcing step-by-step information extraction to enhance existing how-to videos. In Proceedings of the 32nd annual ACM conference on Human factors in computing systems, pages 4017–4026. ACM, 2014.
- [13] K. R. Koedinger and V. Aleven. Exploring the assistance dilemma in experiments with cognitive tutors. Educational Psychology Review, 19(3):239–264, 2007.
- [14] M. Kunter, Y.-M. Tsai, U. Klusmann, M. Brunner, S. Krauss, and J. Baumert. Students’ and mathematics teachers’ perceptions of teacher enthusiasm and instruction. Learning and Instruction, 18(5):468–482, 2008.
- [15] A. S. Lan and R. G. Baraniuk. A contextual bandits framework for personalized learning action selection. In Educational Data Mining, 2016.
- [16] J. Lim and J. Meer. The impact of teacher-student gender matches: Random assignment evidence from south korea. Technical report, National Bureau of Economic Research, 2015.
- [17] T. Murray. An overview of intelligent tutoring system authoring tools: Updated analysis of the state of the art. In Authoring tools for advanced technology learning environments, pages 491–544. Springer, 2003.
- [18] J. F. Pane, B. A. Griffin, D. F. McCaffrey, and R. Karam. Effectiveness of cognitive tutor algebra i at scale. Educational Evaluation and Policy Analysis, page 0162373713507480, 2013.
- [19] V. Paredes. A teacher like me or a student like me? role model versus teacher bias effect. Economics of Education Review, 39:38–49, 2014.
- [20] L. P. Salamanca, A. R. Carini, M. A. Lee, K. Dykstra, J. Whitehill, D. Angus, J. Wiles, J. S. Reilly, and M. S. Bartlett. Characterizing the temporal dynamics of student-teacher discourse. In Development and Learning and Epigenetic Robotics (ICDL), 2012 IEEE International Conference on, pages 1–2. IEEE, 2012.
- [21] S. Türkay. The effects of whiteboard animations on retention and subjective experiences when learning advanced physics topics. Computers & Education, 98:102–114, 2016.
- [22] K. Vanlehn, C. Lynch, K. Schulze, J. A. Shapiro, R. Shelby, L. Taylor, D. Treacy, A. Weinstein, and M. Wintersgill. The andes physics tutoring system: Lessons learned. International Journal of Artificial Intelligence in Education, 15(3):147–204, 2005.
- [23] Wikipedia. into, 2016. https://en.wiktionary.org/wiki/into; [Online; accessed 4-March-2016].
- [24] J. J. Williams, N. Ali, J. Kim, J. Whitehill, S. Maldonado, M. Pechnizkiy, L. Chu, and N. Heffernan. The mooclet framework: Improving online education through experimentation and personalizaton of modules. SSRN, 2014.
- [25] J. J. Williams, J. Kim, A. Rafferty, S. Maldonado, W. Lasecki, K. Gajos, and N. Heffernan. Axis: Generating explanations at scale with learnersourcing and machine learning. In ACM Learning at Scale, 2016.
- [26] B. Woolf, W. Burleson, I. Arroyo, T. Dragon, D. Cooper, and R. Picard. Affect-aware tutors: recognising and responding to student affect. International Journal of Learning Technology, 4(3-4):129–164, 2009.
- [27] A. Ziv. Teaching and learning with humor: Experiment and replication. The Journal of Experimental Education, 57(1):4–15, 1988.