Electronic properties of GeTe and Ag- or Sb-substituted GeTe studied by low temperature 125Te NMR
Abstract
We have carried out 125Te nuclear magnetic resonance (NMR) in a wide temperature range of 1.5 – 300 K to investigate electronic properties of Ge50Te50, Ag2Ge48Te50 and Sb2Ge48Te50 from a microscopic point of view. From the temperature dependence of NMR shift () and nuclear spin lattice relaxation rate (1/), we found that two bands contribute to the physical properties of the materials. One band overlaps the Fermi level providing the metallic state where no strong electron correlations are revealed by Korringa analysis. The other band is separated from the Fermi level by an energy gap of 67 K, which gives rise to the semiconductor-like properties. First principle calculation revealed that the metallic band originates from the Ge vacancy while the semiconductor-like band may be related to the fine structure of the density of states near the Fermi level. Low temperature 125Te NMR data for the materials studied here clearly show that the Ag substitution increases hole concentration while Sb substitution decreases it.
pacs:
76.60.-k, 72.80.Ey, 71.20.-bI Introduction
Complex tellurides have been studied extensively due to their intriguing fundamental properties and their application as thermoelectric materials,Hein1964 ; Steigmeier1970 ; Akola2008 ; Snyder2008 ; Heremans2008 ; Skarabek1995 which directly convert heat into electricity. The efficiency is characterized by the dimensionless figure of merit ( the Seebeck coefficient, the electrical conductivity, the temperature, and the thermal conductivity). The well-known group of thermoelectric materials is complex tellurides based on GeTe,Levin2013 ; Wu2014 ; Sankar2015 TAGS- materials (GeTe)m(AgSbTe, having a thermoelectric figure of merit above 1.Skarabek1995 ; Plachkova1984 ; Cook2007 ; Levin2012 According to band calculations, GeTe is a narrow band gap semiconductor whose band gap is calculated to be 0.3 0.5 eV.Herman1968 ; Cohen1968 ; Polatoglou1982 ; Singh2013 On the other hand, the electrical resistivity measurements show metallic behaviorLevin2013 ; Damon1967 ; Kolomoets1 ; Kolomoets2 ; Gevacancy2006 although the small gap also has been observed by optical measurements.Nikolic1969 This is believed to be due to high hole concentrations generated by Ge vacancies, forming a self-dopant system with -type conductivity. Levin2013 ; Damon1967 ; Lubell1963 Therefore, depending on the samples composition, they may have different concentrations of Ge vacancies resulting in different physical properties. This makes it very difficult to understand physical properties of GeTe-based materials. In fact, there is a significant discrepancy between the electronic and thermal transport data for GeTe-based materials reported in the literature.Skarabek1995 ; Gelbstein2009 ; Gelbstein2010 ; Zhang2011
In order to avoid such confusion, one would need to study the physical property using well characterized samples. We have conducted systematic characterization of GeTe by using x ray diffraction (XRD), scanning electron microscopy (SEM), energy dispersive spectroscopy (EDS), Seebeck coefficient, electrical resistivity, Hall effect, thermal conductivity, and 125Te nuclear magnetic resonance (NMR) measurements.Levin2013 Hereafter we will use notation Ge50Te50 for GeTe with the coefficients shown in atomic percent.
In our previous paper,Levin2013 we concluded that the discrepancy in the data for Ge50Te50 reported in literature can be attributed to the variation in the Ge/Te ratio of solidified samples as well as to different condition of measurements. It is well established that NMR is a powerful tool to investigate carrier concentrations in semiconductors from a microscopic point of view. It is noted that the Hall and Seebeck effects show only the bulk properties, which can be affected by small amounts of a second phase.Wolfe1960 ; Heremans2008_2 Nuclear spin lattice relaxation rates (1/) have been measured at room temperature, and were found to increase linearly with carrier concentrations.Levin2013PRB However, to our knowledge, no systematic NMR investigation of Ge50Te50 has been carried out in a wide temperature range.
In this paper, we report the first 125Te NMR measurements of Ge50Te50 in a wide temperature range of = 1.5 - 300 K. We found that the NMR shift and 1/ data are nearly temperature independent at low temperatures below 50 K and both increase slightly with increasing temperature at high temperatures. These behavior can be well explained by a two band model where one band overlaps the Fermi level and the other band is separated from the Fermi level by an energy gap of 67 K. First principle calculations indicate that the first band originates from the Ge vacancy while the second band may be related to the fine structure of the density of states near the Fermi level. We also carried out 125Te NMR measurements of M2Ge48Te50 (M = Ag, Sb) to study carrier doping effects on electronic properties. Clear changes in carrier concentration by Ag or Sb substitutions were observed: the Ag substitution increases the hole concentration whereas Sb substitution decreases the concentration, which is consistent with our previous report.Levin2016
II Experimental
Polycrystalline samples of Ge50Te50, Ag2Ge48Te50 and Sb2Ge48Te50 were prepared by direct reaction of the constituent elements of Ge, Te, Ag or Sb in fused silica ampoules, as described in Ref. Levin2013, and Ref. Levin2016, . The samples were well characterized by XRD, Seebeck coefficient, electrical resistivity, Hall effects, and room temperature 125Te NMR measurements. The coarsely powdered samples were loosely packed into 6-mm quartz tube for NMR measurements. NMR measurements of 125Te ( = ; = 13.464 MHz/T) nucleus were conducted using a homemade phase-coherent spin-echo pulse spectrometer. 125Te NMR spectra were obtained either by Fourier transform of the NMR echo signal at a constant magnetic field of 7.4089 T or by sweeping the magnetic field at a frequency of 99.6 MHz in the temperature range of = 1.5 - 300 K. The NMR echo signal was obtained by means of a Hahn echo sequence with a typical /2 pulse length of 7.5 s.
III Results and discussion
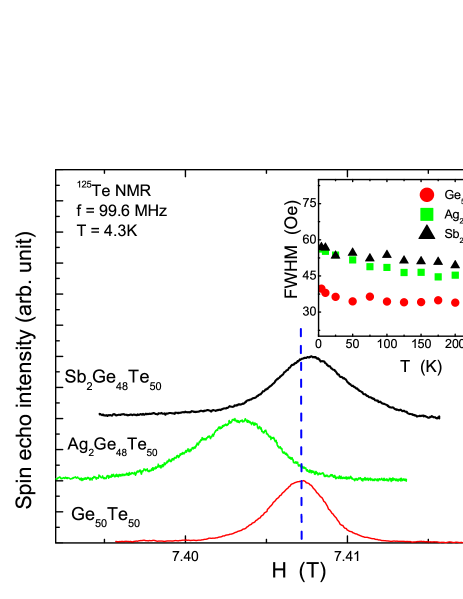
Figure 1 shows field-swept 125Te NMR spectra measured at 4.3 K for Ge50Te50, Ag2Ge48Te50 and Sb2Ge48Te50. The full width at half maximum (FWHM) for Ge50Te50 is 40.0(5) Oe at = 4.3 K which is almost independent of temperature although a slight increase can be observed below 25 K as shown in the inset of Fig. 1. This FWHM is slightly smaller than 43 Oe at room temperature reported previously.Levin2016 With Ag substitution the peak position shifts to lower magnetic field, while the peak position slightly shifts to higher magnetic field with Sb substitution. The FWHM shows a slight increase to 56.0(5) Oe and 54.0(5) Oe at = 4.3 K for Ag- or Sb-substituted samples, respectively. The FWHM is also found to increase slightly with decreasing temperature for Ag- or Sb-substituted samples. These observed values are also closed to the values ( 50 Oe) at room temperature reported previously.Levin2016
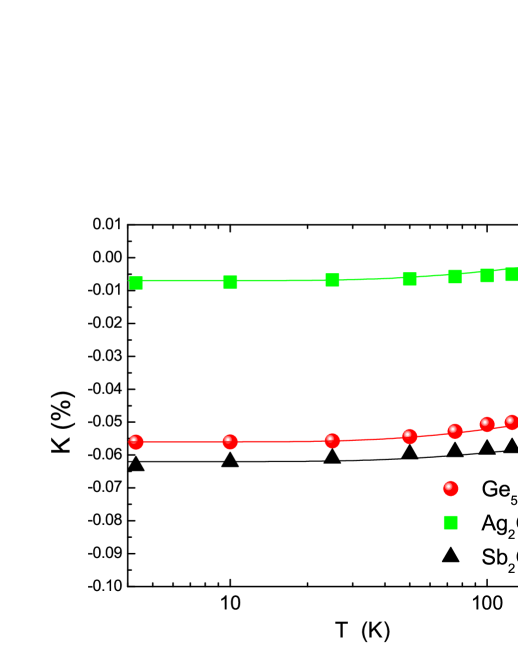
The temperature dependence of NMR shift is shown in Fig. 2 where is determined by the peak position of the spectrum. Although the absolute values of depend on the samples composition, their temperature dependencies exhibit qualitatively the same behavior: slightly decreases with decreasing temperature, then levels off at low temperatures. The temperature dependence of can be analyzed by a two band model where the first band overlaps the Fermi level and the second band is separated from the Fermi level by an energy gap (). The nearly temperature independent behavior observed at low temperatures is a typical characteristic for metal (due to Pauli paramagnetic susceptibility) originated from the first band. The increase of at high temperatures originates from the second band, similar to the case of semiconductors. Thus the total NMR shift is given by
| (1) |
where is the temperature independent NMR shift related to the the Pauli paramagnetic susceptibility due to self-doping/substitution effects and originates from the semiconducting-like nature giving rise to the temperature dependent contribution because of thermal excitations across an energy gap . The temperature independent includes chemical shift, orbital and Landau diamagnetic contributions. As will be shown below, is estimated to be . As the temperature dependent has been calculated as ,Blembergen1954 ; Wolf1979 the total is given as
| (2) |
Using the = and = K [ meV] estimated from the temperature dependence of 1/ shown below, the experimental data are reasonably reproduced as shown by the solid lines with = 0.084 , = 0.00075 for Ge50Te50, = 0.135 , = 0.00057 for Ag2Ge48Te50, and = 0.081 , = 0.00052 for Sb2Ge48Te50, respectively. Since the is proportional to Pauli paramagnetic susceptibility being proportional to the density of states ) at the Fermi level, the increase of from Ge50Te50 to the Ag doped one indicates an increase of ) while Sb doping reduces ) at the Fermi level. These results are consistent with the previous report.Levin2016 Note the ) discussed here is due to unavoidable self-doping and/or Ag(Sb)-substitution effects not including the effects of thermally activated carriers from the second band.
Figure 3(a) shows temperature dependence of 1/ for the three samples. values reported here were measured by the single saturation pulse method at the peak position of the NMR spectra. As shown in Fig. 3(b), the nuclear recovery data can be fitted by a single exponential function , where and are the nuclear magnetization at time after the saturation and the equilibrium nuclear magnetization at , respectively. Similar to the case of , 1/s for all samples exhibit qualitatively the same behavior: 1/ decreases slightly with decreasing temperature, then levels off at low temperatures. The temperature dependence of 1/ also can be explained by the two band model.
In this case, 1/ is given by
| (3) |
where is the temperature independent constant value originated from the conduction carriers and the second term is due to thermal excitation effects from the second band. Blembergen1954 ; twobandmodel A similar analysis of the temperature dependence of 1/ has been reported in the semimetal CaAl2-xSi2-x (Ref. Lue2007, ) and the Heusler-type compound Fe2+xV1-xAl (Ref. Kiyoshi2000, ). Using Eq. 3, the magnitude of is estimated to be K for Ge50Te50 and Ag2Ge48Te50, although the experimental data are somewhat scattered, as shown in Fig. 3(c) where is plotted against to 1/ on a semi-log scale. It is difficult to estimate for Sb2Ge48Te50 due to a large scattering of the data. The black solid line in the figure is the best fit with a assumption of = K, which seems to reproduce the data reasonably although we cannot determine . It is noted that K is too small to attribute to the semiconducting gap energy of eV reported from optical measurements for GeTe.Nikolic1969
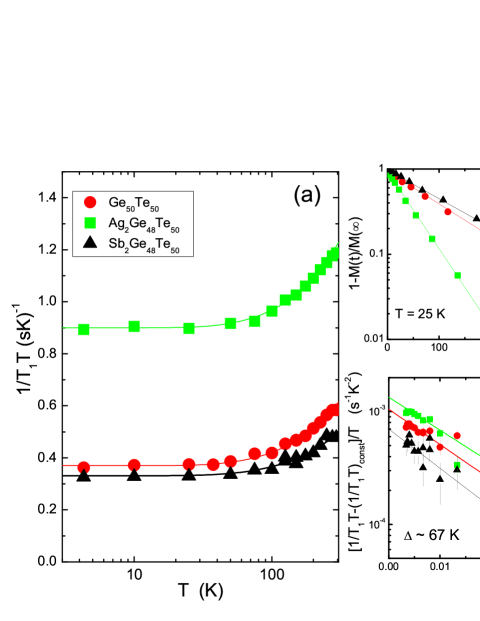
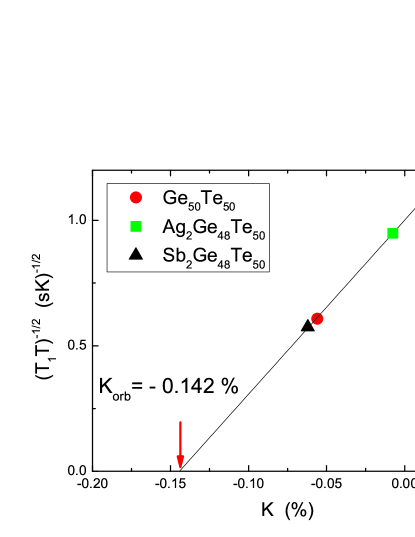
The solid lines in Fig. 3(a) are best fit to Eq. 3, using = K, with (sK)-1, = 0.0013 for Ge50Te50, (sK)-1, = 0.0010 for Ag2Ge48Te50, and (sK)-1, = 0.00068 for Sb2Ge48Te50, respectively. Within a Fermi liquid picture, is proportional to the square of the density of states at the Fermi level ) and is proportional to ). Therefore, as is expected to be proportional to , one can estimate the temperature independent by plotting as a function of the temperature-independent = + at low temperatures for different samples. As shown in Fig. 4, we actually found a linear relation between and in the plot of vs. the temperature independent , from which is estimated to be .

Using the NMR data, we can discuss electron correlations through the Korringa ratio analysis. As described, both and are determined primarily by ). This leads to the general Korringa relation
| (4) |
where denotes the spin part of the NMR shift. For the 125Te nucleus, Ks. Deviations from can reveal information about electron correlations in materials, which are conveniently expressed via the Korringa ratio .Moriya1963 ; Narath1968 For uncorrelated metals, one has . For antiferromagnetic spin correlation, ; in contrast, for ferromagnetic spin correlations. The Korringa ratio , then, reveals how electrons correlate in materials. Figure 5 shows the temperature dependence of for the three samples. We found the values of for all samples are similar, 1.25 at low temperatures, where the temperature independent (1/ and dominate, indicative of no strong correlations for conduction carriers originated from self-doping/substitution effects in the samples. With increasing temperature, slightly increases above 50 K. If we assume that the Korringa relation holds at high temperatures, the increase suggests a tiny enhancement of antiferromagnetic spin correlations for carriers. Since the temperature dependence of originates from the second band having semiconducting nature, these results may suggest that thermally excited carriers play an important role in electron correlation effects in the system. As electron correlations have been pointed out to be significant for a figure of merit ( values),Joura2004 it is interesting if the increase of in Ge50Te50 at high temperatures above 300 KLevin2013 is related to the electron correlations. Further studies at high temperature NMR measurements are required in shedding light on this issue.
Now we discuss how the carrier concentration changes by Ag or Sb substitution based on ) obtained from NMR data. In a parabolic band for noninteracting carriers, ) is given by ) = where . Here is the carrier concentration and the renormalized effective carrier mass. Therefore one can get a simple relation of ) (). From the values of and/or where the effect from can be negligible, the carrier concentration in Ag2Ge48Te50 is found to increase about 380 from that of Ge50Te50 while the carrier concentration in Sb2Ge48Te50 is reduced only by 16. Since there are 1.85 cm-3 Ge atoms in Ge50Te50, the replacement of two Ag atoms for two Ge atoms out of 50 provides additional 7.4 cm-3 holes into the system. On the other hand, the substitution of two Sb atoms should reduce the same amount of carrier concentration (7.4 cm-3). Therefore the large increase of the carrier concentration by the Ag substitution and the slight decrease of that by the Sb substitution cannot be explained by the simple substitution effect. Thus these results strongly indicate that the number of Ge vacancies must be different for Ag or Sb substitutions. A similar conclusion has been pointed out in our previous paper.Levin2016
To get insight of the origin of the metallic conductivity in Ge50Te50, particularly the vacancies effects on electronic structure of Ge50Te50, we performed first principles calculations where we employed a full-potential linear augmented plane wave method (FP-LAPW)Blaha2001 with a generalized gradient approximation (GGA) functional.Perdew1996 We constructed supercells which are composed of 27 Ge atoms and 27 Te atoms and randomly choose sites for vacancies or for Ag substituted site. For obtaining self-consistent charge density, we employed = 7.0 and = 2.3 and 2.8 a.u. for Ge and Te atoms respectively. We selected 828 -points in Irreducible Brillouin Zone for obtaining self-consistent charge and density of states (DOS). As convergent criteria, we used energy difference 0.0001 Ry/cell, charge difference 0.0001 e, and force difference 1.0 mRy/a.u. between self-consistent steps. To get optimized structure, we relaxed atoms around vacancy or the substituted atom so that forces on each atom are less than 2.0 mRy/a.u.
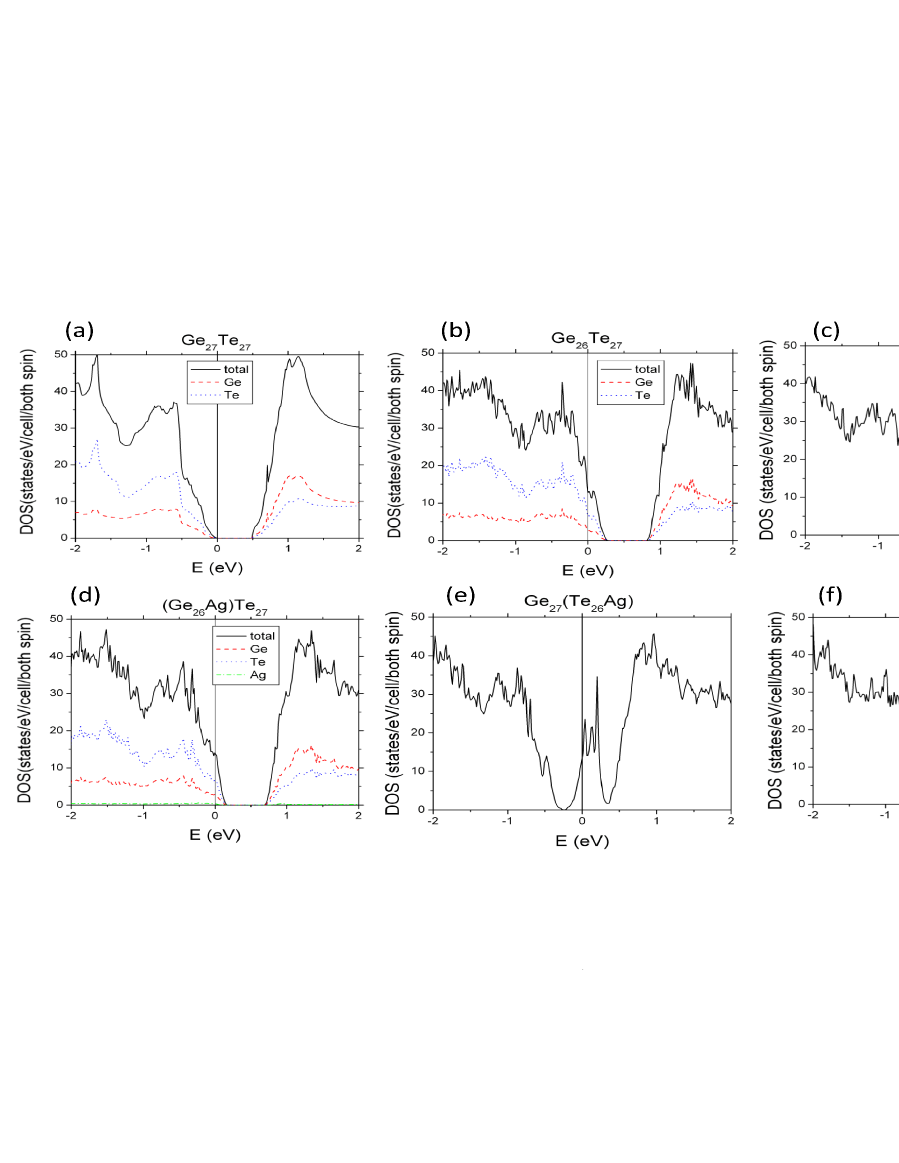
Figure 6(a) shows the calculated DOS for a perfect Ge27Te27 without any defect, with a band gap of 0.5 eV (semiconductor nature). This agrees well with previous reports.Polatoglou1982 ; Singh2013 ; Gevacancy2006 Here we show atomic decomposed DOS of the perfect Ge27Te27, where the black line shows the total DOS. The red and blue dotted lines show DOS from Te 5 and Ge 4 electrons, respectively. Figures 6(b) and 6(c) show the vacancy effect on DOS. In the case of a vacancy at the Ge site (Ge26Te27), Fermi level moves to lower energy while keeping the similar gap structure with the case of Ge27Te27. This produces a finite DOS at , giving rise to metallic characters. Here the most part of DOS at originate from Te 5 and Ge 4 electrons. On the other hand, a vacancy at the Te site (Ge27Te26) keeps semiconducting states although some isolated states are developed in the gap. Thus we conclude that a vacancy at the Ge site gives rise to -type metallic conductivities in Ge50Te50 as has been observed in experiments. A similar conclusion based on electronic structure calculations has been reported by Edwards .Gevacancy2006 We further investigate the Ag substitution effect on electronic states. Figures 6(d) and 6(e) show a Ag atom substitution effect on DOS. While replacing a Ge atom by a Ag atom lowers Fermi level and gives metallic characters as in the case of Ge vacancy, replacing a Te atom develops some isolated states in the gap and places on the isolated states. Finally, Fig. 6(f) shows DOS for a case that a Ag atom replaces a Ge atom and a vacancy on a the Te atom site. In this case the impurity states are sharper than other cases and is located at center of isolated states. As we discussed, our NMR data were well explained by the two band model where one band overlaps the Fermi level giving metallic nature and the other band is separated from the Fermi level by an energy gap of = K. It is clear that the metallic band can be attributed to the Ge vacancy effect, while the second band cannot be explained by the effect. We found that a vacancy at the Te sites produces isolated state in the gap, and one may think that it could be origin of the second band. However, our observation of a gap magnitude of K [ meV] is much smaller than the gap energy of order (0.1 eV) even if we take the isolated states created by the Te defects into consideration. Therefore, we consider that the observed semiconducting nature cannot be attributed to the Te-defect effects but probably fine structures of DOS near the Fermi level.

Finally it is interesting to point out inhomogeneity of electronic states in the samples. According to Levin Levin2013PRB electronic inhomogeneity have been observed in some semiconductors such as PbTe from measurements. Here we investigate homogeneity of electronic states in the samples by measuring at = 4.3 K and different positions in the spectra for the three samples. As shown in Figs. 7 (a)-(c), seems to depend on the positions of the spectra, where we plotted 1/ together with the corresponding spectrum. One can see that has a trend of the slight increase at lower magnetic field positions giving to greater . For example, the at the peak position of Ge50Te50 is 0.36 (sK)-1, while the 0.50 (sK)-1at a lower field position ( = 7.4033 T). The enhancement of 1/ and the larger at lower magnetic fields are consistent with an increased carrier concentration. Since 1/ and values are related to ), this result indicates that the electronic state in Ge50Te50 is likely inhomogeneous. Similar behaviors have been observed in Ag2Ge48Te50 and Sb2Ge48Te50. These results indicate electronic states of all GeTe-based materials investigated here are inhomogeneous which could originate from a possible inhomogeneous distribution of defects creating areas with differing carrier concentrations in Ge50Te50 and M2Ge48Te50 (M = Ag, Sb).
IV Conclusion
We have carried out 125Te NMR measurements to microscopically investigate the electronic properties of Ge50Te50, Ag2Ge48Te50 and Sb2Ge48Te50. For Ge50Te50, NMR shift and 1/ data are nearly temperature independent at low temperatures below 50 K and both increase slightly with increasing temperature at high temperatures. These behavior are well explained by a two band model where one band overlaps the Fermi level and the other band is separated from the Fermi level by an energy gap of = K. Korringa analysis indicates that the conduction carriers can be considered as free carriers with no significant electron correlations at low temperatures. On the other hand, Korringa ratio increases slightly at high temperature, suggesting the slight enhancement of the electron correlation. First principle calculation revealed that the metallic band originates from the Ge vacancy while the semiconductor-like band may be related to the fine structure of the density of states near the Fermi level. Low temperature 125Te NMR data for Ag2Ge48Te50 and Sb2Ge48Te50 clearly demonstrate that the carrier concentration changes by Ag or Sb substitutions where the Ag substitution increases hole concentration while Sb substitution decreases the concentration.
Acknowledgements.
The research was supported by the U.S. Department of Energy, Office of Basic Energy Sciences, Division of Materials Sciences and Engineering. Ames Laboratory is operated for the U.S. Department of Energy by Iowa State University under Contract No. DE-AC02-07CH11358.References
- (1) R. A. Hein, J. W. Gibson, R. Mazelsky, R. C. Millerand, and J. K. Hulm, Phys. Rev. Lett. 12, 320 (1964).
- (2) E. F. Steigmeier and G. Harbeke, Solid State Commun. 8, 1275 (1970).
- (3) J. Akola and R. O. Jones, Phys. Rev. Lett. 100, 205502 (2008).
- (4) G. J. Snyder and E. S. Toberer, Nature Mater. 7, 105 (2008).
- (5) J. P. Heremans, V. Jovovic, E. S. Toberer, A. Saramat, K. Kurosaki, A. Charoenphakdee, S. Yamanaka and G. J. Snyder, Science 321, 554 (2008).
- (6) E. A. Skrabek and D. S. Trimmer, CRC Handbook of Thermoelectrics, CRC, Boca Raton, FL (1995).
- (7) E. M. Levin, M. F. Besser, and R. Hanus, J. Appl. Phys. 114, 083713 (2013).
- (8) D. Wu, L.-D. Zhao, S. Hao, Q. Jiang, F. Zheng, J.W. Doak, H. Wu, H. Chi, Y. Gelbstein, C. Uher, C. Wolverton, M. Kanatzidis and J. He, J. Am. Chem. Soc. 136, 11412 (2014).
- (9) R. Sankar, D.P. Wong, C.-S. Chi, W.-L. Chien, J.-S. Hwang, F.-C. Chou, L.-C. Chen and K.-H. Chen, Cryst. Eng. Comm. 17, 3440 (2015).
- (10) S.K. Plachkova, Phys. Status Solidi A 83 349 (1984).
- (11) B.A. Cook, M.J. Kramer, X. Wei, J.L. Harringa, E.M. Levin, J. Appl. Phys. 101, 053715 (2007).
- (12) E.M. Levin, S.L. Bud’ko, K. Schmidt-Rohr, Adv. Funct. Mater. 22, 2766 (2012).
- (13) F. Herman, R.L. Kortum, I.B. Ortenburger, J. P. Van Dyke, J. Phys. Colloq. 29, C4-62 (1968).
- (14) M. L. Cohen, Y. Tung, and P. B. Allen, J. Phys. Colloq. 29, C4–163 (1968).
- (15) H. M. Polatoglou, G. Theodorou, and N. A. Economou. Physics of Narrow Gap Semiconductors, pp. 221-225, Springer Berlin Heidelberg (1982).
- (16) D.J. Singh, J. Appl. Phys., 113, 203101 (2013).
- (17) D. H. Damon, M. S. Lubeli, and R. M. Mazelsky, J. Phys. Chem. Solids 28, 520 (1967).
- (18) N. V. Kolomoets, E. Y. Lev, and L. M. Sysoeva, Sov. Phys. Solid State 5, 2101 (1964).
- (19) N. V. Kolomoets, E. Y. Lev, and L. M. Sysoeva, Sov. Phys. Solid State 6, 551 (1964).
- (20) A.H. Edwards, A.C. Pineda, P.A. Schultz, M.G. Martin, A.P. Thompson, H.P. Hjalmarson and C.J. Umrigar, Phys. Rev. B 73 , 045210 (2006).
- (21) P. M. Nikolic, J. Phys. D 2, 383 (1969).
- (22) M. S. Lubell and R. Mazelskyl, J. Electrochem. Soc. 110, 520 (1963).
- (23) Y. Gelbstein, O. Ben-Yehuda, E. Pinhas, T. Edrei, Y. Sadia, Z. Dashevsky, and M. P. Dariel, J. Electron. Mater. 38, 1478 (2009).
- (24) Y. Gelbstein, B. Daro, O. Ben-Yehuda, Y. Sadia, Z. Dashevsky, and M. P. Dariel, J. Electron. Mater. 39, 2049 (2010).
- (25) L. Zhang, W. Wang, B. Ren, and Y. Yan, J. Electron. Mater. 40, 1057 (2011).
- (26) R. Wolfe, J. H. Wernick, and S. E. Haszko, J. Appl. Phys. 31, 1959 (1960).
- (27) J. P. Heremans and C. M. Jaworski, Appl. Phys. Lett. 93, 122107 (2008).
- (28) E.M. Levin, J.P. Heremans, M.G. Kanatzidis, K. Schmidt-Rohr, Phys. Rev. B 88, 115211 (2013).
- (29) E. M. Levin, Phys. Rev. B 93, 045209 (2016).
- (30) D. Wolf, Spin Temperature and Nuclear Spin Relaxation in Matter, (Clarendon, Oxford, 1979).
- (31) N. Bloembergen, physica 20, 1130 (1954).
- (32) G. Alæ, G. Frosali and O. Morandi, Scientific Computing in Electrical Engineering, Mathematics in Industry, 9, 271 (2004).
- (33) C.S. Lue, S.Y. Wang, C.P. Fang, Phys. Rev. B 75, 235111 (2007).
- (34) O. Kiyoshi, Jpn. J. Appl. Phys. 39, 407 (2000).
- (35) T. Moriya, J. Phys. Soc. Jpn. 18, 516 (1963).
- (36) A. Narath and H. T. Weaver, Phys. Rev. 175, 378 (1968).
- (37) A. V. Joura, D. O. Demchenko, and J. K. Freericks, Phys. Rev. B 69, 165105 (2004)
- (38) P. Blaha, K. Schwarz, G. K. H. Madsen, D. Kvasnick, and J. Luitz, WIEN2K, an Augmented Plane Wave + Local Orbitals Program for Calculation Crystal Properties (Karlheinz Schwarz, Technical Universität Wien, Austria), 2001.
- (39) J. P. Perdew, K. Burke and M. Ernzerhof, Phys. Rev. Lett. 77, 3865 (1996).