Constraint on Matter Power Spectrum on Scales from
Abstract
An analysis of the physics-rich endgame of reionization at is performed, utilizing jointly the observations of the Ly forest, the mean free path of ionizing photons, the luminosity function of galaxies and new physical insight. We find that an upper limit on provides a constraint on the minimum mean free path (of ionizing photons) that is primarily due to dwarf galaxies, which in turn yields a new and yet the strongest constraint on the matter power spectrum on scales. With the latest Planck measurements of , we can place an upper limit of on the lower cutoff mass of the halo mass function, or equivalent a lower limit on warm dark matter particle mass or on sterile neutrino mass , at confidence level, respectively.
1 Introduction
The Gunn & Peterson (1965) optical depth of Ly photons provides the strongest and most sensitive constraint on the neutral hydrogen fraction of the intergalactic medium (IGM). The integrated electron scattering optical depth of the universe provides a complementary constraint on the ionized fraction of the IGM, but is insensitive to the neutral hydrogen fraction as long as the IGM is mostly ionized.
Recent measurements of the electron scattering optical depths of the IGM by the cosmic microwave background radiation experiments (e.g., Hinshaw et al., 2013; Planck Collaboration et al., 2015) suggest that it may be significantly below redshift before the universe becomes half reionized. The observations of the high redshift () quasar absorption spectra from the Sloan Digital Sky Survey (SDSS) and others (e.g., Fan et al., 2006) and arguments based on the slowly and continuously evolving IGM opacity (e.g., Becker et al., 2007) suggest that only at the universe is sufficiently ionized to allow for detectable transmission of Ly photons hence definitive measurements of (low enough) Ly (and higher order Lyman series) optical depth.
It is generally accepted that stars are primarily responsible for producing most of the ionizing photons for cosmological reionization. While it seems relatively secure to further suggest that the reionization process has begun at based on analysis of expected emergence of first galaxies in the standard cold dark matter model (e.g., Trac et al., 2015), the combination of these independent observational indications now paints a reionization picture that is rapidly evolving at . Two important implications are that the so-called first galaxies that form out of primordial gas may be closer to us than thought before and that Popolation III (Pop III) stars formed with metal-free gas may extend to more accessible redshifts.
In this contribution we perform a detailed analysis of the endgame of the cosmological reionization at . We examine joint constraints on the IGM from considerations of both global and local ionization balances observationally and, for the first time, self-consistently in the context of the standard cold dark matter model. We find reasonable concordance between Ly optical depth, Lyman continuum (LyC) mean free path (mfp) and global recombination rate of hydrogen observationally and theoretically. We solve the global reionization equation, given the emissivity evolution in the context of the standard cold dark matter model normalized to the boundary conditions of required emissivity at and reionization completing at . We provide a detailed analysis of the attainable solutions of reionization histories to shed light on the overall topological evolution of the HII regions, the evolution of the Ly emitters, the neutral fraction of the IGM, and a new and powerful constraint on the matter power spectrum on small scales hence dark matter particle properties.
Our focus here is on placing a yet the strongest constraint on the scale-scale power in the cosmological model and, specifically, the strongest lower bound on the mass of warm dak matter particles. The physical insight on this particular point is new and may be described briefly as follows. The state of the IGM at is well fixed by the Gunn & Peterson (1965) optical depth of Ly photons, which in turn provides a tight constraint on the photoionization rate at in the post-reionization epoch. Since at is equal to , where is the global mean of effective ionization photon emissivity at , is the mean free path of ionizing photons at and is the spectrum-weighted mean photoionization cross section, a constant. Thus, a tight constraint on at is equivalent to an equally tight constraint on the product at . Note that already takes into account the escape fraction of ionizing photon from ionization sources (e.g., galaxies and others). The degeneracy between and can be broken, if one considers, jointly, a separate constraint placed by an upper limit on the integrated electron scattering optical depth of the universe from the latest cosmic microwave background radiation experiments (e.g., Planck Collaboration et al., 2016). This is where our new physical insight comes in. We point out that, when the product is fixed, a higher would require a lower , which in turn would cause the reionization process to shift to lower redshift hence give rise to a lower . In other words, there is a negative correlation between and . Since more small-scale power results in a lower , there is then a negative correlation between the amount of small-scale power and - more small-scale power leads to lower . As a result, an upper bound on placed by the latest CMB observations would translate to a lower bound on the amount of small-scale power hence a lower bound on the particle mass in the context of the warm dark matter model. This is the scientific focus of this paper.
2 On Sinks and Sources of Lyman Continuum at
2.1 Global Balance of Emission and Recombination
The hydrogen recombination rate per unit comoving volume at redshift is
| (1) |
and the corresponding helium I recombination rate is
| (2) |
where is
the mean hydrogen number density at ,
the primordial helium mass fraction,
is the clumping factor of the recombining medium.
The case B recombination coefficient
cm3s-1 at K
(Osterbrock, 1989).
The case B He I recombination coefficient is
at K
(Osterbrock, 1989).
To prevent the already ionized IGM from recombining, the amount of ionizing photons entering the IGM has to be, at least, equal to the total recombination rate, resulting in the well known minimum requirement of ionizing photon production rate (e.g., Madau et al., 1999)
| (3) |
assuming that helium II is not ionized. We shall call this constraint expressed in Eq 3 “global constraint". For clarity we will adopt the convention to use and to denote comoving and proper , respectively. Early hydrodynamical simulations suggest at (e.g., Gnedin & Ostriker, 1997). More recent simulations that separate out dense interstellar medium (ISM) from the IGM indicate a lower at (e.g., Sokasian et al., 2003; Iliev et al., 2006; Pawlik et al., 2009; Shull et al., 2012; Finlator et al., 2012). Pawlik et al. (2009) give
| (4) |
which we will use in the calculations below. As we demonstrate later, the value at is concordant between considerations of global and local ionization balances.
2.2 Local Balance of Ionization and Recombination
A second, independent determination of ionizing photon production rate can be obtained from the Ly optical depth around cosmic mean density, , i.e., the Gunn & Peterson (1965) optical depth, at , where observational measurements are available. Because of the large cross section of neutral hydrogen for Ly scattering, is the most sensitive probe of neutral medium in the low neutral-fraction regime. From the SDSS observations of high redshift quasar absorption spectra is directly measured (Fan et al., 2002, 2006). When analyzed in conjunction with density distributions of the IGM from hydrodynamic simulations, one can infer both the volume weighted neutral fraction and the ionization rate , expressed in units of , . Because the mean density regions that determine the volume-weighted neutral fraction are well resolved in simulations (i.e., the simulation resolution is much finer than the Jeans scale of the photoionized IGM), the uncertainty on the determined volume-weighted neutral fraction is small and does not depend sensitively on cosmological parameters, either. The analysis performed by Cen & McDonald (2002) uses a smaller sample of SDSS quasars coupled with simulations of Cen et al. (1994). The analysis performed by Fan et al. (2006) utilizes a larger quasars sample and the density distribution function of Miralda-Escudé et al. (2000). Both studies derive, independently, . For the subsequent calculations, we will use
| (5) |
at from Fan et al. (2006).
Under the assumption that the spatial scales of fluctuations (or clustering scales) for both sources and sinks are substantially smaller than the mean free path of LyC photons, then the (approximately uniform) ionizing flux at any spatial point is
| (6) |
where is the mean emissivity of ionizing photons entering the IGM. We note that the 2-point correlation length of galaxies at is cMpc (e.g., Ouchi et al., 2010), much smaller than cMpc, which we will discuss later. Therefore, the above assumption is a good one, so long as stellar sources are the main driver of cosmological reionization. We expect that radiation flux fluctuations would be on the order of the ratio of the two lengths scales above, i.e., . As we will show later that, in the context of the CDM model, depends on approximately as . Thus, we expect that the uniform radiation assumption is accurate statistically for computing the mean at level, with negligible systematic biases. The hydrogen ionization rate
| (7) |
where is the spectrum-weighted mean photoionization cross section,
| (8) |
where is the photon energy-dependent hydrogen ionization cross section, is the ionizing photon spectrum. We will use for Pop II stars of metallicity from Tumlinson et al. (2001), which may be approximated as
which results in the fiducial value that we will use in our calculations at ,
| (9) |
Combining Eq (5, 7, 9) gives the constraint on comoving emissivity at from Gunn-Peterson optical depth, named "local constraint",
| (10) |
In Eq 10 it is seen that there is a significant, linearly inverse dependence of on , which we now discuss in length observationally here and theoretically in the next subsection.
Traditionally, is determined by counting the incidence frequency of Lyman limit systems (LLSs) (e.g., Storrie-Lombardi et al., 1994; Stengler-Larrea et al., 1995; Songaila & Cowie, 2010; Ribaudo et al., 2011; O’Meara et al., 2013) and generally found to be in the range of at , when extrapolated from lower redshift trends. This method to determine contains some ambiguity as to the dependence of the incidence frequency on exact choice of column density threshold of LLSs, and uncertainties related to absorption system identifications (such as line blending) and collective absorption due to clustering of absorbers. A more direct approach to determining is to measure the optical depth at Lyman limit directly, as pioneered by Prochaska et al. (2009). A recent application of that technique to a large sample of (163) high redshift quasars is cast into fitting formula pMpc that covers up to redshift (Worseck et al., 2014). Extrapolating this formula to results in a median value of pMc,
| (11) |
with the and range of pMpc and pMpc, respectively. It is seen that the directly measured are in broad agreement with those based on counting LLSs, which is reassuring. Nevertheless, it is prudent to bear in mind a significant caveat that at is not directly observed but requires extrapolation from lower redshift data.
2.3 Concordance of Independent Observations at
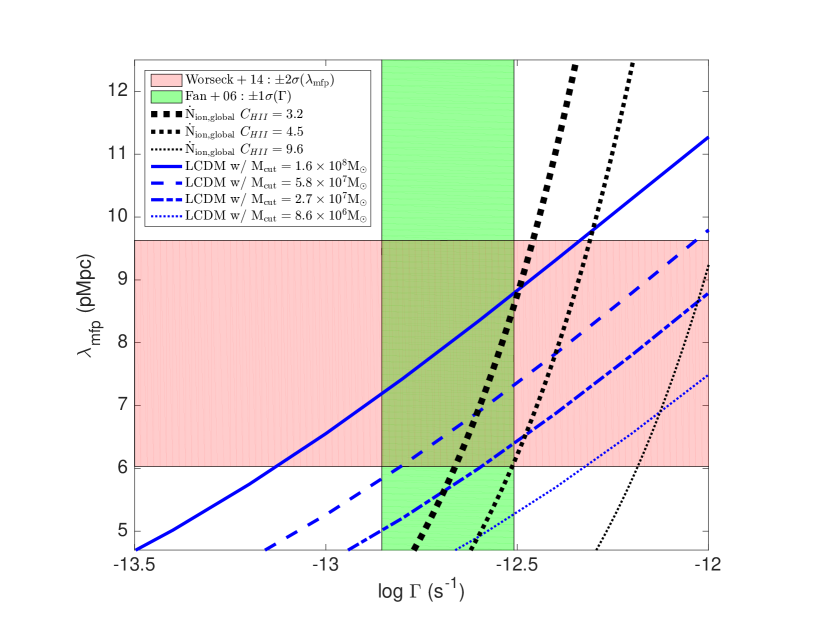
We now combine three independent sets of observational constraints on , and on the plane, shown in Figure 1: (1) the observed from Worseck et al. (2014) based on Lyman continuum radiation optical depth at (see Eq 11) are shown as the red solid curve (mean), thick red dashed curves () and thin red dashed curves (); (2) the observationally inferred range of based on measurement of Ly absorption optical depth at from Fan et al. (2006) are shown as the two vertical green dashed lines (see Eq 5); (3) lower bound based on a global balance between emissivity and recombination with Eq 3 assuming clumping factor and gas temperature K, shown as dotted black (thick, median thick, thin) curves.
To be conservative, we will use the range of from Worseck et al. (2014) for our discussion, because of the possible additional, systematic uncertainty of using an extrapolated value from the observed highest redshift of to . Thus, the allowed parameter space is enclosed by the two thin dashed red horizontal lines and the two vertical dashed green lines. This space is then further constrained by the requirement that only to the right of each of the dotted black curves is attainable, depending on the assumed clumpying factor . The placement of this additional requirement on the plane suggests that at may not be feasible but the values in Eq 4 that is obtained from recent radiation hydrodynamic simulations and adopted here are fully consistent with this constraint.
It is by no means guaranteed a priori that there is any parameter space left when all these three independent observational constraints are considered, due to uncertainties in individual observations. Hence, the fact that there is suggests a concordance among the independent observations.
2.4 Global Stellar Emissivity of Ionizing Photons at
Figure 1 in §2.4 summarizes the current state of constraints on the required emissivity of ionizing photons in the IGM at , in order to (1) keep the IGM ionized globally, (2) keep the IGM ionized locally as demanded by the optical depths probed by the hydrogen Lyman series absorption lines. The multi-faceted agreement is indeed quite remarkable, providing a validation of the different observations at (in some cases extrapolation is needed) in the post-overlap epoch.
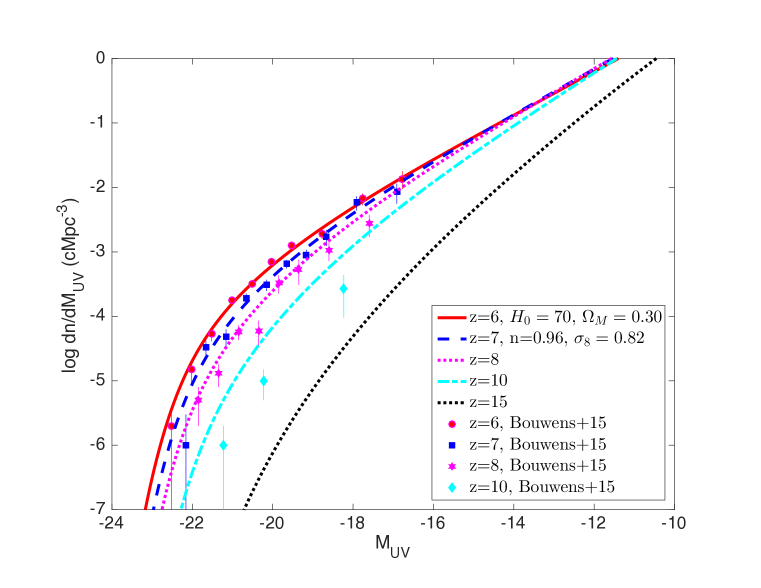
We now address “sources" of ionizing photons, in a fully self-consistent fashion, in the standard cold dark matter model. We follow the approach taken by Trac et al. (2015), to which the reader is referred for a more detailed description. Briefly, the method uses direct observations of galaxy luminosity functions at high redshift in the Hubble UDF to calibrate the star formation parameters in the model based on halo mass accretion rate functions in the CDM model. Figure 2 shows a comparison of rest-frame FUV luminosity functions between the model based on the most recent cosmological parameters and observations at various redshifts. The observed LFs are most reliable at and become less so towards higher redshifts, and perhaps less than trustworthy beyond due to lack of spectroscopic confirmation at present. For a given small region/area, such as the UDF, cosmic variance becomes more problematic towards higher redshift. Additionally, it is possible that the observed LFs at high redshifts, in the midst of reionization, may be masked by possible reionization effects; this issue is significantly more acute for Ly emitting galaxies (e.g., Mesinger et al., 2004; Haiman & Cen, 2005; Dijkstra et al., 2007). These problems can be circumvented, if we normalize the model at and use the “global" LFs from the model at high redshifts where direct observations lack or are unreliable. We take this approach.
From Figure 2 we see that the model LFs match observations well at . The agreement is still good at , albeit with “noisier" observational data. There is very little to glean from the comparison at , simply because the observational data lack both quantity and quality. Integrating the Schechter fits of the Bouwens et al. (2015) LF at yields the intrinsic ionizing photon production rate from galaxies of
| (12) |
In obtaining , we have used a relation between ionizing photo production rate per unit FUV spectral density from (Robertson et al., 2013),
| (13) |
which is based on the observed FUV spectral index for high redshift galaxies. Note is in defined in spectrum , or , in the FUV spectral range. The accuracy of the normalization of our model is such that the model LF at gives the same integrated light density as the observed one to the third digit.
Integrating the LF based on the CDM model yield , weakly dependent on lower limit. Dividing in Eq 1 by gives the mean luminosity-weighted escape fraction of Lyman continuum
| (14) |
We will show in §4 how plays a key role in determining a lower bound on and how that in turn allow for a strong constraint on hence .
3 Reionization Histories Constrained by the State of IGM at
Any reionization history must satisfy the state of the IGM at and the fact that the IGM is opaque to Ly photon at just above that redshift. In this sense, the history of cosmological reionization becomes a boundary value problem, where we solve the evolution of HII volume fraction with the following equation:
| (15) |
where is the comoving mean number hydrogen density, and
is the mean recombination time of ionized hydrogen in HII regions.
Any solution to Eq 15 satisfies the following two boundary conditions:
| (16) |
and
| (17) |
In Eq 15 at , since is fixed by the CDM model (see Figure 2), we are left with only one degree of freedom, namely, the evolution of with redshift. We model the redshift evolution of using a simple powerlaw form:
| (18) |
Note that in Eq 18, like in Eq 14, is averaged over all the galaxies at a given redshift; in other words, is the ratio of the total number of ionizing photons entering the IGM to the total number of ionizing photons produced. There is one additional physical process that is largely unconstrained by the state of the IGM at but is important for the overall reionization history and integral electron scattering optical depth. That is, a change of IMF at some high redshift from regular Pop II stars to a perhaps more top-heavy and/or metal-free IMF, which may lead to a quantitative transition in ionizing photon production efficiency per unit stellar mass, . Thanks to our lack of knowledge with regard to this process, we choose to model generally, albeit in a simple way, as
| (19) |
where
and are
ionizing photon production efficiency per unit stellar mass for Pop III and Pop II IMF, respectively.
We adopt
and
(e.g., Bromm et al., 2001),
resulting in ratio of
,
which enters our calculations.
The transition between Pop III and Pop II is modeled by a smoothed Heavyside step function
| (20) |
where is the amount of stars formed by redshift computed in the CDM model in units of critical density, , controls the transition from Pop III to Pop II when the amount of stars formed by some redshift in units of critical density has reached this value, and controls the width of this transition in units of ; when , one recovers the unsmoothed Heavyside step function. So far, we have three parameters to model the evolution of ionizing photon beyond , , and . As we will show later, the dependence of results on is sufficiently weak that can effectively be considered fixed, as long as its value is not too large. Therefore, we effectively have two free parameters in our model, and . Given that we have one equation, Eq 15, the general expectation is that there will be a family of solutions that will be able to meet the two boundary conditions, Eq 16, 17. Conversely, though, solving Eq 15 to obtain does not necessarily result in an IGM at that is consistent with the constraint imposed by the observations of Ly optical depth, i.e., Eq 18, a point already noted by others (e.g., Robertson et al., 2013).
For each solution of , we compute the total electron scattering optical depth from to recombination redshift by
| (21) |
where accounts for redshift evolution of helium contribution, we use for and for , approximating He II reionization as a step function at , which is consistent with the observed He II absorption optical depth data of (Worseck et al., 2011), interpreted in the context of He II reionization simulations of (McQuinn et al., 2009). And and account for stellar density and neutral hydrogen density, respectively, which do not contribute to electron density. Wilkins et al. (2008) give , while (Grazian et al., 2015) yield . We interpolate between these two points to find an approximate stellar evolution fit as , translating to . Post-reionization most of the neutral hydrogen resides in DLAs and the observational data on the evolution of DLAs are available, albeit with significant errorbars. We approximate the data presented in Noterdaeme et al. (2009) by piece-wise powerlaws as follows: at , which evolves linearly to at , which remains at at , after which it linearly rises at , followed by a constant at .
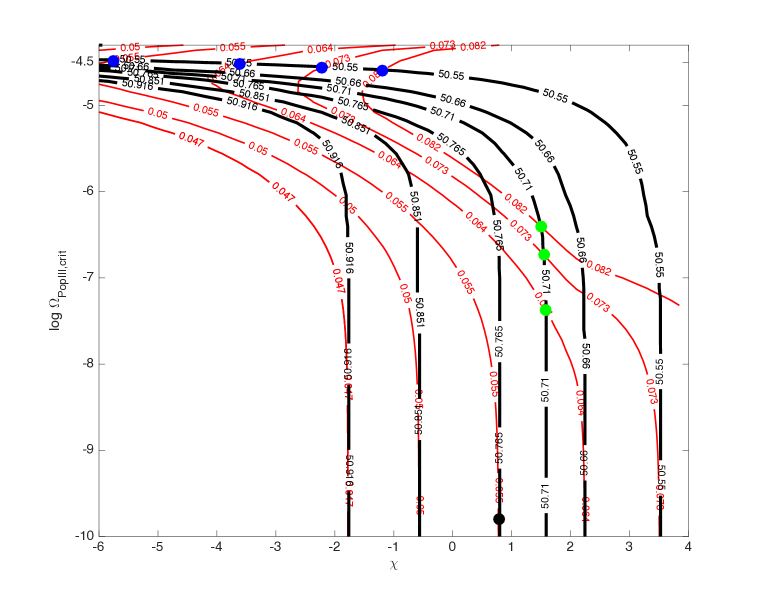
Figure 3 shows the case with , to be examined in greater details. We have examined cases with and find that the results, as displayed in Figure 3 in terms of the contours, depend weakly on . We note that the conclusions obtained are generic and more importantly, the solution family obtained that is still viable is very insensitive to the choice of .
It proves useful for our discussion to rewrite one of the boundary value constraints, namely, Eq 16, as
| (22) |
where the range inside the first pair of parentheses on the right hand side corresponds to lower and upper limits of Eq 5. In this parameter space of shown in Figure 3 we have solutions to Eq 15 that satisfy Eq 17, i.e., the universal reionization completes exactly at with varying shown as the black contours. Superimposed as the red contours are values of for each solution.
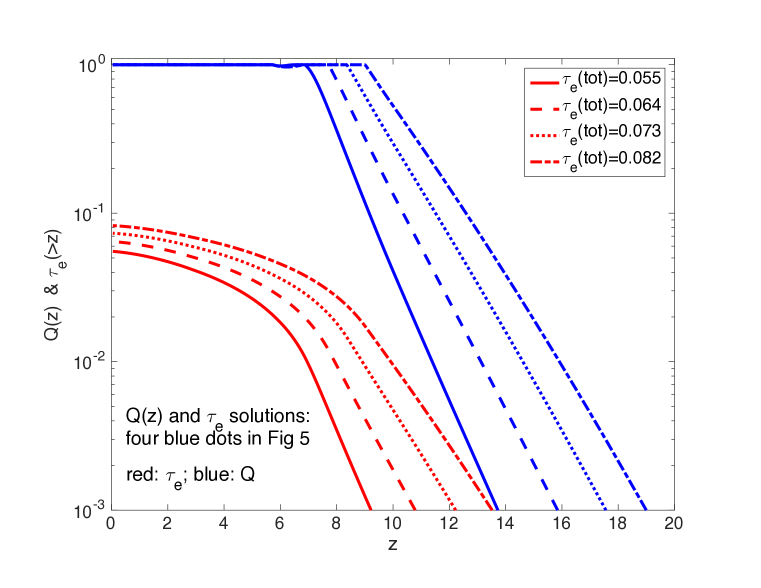
It is now clear that the value of plays a key role in determining the viability of each solution of . Under the two boundary conditions, Eq 16 and 17, two families of solutions are possible, each of which is simultaneously consistent with the latest values of from Planck Collaboration et al. (2016) observations. Indicated by the four blue dots in Figure 3 are four solutions in the (we call) “Pop III-supported" family with corresponding to the (central, , , ) values from Planck Collaboration et al. (2016).
Figure 4 shows each of the four solutions of (blue curves) indicated by the four blue solid dots in Figure 3, along with the respective cumulative (red curves). The common characteristics of these solutions in this solution family are that (1) , indicating that the escape fraction decreases with increasing redshift, (2) the Pop III stars make a significant and late contribution to the overall ionizing photon budget. The combination of negative and late, significant Pop III contribution permits a slight dip in ionized fraction at a redshift slightly higher than , to satisfy 17. This set of solutions, however, may be inconsistent with some other independent observations. Here we provide some notable examples.
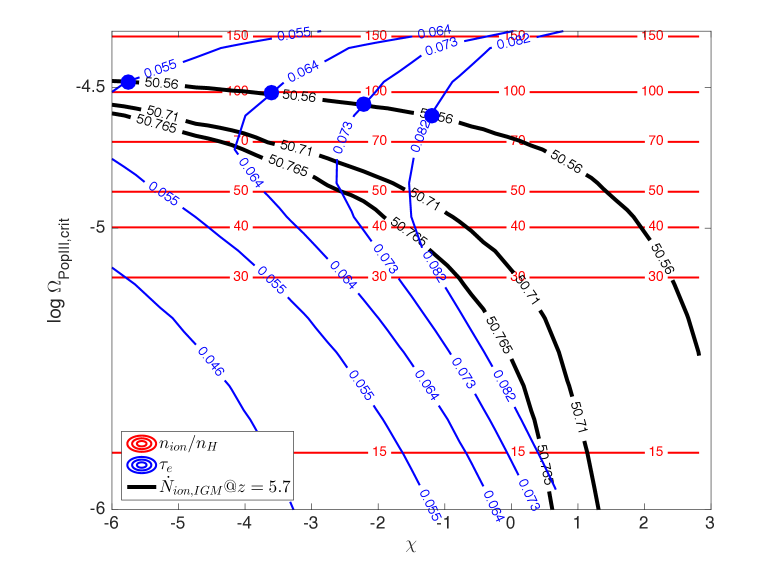
Figure 5 shows contours of the ratio of the number ionizing photon produced per hydrogen atom (red). Fang & Cen (2004) perform a detailed analysis of metal enrichment history and show that Pop III to Pop II transition occurs when ionizing photons per hydrogen atom, depending on the model for the IMF, have been produced by Pop III stars, based on considerations of primary atomic cooling agents, CII and OI, at low temperature, corresponding to and (Bromm & Loeb, 2003). For the four solutions, indicated by the four blue dots in Figure 5, we see much higher, ionizing photons per hydrogen atom have been produced at the model transition , in order to attain the solutions. Note that in the scenario of dust cooling induced fragmentation (Schneider & Omukai, 2010), the critical transition metallicity is orders of magnitude lower that is still more stringent. These considerations indicate that these solutions are self-inconsistent, in the sense that the required Pop III contribution in order for the solutions to be possible is unattainable.
A second example concerns the neutral fraction of the IGM during the epoch of reionization at . In a recent careful analysis of possible signatures of damping wing absorption profiles of the Ly emission line of quasar J1120+0641 at , under the assumption that DLAs, being sufficiently rare, are not responsible for the absorption of the Ly emission redward of the line, Greig et al. (2016) conclude that the mean neutral fraction of the IGM is (). All of the four solutions shown in Figure 4 have the mean neutral fraction significantly less than a few percent, thus are ruled out at level.
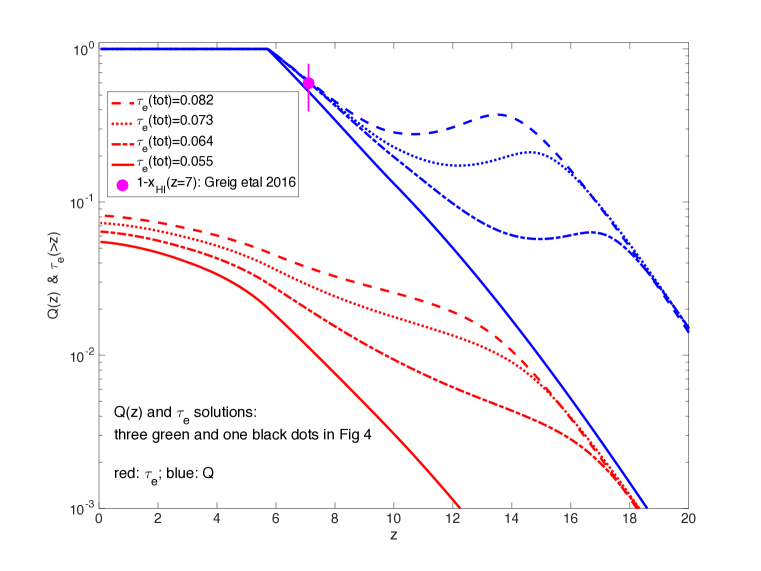
Let us now turn to the other solution family with reduced Pop III contribution that is additionally confined to much higher redshift. Figure 6 shows each of the three solutions of (blue curves) indicated by the three green and one solid dots in Figure 3, along with the respective cumulative (red curves). Several trends shared by solutions in this solution family may be noted. First, increases exponentially as a function of redshift in the range of to , depending on the value of total ; a lower total corresponds to a higher redshift, but lower value of base, from which the exponential growth starts. All four solutions are consistent with the observationally inferred mean neutral fraction of the IGM at , shown as a magenta dot with range (Greig et al., 2016). Second, there is a distinct, separate peak at , for (in that order) with height of (in the same order). This high redshift peak of is due to contributions from Pop III stars. The exact height and duration of this peak may depend on the assumptions concerning the transition from Pop III to Pop II temporally and spatially, that will require detailed modeling beyond the scope of this work. We note, however, that the results do not change significantly when values of are used ( is used for the case shown in Figure 6), suggesting that the existence, the value of the peak and the peak redshift are fairly robust. We also note that all these solutions lie below , which, when compared with Figure 5, indicates a consistency in terms of Pop III stars forming in the metallicity regime that is physically plausible, if low temperature atomic cooling, not dust cooling, dictates fragmentation of star-forming gas clouds. Finally, it is seen that these solutions have , indicating that the escape fraction increases with increasing redshift, perhaps not an unexpected result based on physical considerations that galaxies at high redshifts are less massive, their star-formation episodes more bursty and consequently their interstellar medium more porous to allow for more ionizing photons to escape. Simulation results are consistent with this trend (e.g., Kimm & Cen, 2014). In summary, this solution family are self-consistent.
If, however, holds up,
there is no solution of with
.
In order to get a solution with ,
one requires
,
which, with the conservative choice of value (see Eq 5),
in turn requires ,
which would be at about lower bound of the observationally inferred value.
In combination with the value of used,
such an event would be a occurrence,
suggesting tension,
which we examine in the next section.
4 : A Strong Test of Matter Power Spectrum on Small Scales
We were left in a state of significant tension between accommodating and based on the extrapolated observational data at in §3. The tension may be alleviated, if one chooses not to strongly advocate the central value of (Planck Collaboration et al., 2016) but instead emphasize the harmonious concordance between , and . We take this discrepancy in a somewhat different way and suggest that the extrapolation of the lower redshift measurement of should be taken with caution, despite the smooth trend seen in the observed redshift range (). We take a step further yet to perform a theoretical analysis to better understand the physical origin of in the context of the standard cosmological model.
It is useful to separate out the overall into two components in the post-overlap epoch at , one due to the “translucent", general volume-filling low density IGM that collectively attenuates ionizing photons and the other due to "opaque" disks (like LLSs) that block entirely all incident ionizing photons. We shall denote them and , respectively. The total is
| (23) |
The can be approximated by the volume-weighted neutral fraction of the IGM as
| (24) |
where is the volume-weighted neutral fraction of the IGM, inferred by the directly observed Ly (and higher order Lyman transitions) optical depth at (Fan et al., 2006). As we have argued earlier, while the mass-weighted neutral fraction determined from such a method may be significantly model-dependent, the volume-weighted neutral fraction is not expected to be, because it is free from clumping factor dependence and most of the optical depth contributions stem from low-density regions of optical depth of order unity whose Jeans scales are typically resolved in most simulations used.
stems from self-shielding dense gas in halos. A computation of may not seem a well posed problem at first sight, because it would appear to depend on both the abundance of halos and their cross sections (the sizes of radiation blocking disks). It is not immediately obvious how one may precisely specifiy their cross sections, even if their abundance is known. We show that this ambiguity can be removed, when considerations are given to the physical conditions of halo gas as a function of halo-centric radius and a “correct" definition of is adopted, which we now describe.
After the HII regions have overlapped in the aftermath of reionization, neutral gas in halos essentially becomes a set of disconnected isolated islands that are increasingly self-shielded and optically thick to ionizing photons toward to the centers of halos. Under the assumption of spherical symmetry, for a given halo, we can compute the column density as a function of halo-centric radius outside-in as
| (25) |
where is overdensity, for which we use the universal halo density profile (NFW, Navarro et al., 1997) with gas following mass over the relevant radial range (e.g., Komatsu & Seljak, 2001). In the core region of a halo the gas density is constrained such that the gas entropy does not fall below the entropy of the gas at the mean density and cosmic microwave background temperature. In practice, the upper limit of the integral in Eq 25 is chosen when (i.e., the mean density) but its precise value makes no material difference to the calculated in the range of relevance. The local neutral fraction at radius can be computed using the local balance between recombination and photoionization through a spherical radiative transfer:
| (26) |
where is the “background" ionization rate prior to significant attenuation when approaching the halo. We solve Eq (25,26) numerically to obtain and , for a given .
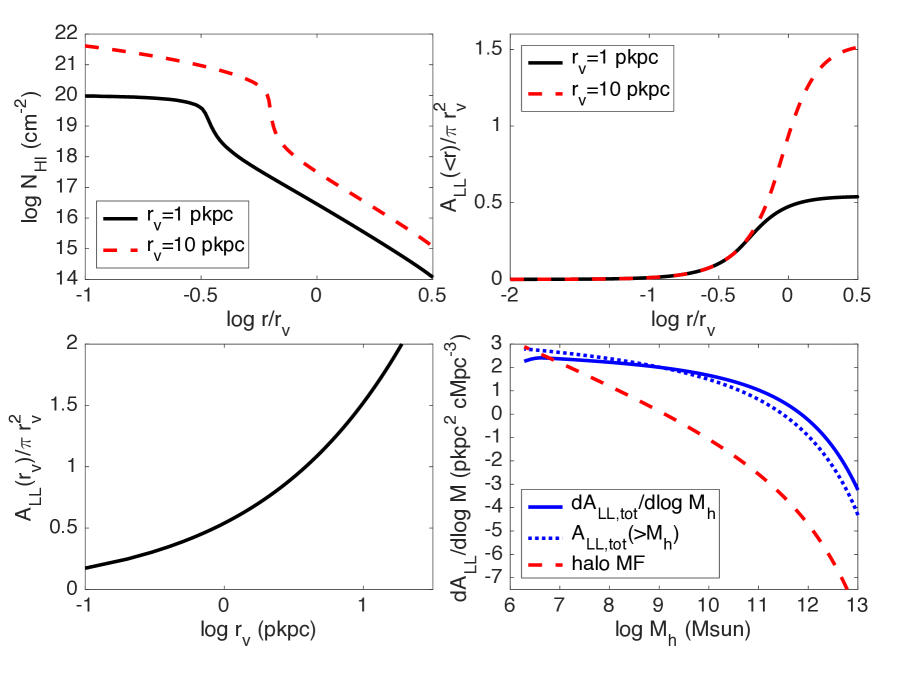
In the top-left panel of Figure 7 we show the integrated column density (from outside inward down to the radius ) as a function of halo-centric radius (in units of virial radius ) for two cases with virial radius equal to pkpc (black solid curve) and pkpc (red dashed curve), respectively. We see that at about the column density is well below , confirming that the exact integration starting radius is not important for column densities in the relevant range for significant attenuation of LyC photons. In both cases we also see that there is a rapid upturn of the column density starting around , indicating the radial location of the beginning of self-shield and transition from a highly ionized to an increasingly neutral medium. The rapid ascent suddely flattens out at , sigalling the arrival of a largely neutral medium, coincidental with column density similar to that of the damped Lyman alpha systems (DLAs). It is instructive to note that the transition from ionized to an increasingly neutral medium is halo virial radius (or halo mass) dependent, with a larger halo transitioning at a larger radius in units of its virial radius. This indicates that the density of the ionizing front propagating into halos is halo mass dependent, suggesting that the common practice of using a constant density as a proxy for the density of ionization front (e.g., Miralda-Escudé et al., 2000) could potentially be slightly extended, although a more detailed analysis should be performed to assess this.
To devise an appropriate method to compute the effective cross section for LyC photons for a given halo, it is useful to gain a more clear understanding of the physical meaning of . For a line of sight cross area of size , if it is completely opaque to ionizing photons, then the effective area for intercepting LyC photons would be just equal to . For a cross area of size that is not completely opaque to LyC photons, one may define the effective area for intercepting ionizing photons , which is
| (27) |
where is the column density integrated along that line of sight (not the radially integrated column density shown in the top-left panel of Figure 7), which is computed using and that we have numerically obtained solving Eq (25,26).
Upon integrating the projected area of a halo, we obtain the cumulative cross section for ionizing photons of a halo as a function of projected radius
| (28) |
The top-right panel of Figure 7 shows in units of the virial area () as a function of halo-centric radius in units of the virial radius for the two halos shown in the top-left panel of Figure 7. To re-iterate a point made earlier, the total effective cross section is larger for larger halos in units of the virial area, shown quantitatively in the bottom-left panel of Figure 7. In the calculations performed involving the NFW profile, one needs to specify the concentration parameter , which has been computed by a number of groups (e.g., Bullock et al., 2001; Wechsler et al., 2002; Angel et al., 2016; Ricotti et al., 2007). We adopt the results of Dolag et al. (2004): ; the results obtained do not sensitively depend on slightly different formulae of in the literature.
We compute by
| (29) |
where is the total cross section of LyC photons for a halo of mass ; is the halo mass function at the redshift in question. The bottom-right panel of Figure 7 shows cross section function, (solid blue curve), its cumulative function (dotted blue curve), along with mass function, (dashed red curve), as a function of . We see that the cross section function is significantly flatter than the halo mass function, due to the fact that the cross section in units of virial area is higher with increasing halo mass, i.e., correlates positively with , shown in the bottom-left panel of Figure 7. Nonetheless, scales still sub-linearly with , causing to increase with decreasing halo mass .
The relation in the standard CDM model
for four cases of
,
corresponding to a halo virial temperature cutoff of K,
are shown also in Figure 1 as the blue curves.
First of all our results affirm a general self-consistency between radiation field and ionization structures around halos in the CDM model,
since the theoretically predicted relation (the blue curves) can go through this already tightly constrained parameter space.
This is a strong and unique support for the CDM model with respect to its matter density
power spectrum (both amplitude and shape)
on small scales corresponding to halo masses approximately in the range of .
It is noted that this constraint on matter power spectrum
is based entirely on the consideration of the halos as “sinks" of ionizing photons.
We point out the fact that depends sensitively
on the lower mass cutoff in the integral in Eq 29,
as shown in the bottom-right panel of Figure 7.
We show that this dependence provides a new, sensitive probe of the small-scale power in the cosmological model,
when confronted with measurements of .
It is useful to note that in computing we have neglected
possible constribution due to collisional ionization in halos with virial
temperature significantly above K.
Thus, our computed is somewhat overestimated and our subsequent conclusion
drawn on small-scale power conservative.
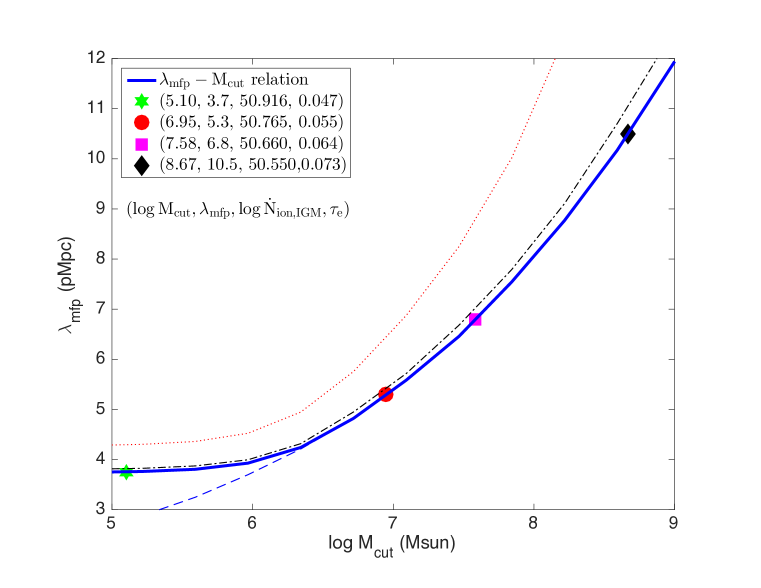
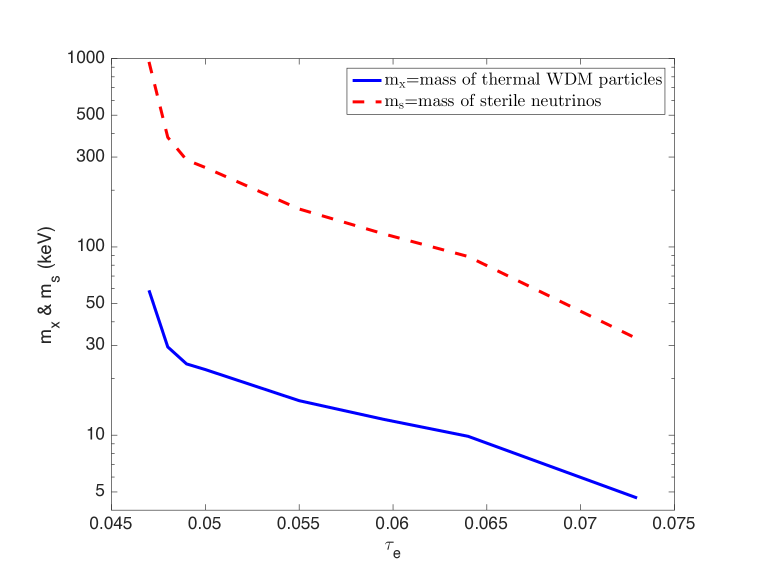
Figure 8 shows
as a function of the lower mass cutoff
in the integral in Eq 29 (blue solid curve).
Shown as symbols are four cases along the curve, with
equal to
(green star),
(red dots),
(magenta square)
and
(black diamond).
Each set of four numbers has the following relational meaning:
for a given measurement of ,
the minimum required ionizing photon emissivity entering the IGM is
in order for that to be a possible solution,
which in turn corresponds to a mean free path of ,
which can be achieved if the lower mass cutoff
of the halo mass function is
.
We see that the dependence of
on is significant,
which provides a new constraint on the small-scale power in the cosmological
model at a level that has hitherto been out of reach.
The dependence of
on shown in Figure 8
can be translated into a constraint on dark matter particles.
Here, we take warm dark matter as an example.
In the warm dark matter model the smoothing scale,
defined as the comoving half-wavelength of the mode for which
the linear perturbation amplitude is suppressed by 2, is
| (30) |
for a warm dark matter particle mass of (e.g., Viel et al., 2005), which we adopt as a proxy for a sharp cutoff (or free-streaming scale of particles). The equivalent free-streaming halo mass is then
| (31) |
Given the dependence chain of on on on , we obtain the lower bound on the mass of thermally produced warm dark matter particles as a function of shown as the blue solid curve in Figure 9. The lower bound on the mass of thermally produced warm dark matter particles can be translated similarly to a lower bound constraint on the mass of sterile neutrinos produced via active-sterile neutrino oscillations obeying approximately a generalized Fermi-Dirac distribution. In this case, the effect of sterile neutrino is approximately the same as for thermally produced warm dark matter by using the following expression to relate the two masses (Colombi et al., 1996; Viel et al., 2005):
| (32) |
The result is shown as the red dashed curve in Figure 9.
The current best constraint on based on Ly forest is (Viel et al., 2013), improving upon earlier studies that generally constrain (e.g., Narayanan et al., 2000; Barkana et al., 2001; Viel et al., 2005; Abazajian, 2006). Combining with the upper limit used for in our calculations, we find
| (33) |
based on and on . The corresponding constraint on sterile neutrino mass is
| (34) |
which basically rules out, for example, keV sterile neutrino dark matter model (Bezrukov & Gorbunov, 2014; Park et al., 2014; Abazajian, 2014). The lower bound placed on warm dark matter particle mass (or in general, on the small-scale power) hinges on the assumption that dark matter halos make up the bulk of the Lyman limit systems at . Are there possible caveats with respect to this assumption? Let us examine this.
Under a physically plausible scenario of stellar reionization, there are possibly two additional kinds of (significantly) neutral systems to serve as Lyman limit systems to contribute to the absorption of LyC photons. The first kind is neutral regions that envelope the expanding HII regions. Let us suppose that each HII region that is expanding has a radius of and the neutral region surrounding it has a thickness of . Analysis of the Ly forest at indicates a volume-weighted neutral fraction of the IGM at (Fan et al., 2006). This provides a constraint on the possible size of :
| (35) |
The ionization front propagation speed at is
| (36) |
where is mean hydrogen number density at . Thus, the time it takes to sweep through the radial shell of thickness would be
| (37) |
Thus, for any reasonable values of the parameters involved, is much shorter than the Hubble time at (which is about 1 Gyr). This suggests that such a configuration is highly unlikely. Note that our assumption that these shells surround spherical HII regions is not necessary but only for the ease of illustration. If these spherical shells are replaced by pancaky bridges or filamentary bridges between (or connecting) HII regions, the results and conclusions based on the above analysis remain largely the same, as long as the size of these pancakes or filaments are on the same order of pMpc; in terms of our conclusion reached, even for a size of pMpc, our conclusion remains unchanged.
The second kind of possible neutral regions may be comprised of patches of neutral islands in the voids that are last reionized. We approximate them as opaque spheres with a radius of and a mean separation between them of , which can be related to the observed :
| (38) |
The mean free path to LyC photons due to these islands would be
| (39) |
The typical separations of voids, i.e., , has to be on the order of the clustering scale of galaxies, which is about cMpc (e.g., Ouchi et al., 2010), or larger. This suggests that pMpc at , implying that possible, to-be-last-reionized neutral islands in voids do not contribute much to the mean free path of LyC photons at .
We thus conclude that halos likely contribute predominantly to the mean free path of LyC photons at (likely at all lower redshifts as well, for that matter). Finally, we note that for simplicity we have adopted the assumption of sphericity of gas distribution in and around halos in question. Any deviation from sphericity would result in a reduction in cross section hence a more stringent demand for more small scale power. In addition, we note that baryonic fraction may be lower than the mean universal fraction. Furthermore, some gas in large halos with virial temperature higher than K may be heated up to remove itself from the HI category. To give a sense of the magnitude of this effect we show in Figure 8 two additional cases where we assume that halos with virial temperature greater than K (thin, black dot-dashed curve) and K (thin red dotted curve), respectively, do not contribute to . We see a significant effect; numerically, to attain in order to yield , respectively, the required changes from for no upper cutoff to for upper cutoff of virial temperature of K, to for upper cutoff of virial temperature of K. Moreover, internal ionizing radiation may reduce the HI fraction. Therefore, our assumptions and derived limits on small-scale power and on dark matter particle mass are all on the conservative side.
5 Discussion
5.1 Rapid Reionization Towards
The intrinsic emissivities of LyC photons at and are almost identical. We can use this fact to outline the nature of percolation of HII regions near the end of the reionization. We first note that we find that the theoretically derived relation of at is nearly identical to that at at the visual resolution of eye when overplotted in Figure 1. It means, if the universe were in the post-overlap regime already at , its volume-weighted neutral fraction ought to be similar to that at . In other words, due to halos (mostly) based on CDM model and emissivity at can easily accommodate a transparent universe similar to the one observed at . The observations indicate otherwise: at versus at (Fan et al., 2006). Thus, the universe is not fully ionized at in the way of imposing a smaller hence a lower for a given . The likely, perhaps only, consistent solution would be that HII regions have not overlapped at so that neutral patches in the IGM (not in the halos) render much lower than the notional and in the post-overlap epoch. The inferred value of at (based on Ly absorption) (Cen & McDonald, 2002; Fan et al., 2006) suggests that at is an order of magnitude lower than that at . This is clear and fairly direct evidence that the percolation of HII regions is not yet complete at , indicating that the universe is in a rapid transitory phase from to clearing up some of the last neutral patches that dominate the mean free path, in a monotonic and irriversible process. Topologically, this indicates that HII regions transition from a set of isolated islands at to a connected network of swiss-cheese-like HII region at .
This expected rapid reionization process is consistent with and required by the necessary small values of at to achieve , which in turn requires contribution from minihalos (those with virial temperature less than K or virial mass less than at ). Gas in minihalo, when exposed to ionizing photons, responds dynamically by slowly evaporating through the action of thermal pressure of photoheated gas. Iliev et al. (2005) show that it takes about Myr to photoevaporate a minihalo of mass at . This process is expected to take longer for more massive minihalos. In our case, a minihalo of mass is relevant for (see the red dot in Figure 8); for minihalos of mass would be relevant (see the magenta square in Figure 8). Thus, it is probably true that, for the range of interest, the time scale taken for photoevaporation of relevant minihalos is Myr or longer. We note that the universal age difference from to is Myr, from to is Myr. We see in Figure 6 that the neutral fraction at is about , meaning about 40% of minihalos have not yet been exposed to ionizing radiation at . Thus, it is probable that a significant fraction, perhaps a large majority, of minihalos have not lost gas in their inner regions (that actually contribute to the mean free path of LyC photons) by , permitting the possibility that they contribute significantly to the mean free path of LyC photons, if necessary.
5.2 On of Galaxies at Epoch of Reionization
Using Eq 14, the four points (represented by the four symbols)
in Figure 8 give
,
in order to arrive
at the reionization solutions constrained by the state of the IGM at with
, respectively.
This required based on the observed state of the IGM at is consistent with computed based on state-of-the-art high resolution cosmological radiation hydrodynamic simulations of dwarf galaxies at the epoch of reionization of Kimm & Cen (2014). We point out that the upper value (14%) includes contributions from runaway OB stars. It is noteworthy that is effectively a measure of the porosity of the interstellar medium, where LyC photons escape through transparent holes into the IGM. Therefore, a correct treatment/implementation of supernova feedback is essential, as is in Kimm & Cen (2014) but not in any other simulations that the author is aware of. Including Wolf-Rayet stars for Pop II stellar population, which empirically are much more abundant in local metallicity environment that is expected for galaxies at the epoch of reionization, may further increase the ratio of LyC photons to FUV photons, i.e., , thus lessen the requirement for a high . Thus, it seems that the stellar emissivity observed is adequate for maintaining the state of the IGM in terms of global and local ionization balance. It should be noted that these changes have no effect on solutions of reionization history that we have obtained, which depends directly on .
5.3 Dichotomy in the Evolution of Lyman Alpha Emitters
In Figure 3 we see that solutions without Pop III contributions require for , respectively. In general, the solutions even with Pop III contributions requires as long as . We note that the overall tends to correlate with the porosity of the ISM, while individual is strongly dependent on the line of sight of the observer (e.g., Cen & Kimm, 2015). A positive is physically consistent with the expectation that smaller galaxies, having shallower gravitational potential wells, may be more susceptible to feedback processes from supernovae and have more porous ISM. Simulation results are consistent with this expected trend (e.g., Kimm & Cen, 2014).
Is there observational evidence that the escape of Ly and of LyC photons are both correlated with ISM posority? Jones et al. (2013) find an interesting trend of lower covering fractions of low-ionization gas for galaxies with strong Ly emission, providing evidence for a reduction in the average HI covering fraction (hence an increase in the escape fraction of ionizing radiation) is correlated with increase in Ly emission. Shapley et al. (2003) find that the blueshifts of interstellar absorption lines in LAEs and LBGs are similar at , suggesting that the velocity of outflows in LAEs and LBGs are comparable. But their study also reveals a trend that Ly EW increases with decreasing in the EW range of to Å. Furthermore, they confirm that of LAEs is systematically smaller than the values of LBGs, with of about for LAEs compared to about for LBGs. Moreover, they clarify that decreases with increasing EW of Ly. Recently, Shibuya et al. (2014) find an anti-correlation between Ly EW and the covering fraction estimated from the depth of absorption lines, which is an indicator of average neutral hydrogen column density. Their results support the idea that neutral column density is a key quantity determining Ly emissivity, consistent with the notion that the escape of LyC and Ly is correlated with each other and due to lower column density holes in the ISM. The combination of these facts leads one to conclude that the Ly velocity offset is positively correlated with and negatively correlated with EW, exactly predicted from results based on Ly radiative transfer calculations (e.g., Zheng et al., 2010). None of these properties concerning Ly emission can be attributed to differences in the outflow velocity, which do not appear to exist between LAEs and LBGs. Taken together, intrinsically, one would have expected then that the escape of Ly photons should be made easier with increasing redshift; i.e., both the ratio of Lyman alpha emitters to overall galaxy population at a chosen Ly EW or the overall Ly luminosity to FUV luminosity ratio as a whole are expected to increase with redshift beyond .
Such an expectation is not borne out with observations. At some EW cuts, observations have consistently found that the fraction of LAEs out of LBGs decreases by a significant factor from redshift to (e.g., Treu et al., 2013; Vanzella et al., 2014; Faisst et al., 2014; Schenker et al., 2014; Tilvi et al., 2014; Furusawa et al., 2016). This observational evidence strongly suggests that the intergalactic medium may have increasingly diminished the observability of the Ly from to , consistent with the rapid reionization picture depicted in Figure 6). Physically, this is due to the fact that significantly neutral IGM limits the size of Stromgren sphere around galaxies (Cen & Haiman, 2000). Caruana et al. (2014) conclude that the neutral fraction of the IGM at to be , which would be consistent with our computed model shown in Figure 6).
On the other hand, even if the IGM is indeed masking the appearance of the Ly emission for most, relatively low luminosity galaxies at the epoch of reionization, for rare, very luminous galaxies (which each are also likely clustered with other galaxies) with large Stromgren spheres, their Ly emission lines may be unaffected or possibly enhanced (given ), under suitable conditions. A corroborative or confirmative piece of evidence for this may be that, if a strong Ly line is detected, the emission region could, but not necessarily required to, be compact spatially and in velocity space due to lack of scattering. There are observational indications that this may in fact be the case. Sobral et al. (2015) observe a luminous Ly source (CR7) with luminosity of erg/s at (the most luminous Ly emitter ever found at ) but with a narrow FWHM of . Hu et al. (2016) detect a luminous Ly emitting galaxy, COLA1, with luminosity of erg/s at . COLA1 shows a multi-component Ly profile with a blue wing, suggesting a large and highly Stromgren sphere perhaps well extending into the infall region. Matthee et al. (2015) have argued that there is little evolution in the luminosity function of the most luminous LAEs at these redshifts, suggesting that these objects lie in large HII regions and protect themselves from changes in IGM neutral fraction, consistent with the expectation, at least in principle. More pinpointed analysis will be desirable in this respect, combining reionization simulations with detailed radiative transfer of Ly photons.
In summary, we expect that there is a dichotomy in the evolution of Ly emitting galaxies. For relatively low Ly luminosity galaxies, their emission lines will be progressively diminished with increasing redshift due to the increasingly neutral IGM beyond . On the other hand, for the most luminous Ly emitters, under suitable conditions, their Stromgren spheres are large enough to allow their Ly line to escape unscathed by the neutral IGM. Both are consistent with present tentative observational evidence.
6 Conclusions
We utilize the joint observations of the Ly forest, the mean free path of ionizing photons , the luminosity function of galaxies and the total electron scattering optical depth , and theoretical insight on a relation between matter power spectrum and , to perform a detailed analysis of the solutions of cosmic reionization history that satisfy the observed boundary conditions of the IGM at . We summarize results and conclusions.
(1) A theoretical relation between the mean free path and ionization rate at , requiring only the matter power spectrum, is derived. More scale power on scales leads to lower mean free path.
(2) A negative relation is found between the minimum effective ionizing photon emissivity for the IGM at and the electron scattering optical depth . A higher emissivity is coupled with a less steep increase of ionizing photon escape fraction with increasing redshift, resulting in a later reionization episode hence a lower .
(3) The minimum required mean escape fraction of ionizing photons from galaxies at is found to be for , respectively, where is the ratio of ionizing photo production rate (in ) to FUV spectral density (in ). The escape fraction is predicted to increase with increasing redshift, with the rate of increase required higher for higher .
(4) While there is a family of possible solution, the 50% ionization fraction redshift lies in a relatively narrow range of for . The late reionization suggests that relatively low luminosity Ly emitters beyond , incapable of carving out a sufficiently large Stromgren sphere, will be increasingly diminished, although the most luminous Ly emitters may possess a large enough Stromgren sphere to allow unimpeded transmission of their Ly lines, possibly characterized by compact spatial or velocity extent.
(5) Topologically, reasonable arguments lead to the picture that the universe transitions from a set of isolated HII bubbles of typical individual sizes probably no greater than pMpc at to a set of isolated neutral islands centered on halos that are embedded in one connected of HII region at .
(6) A positive relation is found between and the maximum mean free path of ionizing photons at . The outcome comes about because the product of the free path and emissivity of ionizing photons at is constrained by the observed Gunn-Peterson optical depth. The maximum mean free path at is in order to yield , respectively. We do not find it possible to find a reionization solution with that satisfies all observed conditions.
(7) The electron scattering optical depth thus provides a constraint on the mean free path, which in turn yields a new and powerful constraint on the matter power spectrum on scales at . With the latest Planck measurements of , we can place an upper limit of on the cutoff mass of the halo mass function, or equivalent a lower limit on warm dark matter particle mass or on sterile neutrino mass in the warm dark matter model, at confidence level.
(8) It is clear that a solution to the missing satellite problem (Klypin et al., 1999; Moore et al., 1999) is unattainable via the route of warm dark matter particle origin, because of the strong constraint on the upper bound on dwarf halo mass of at found.
I thank Xiaohui Fan, Jordi Miralda-Escude, Graca Rocha and Hy Trac for helpful discussion. I also thank an anonymous referee for useful and constructive comments. This work is supported in part by grants NNX12AF91G and AST15-15389.
References
- Abazajian (2006) Abazajian, K. 2006, Phys. Rev. D, 73, 063513
- Abazajian (2014) Abazajian, K. N. 2014, Physical Review Letters, 112, 161303
- Angel et al. (2016) Angel, P. W., Poole, G. B., Ludlow, A. D., Duffy, A. R., Geil, P. M., Mutch, S. J., Mesinger, A., & Wyithe, J. S. B. 2016, MNRAS, 459, 2106
- Barkana et al. (2001) Barkana, R., Haiman, Z., & Ostriker, J. P. 2001, ApJ, 558, 482
- Becker et al. (2007) Becker, G. D., Rauch, M., & Sargent, W. L. W. 2007, ApJ, 662, 72
- Bezrukov & Gorbunov (2014) Bezrukov, F. L., & Gorbunov, D. S. 2014, Physics Letters B, 736, 494
- Bouwens et al. (2015) Bouwens, R. J., Illingworth, G. D., Oesch, P. A., Trenti, M., Labbé, I., Bradley, L., Carollo, M., van Dokkum, P. G., Gonzalez, V., Holwerda, B., Franx, M., Spitler, L., Smit, R., & Magee, D. 2015, ApJ, 803, 34
- Boylan-Kolchin et al. (2011) Boylan-Kolchin, M., Bullock, J. S., & Kaplinghat, M. 2011, MNRAS, 415, L40
- Bromm et al. (2001) Bromm, V., Kudritzki, R. P., & Loeb, A. 2001, ApJ, 552, 464
- Bromm & Loeb (2003) Bromm, V., & Loeb, A. 2003, ApJ, 596, 34
- Bullock et al. (2001) Bullock, J. S., Kolatt, T. S., Sigad, Y., Somerville, R. S., Kravtsov, A. V., Klypin, A. A., Primack, J. R., & Dekel, A. 2001, MNRAS, 321, 559
- Caruana et al. (2014) Caruana, J., Bunker, A. J., Wilkins, S. M., Stanway, E. R., Lorenzoni, S., Jarvis, M. J., & Ebert, H. 2014, MNRAS, 443, 2831
- Cen & Haiman (2000) Cen, R., & Haiman, Z. 2000, ApJ, 542, L75
- Cen & Kimm (2015) Cen, R., & Kimm, T. 2015, ApJ, 801, L25
- Cen & McDonald (2002) Cen, R., & McDonald, P. 2002, ApJ, 570, 457
- Cen et al. (1994) Cen, R., Miralda-Escude, J., Ostriker, J. P., & Rauch, M. 1994, ApJ, 437, L9
- Colombi et al. (1996) Colombi, S., Dodelson, S., & Widrow, L. M. 1996, ApJ, 458, 1
- Dijkstra et al. (2007) Dijkstra, M., Wyithe, J. S. B., & Haiman, Z. 2007, MNRAS, 379, 253
- Dolag et al. (2004) Dolag, K., Bartelmann, M., Perrotta, F., Baccigalupi, C., Moscardini, L., Meneghetti, M., & Tormen, G. 2004, A&A, 416, 853
- Faisst et al. (2014) Faisst, A. L., Capak, P., Carollo, C. M., Scarlata, C., & Scoville, N. 2014, ApJ, 788, 87
- Fan et al. (2002) Fan, X., Narayanan, V. K., Strauss, M., White, R. L., Becker, R. H., Pentericci, L., & Rix, H.-W. 2002, AJ, 123, 1247
- Fan et al. (2006) Fan, X., Strauss, M. A., Becker, R. H., White, R. L., Gunn, J. E., Knapp, G. R., Richards, G. T., Schneider, D. P., Brinkmann, J., & Fukugita, M. 2006, AJ, 132, 117
- Fang & Cen (2004) Fang, T., & Cen, R. 2004, ApJ, 616, L87
- Finlator et al. (2012) Finlator, K., Oh, S. P., Özel, F., & Davé, R. 2012, MNRAS, 427, 2464
- Furusawa et al. (2016) Furusawa, H., Kashikawa, N., Kobayashi, M. A. R., Dunlop, J. S., Shimasaku, K., Takata, T., Sekiguchi, K., Naito, Y., Furusawa, J., Ouchi, M., Nakata, F., Yasuda, N., Okura, Y., Taniguchi, Y., Yamada, T., Kajisawa, M., Fynbo, J. P. U., & Le Fevre, O. 2016, ArXiv e-prints
- Gnedin & Ostriker (1997) Gnedin, N. Y., & Ostriker, J. P. 1997, ApJ, 486, 581
- Grazian et al. (2015) Grazian, A., Fontana, A., Santini, P., Dunlop, J. S., Ferguson, H. C., Castellano, M., Amorin, R., Ashby, M. L. N., Barro, G., Behroozi, P., Boutsia, K., Caputi, K. I., Chary, R. R., Dekel, A., Dickinson, M. E., Faber, S. M., Fazio, G. G., Finkelstein, S. L., Galametz, A., Giallongo, E., Giavalisco, M., Grogin, N. A., Guo, Y., Kocevski, D., Koekemoer, A. M., Koo, D. C., Lee, K.-S., Lu, Y., Merlin, E., Mobasher, B., Nonino, M., Papovich, C., Paris, D., Pentericci, L., Reddy, N., Renzini, A., Salmon, B., Salvato, M., Sommariva, V., Song, M., & Vanzella, E. 2015, A&A, 575, A96
- Greig et al. (2016) Greig, B., Mesinger, A., Haiman, Z., & Simcoe, R. A. 2016, ArXiv e-prints
- Gunn & Peterson (1965) Gunn, J. E., & Peterson, B. A. 1965, ApJ, 142, 1633
- Haiman & Cen (2005) Haiman, Z., & Cen, R. 2005, ApJ, 623, 627
- Hinshaw et al. (2013) Hinshaw, G., Larson, D., Komatsu, E., Spergel, D. N., Bennett, C. L., Dunkley, J., Nolta, M. R., Halpern, M., Hill, R. S., Odegard, N., Page, L., Smith, K. M., Weiland, J. L., Gold, B., Jarosik, N., Kogut, A., Limon, M., Meyer, S. S., Tucker, G. S., Wollack, E., & Wright, E. L. 2013, ApJS, 208, 19
- Hu et al. (2016) Hu, E. M., Cowie, L. L., Songaila, A., Barger, A. J., Rosenwasser, B., & Wold, I. 2016, ArXiv e-prints
- Iliev et al. (2006) Iliev, I. T., Mellema, G., Pen, U.-L., Merz, H., Shapiro, P. R., & Alvarez, M. A. 2006, MNRAS, 369, 1625
- Iliev et al. (2005) Iliev, I. T., Shapiro, P. R., & Raga, A. C. 2005, MNRAS, 361, 405
- Jones et al. (2013) Jones, T. A., Ellis, R. S., Schenker, M. A., & Stark, D. P. 2013, ApJ, 779, 52
- Kimm & Cen (2014) Kimm, T., & Cen, R. 2014, ApJ, 788, 121
- Klypin et al. (1999) Klypin, A., Kravtsov, A. V., Valenzuela, O., & Prada, F. 1999, ApJ, 522, 82
- Komatsu & Seljak (2001) Komatsu, E., & Seljak, U. 2001, MNRAS, 327, 1353
- Madau et al. (1999) Madau, P., Haardt, F., & Rees, M. J. 1999, ApJ, 514, 648
- Matthee et al. (2015) Matthee, J., Sobral, D., Santos, S., Röttgering, H., Darvish, B., & Mobasher, B. 2015, MNRAS, 451, 400
- McQuinn et al. (2009) McQuinn, M., Lidz, A., Zaldarriaga, M., Hernquist, L., Hopkins, P. F., Dutta, S., & Faucher-Giguère, C. 2009, ApJ, 694, 842
- Mesinger et al. (2004) Mesinger, A., Haiman, Z., & Cen, R. 2004, ApJ, 613, 23
- Miralda-Escudé et al. (2000) Miralda-Escudé, J., Haehnelt, M., & Rees, M. J. 2000, ApJ, 530, 1
- Moore et al. (1999) Moore, B., Ghigna, S., Governato, F., Lake, G., Quinn, T., Stadel, J., & Tozzi, P. 1999, ApJ, 524, L19
- Narayanan et al. (2000) Narayanan, V. K., Spergel, D. N., Davé, R., & Ma, C. 2000, ApJ, 543, L103
- Navarro et al. (1997) Navarro, J. F., Frenk, C. S., & White, S. D. M. 1997, ApJ, 490, 493
- Noterdaeme et al. (2009) Noterdaeme, P., Petitjean, P., Ledoux, C., & Srianand, R. 2009, A&A, 505, 1087
- O’Meara et al. (2013) O’Meara, J. M., Prochaska, J. X., Worseck, G., Chen, H.-W., & Madau, P. 2013, ApJ, 765, 137
- Osterbrock (1989) Osterbrock, D. E. 1989, Astrophysics of gaseous nebulae and active galactic nuclei
- Ouchi et al. (2010) Ouchi, M., Shimasaku, K., Furusawa, H., Saito, T., Yoshida, M., Akiyama, M., Ono, Y., Yamada, T., Ota, K., Kashikawa, N., Iye, M., Kodama, T., Okamura, S., Simpson, C., & Yoshida, M. 2010, ApJ, 723, 869
- Park et al. (2014) Park, J.-C., Kong, K., & Park, S. C. 2014, Physics Letters B, 733, 217
- Pawlik et al. (2009) Pawlik, A. H., Schaye, J., & van Scherpenzeel, E. 2009, MNRAS, 394, 1812
- Planck Collaboration et al. (2015) Planck Collaboration, Ade, P. A. R., Aghanim, N., Arnaud, M., Ashdown, M., Aumont, J., Baccigalupi, C., Banday, A. J., Barreiro, R. B., Bartlett, J. G., & et al. 2015, ArXiv e-prints
- Planck Collaboration et al. (2016) Planck Collaboration, Aghanim, N., Ashdown, M., Aumont, J., Baccigalupi, C., Ballardini, M., Banday, A. J., Barreiro, R. B., Bartolo, N., Basak, S., Battye, R., Benabed, K., Bernard, J.-P., Bersanelli, M., Bielewicz, P., Bock, J. J., Bonaldi, A., Bonavera, L., Bond, J. R., Borrill, J., Bouchet, F. R., Boulanger, F., Bucher, M., Burigana, C., Butler, R. C., Calabrese, E., Cardoso, J.-F., Carron, J., Challinor, A., Chiang, H. C., Colombo, L. P. L., Combet, C., Comis, B., Coulais, A., Crill, B. P., Curto, A., Cuttaia, F., Davis, R. J., de Bernardis, P., de Rosa, A., de Zotti, G., Delabrouille, J., Delouis, J.-M., Di Valentino, E., Dickinson, C., Diego, J. M., Doré, O., Douspis, M., Ducout, A., Dupac, X., Efstathiou, G., Elsner, F., Enßlin, T. A., Eriksen, H. K., Falgarone, E., Fantaye, Y., Finelli, F., Forastieri, F., Frailis, M., Fraisse, A. A., Franceschi, E., Frolov, A., Galeotta, S., Galli, S., Ganga, K., Génova-Santos, R. T., Gerbino, M., Ghosh, T., González-Nuevo, J., Górski, K. M., Gratton, S., Gruppuso, A., Gudmundsson, J. E., Hansen, F. K., Helou, G., Henrot-Versillé, S., Herranz, D., Hivon, E., Huang, Z., Ilic, S., Jaffe, A. H., Jones, W. C., Keihänen, E., Keskitalo, R., Kisner, T. S., Knox, L., Krachmalnicoff, N., Kunz, M., Kurki-Suonio, H., Lagache, G., Lamarre, J.-M., Langer, M., Lasenby, A., Lattanzi, M., Lawrence, C. R., Le Jeune, M., Leahy, J. P., Levrier, F., Liguori, M., Lilje, P. B., López-Caniego, M., Ma, Y.-Z., Macías-Pérez, J. F., Maggio, G., Mangilli, A., Maris, M., Martin, P. G., Martínez-González, E., Matarrese, S., Mauri, N., McEwen, J. D., Meinhold, P. R., Melchiorri, A., Mennella, A., Migliaccio, M., Miville-Deschênes, M.-A., Molinari, D., Moneti, A., Montier, L., Morgante, G., Moss, A., Mottet, S., Naselsky, P., Natoli, P., Oxborrow, C. A., Pagano, L., Paoletti, D., Partridge, B., Patanchon, G., Patrizii, L., Perdereau, O., Perotto, L., Pettorino, V., Piacentini, F., Plaszczynski, S., Polastri, L., Polenta, G., Puget, J.-L., Rachen, J. P., Racine, B., Reinecke, M., Remazeilles, M., Renzi, A., Rocha, G., Rossetti, M., Roudier, G., Rubiño-Martín, J. A., Ruiz-Granados, B., Salvati, L., Sandri, M., Savelainen, M., Scott, D., Sirri, G., Sunyaev, R., Suur-Uski, A.-S., Tauber, J. A., Tenti, M., Toffolatti, L., Tomasi, M., Tristram, M., Trombetti, T., Valiviita, J., Van Tent, F., Vibert, L., Vielva, P., Villa, F., Vittorio, N., Wandelt, B. D., Watson, R., Wehus, I. K., White, M., Zacchei, A., & Zonca, A. 2016, ArXiv e-prints
- Prochaska et al. (2009) Prochaska, J. X., Worseck, G., & O’Meara, J. M. 2009, ApJ, 705, L113
- Read et al. (2006) Read, J. I., Wilkinson, M. I., Evans, N. W., Gilmore, G., & Kleyna, J. T. 2006, MNRAS, 367, 387
- Ribaudo et al. (2011) Ribaudo, J., Lehner, N., & Howk, J. C. 2011, ApJ, 736, 42
- Ricotti et al. (2007) Ricotti, M., Pontzen, A., & Viel, M. 2007, ApJ, 663, L53
- Robertson et al. (2013) Robertson, B. E., Furlanetto, S. R., Schneider, E., Charlot, S., Ellis, R. S., Stark, D. P., McLure, R. J., Dunlop, J. S., Koekemoer, A., Schenker, M. A., Ouchi, M., Ono, Y., Curtis-Lake, E., Rogers, A. B., Bowler, R. A. A., & Cirasuolo, M. 2013, ApJ, 768, 71
- Schenker et al. (2014) Schenker, M. A., Ellis, R. S., Konidaris, N. P., & Stark, D. P. 2014, ApJ, 795, 20
- Schneider & Omukai (2010) Schneider, R., & Omukai, K. 2010, MNRAS, 402, 429
- Shapley et al. (2003) Shapley, A. E., Steidel, C. C., Pettini, M., & Adelberger, K. L. 2003, ApJ, 588, 65
- Shibuya et al. (2014) Shibuya, T., Ouchi, M., Nakajima, K., Hashimoto, T., Ono, Y., Rauch, M., Gauthier, J.-R., Shimasaku, K., Goto, R., Mori, M., & Umemura., M. 2014, ApJ, 788, 74
- Shull et al. (2012) Shull, J. M., Harness, A., Trenti, M., & Smith, B. D. 2012, ApJ, 747, 100
- Sobral et al. (2015) Sobral, D., Matthee, J., Darvish, B., Schaerer, D., Mobasher, B., Röttgering, H. J. A., Santos, S., & Hemmati, S. 2015, ApJ, 808, 139
- Sokasian et al. (2003) Sokasian, A., Abel, T., Hernquist, L., & Springel, V. 2003, MNRAS, 344, 607
- Songaila & Cowie (2010) Songaila, A., & Cowie, L. L. 2010, ArXiv e-prints
- Stengler-Larrea et al. (1995) Stengler-Larrea, E. A., Boksenberg, A., Steidel, C. C., Sargent, W. L. W., Bahcall, J. N., Bergeron, J., Hartig, G. F., Jannuzi, B. T., Kirhakos, S., Savage, B. D., Schneider, D. P., Turnshek, D. A., & Weymann, R. J. 1995, ApJ, 444, 64
- Storrie-Lombardi et al. (1994) Storrie-Lombardi, L. J., McMahon, R. G., Irwin, M. J., & Hazard, C. 1994, ApJ, 427, L13
- Tilvi et al. (2014) Tilvi, V., Papovich, C., Finkelstein, S. L., Long, J., Song, M., Dickinson, M., Ferguson, H. C., Koekemoer, A. M., Giavalisco, M., & Mobasher, B. 2014, ApJ, 794, 5
- Trac et al. (2015) Trac, H., Cen, R., & Mansfield, P. 2015, ApJ, 813, 54
- Treu et al. (2013) Treu, T., Schmidt, K. B., Trenti, M., Bradley, L. D., & Stiavelli, M. 2013, ApJ, 775, L29
- Tumlinson et al. (2001) Tumlinson, J., Giroux, M. L., & Shull, J. M. 2001, ApJ, 550, L1
- Vanzella et al. (2014) Vanzella, E., Fontana, A., Pentericci, L., Castellano, M., Grazian, A., Giavalisco, M., Nonino, M., Cristiani, S., Zamorani, G., & Vignali, C. 2014, A&A, 569, A78
- Viel et al. (2013) Viel, M., Becker, G. D., Bolton, J. S., & Haehnelt, M. G. 2013, Phys. Rev. D, 88, 043502
- Viel et al. (2005) Viel, M., Lesgourgues, J., Haehnelt, M. G., Matarrese, S., & Riotto, A. 2005, Phys. Rev. D, 71, 063534
- Wechsler et al. (2002) Wechsler, R. H., Bullock, J. S., Primack, J. R., Kravtsov, A. V., & Dekel, A. 2002, ApJ, 568, 52
- Wilkins et al. (2008) Wilkins, S. M., Trentham, N., & Hopkins, A. M. 2008, MNRAS, 385, 687
- Worseck et al. (2011) Worseck, G., Prochaska, J. X., McQuinn, M., Dall’Aglio, A., Fechner, C., Hennawi, J. F., Reimers, D., Richter, P., & Wisotzki, L. 2011, ApJ, 733, L24+
- Worseck et al. (2014) Worseck, G., Prochaska, J. X., O’Meara, J. M., Becker, G. D., Ellison, S. L., Lopez, S., Meiksin, A., Ménard, B., Murphy, M. T., & Fumagalli, M. 2014, MNRAS, 445, 1745
- Zheng et al. (2010) Zheng, Z., Cen, R., Trac, H., & Miralda-Escudé, J. 2010, ApJ, 716, 574