Doppler tomography of the Double Periodic Variable HD 170582 at low and high stage
Abstract
HD 170582 is an interacting binary of the Double Periodic Variable (DPV) type, showing ellipsoidal variability with a period of 16.87 days along with a long photometric cycle of 587 days. It was recently studied by Mennickent et al. (2015), who found a slightly evolved B-type star surrounded by a luminous accretion disc fed by a Roche-lobe overflowing A-type giant. Here we extend their analysis presenting new spectroscopic data and studying the Balmer emission lines. We find orbitally modulated double-peak H and H emissions whose strength also vary in the long-term. In addition, Doppler maps of the emission lines reveal sites of enhanced line emission in the 1st and 4th velocity quadrants, the first one consistent with the position of one of the bright zones detected by the light curve analysis. We find a difference between Doppler maps at high and low stage of the long cycle; evidence that the emission is optically thicker at high state in the stream-disc impact region, possibly reflecting a larger mass transfer rate. We compare the system parameters with a grid of synthetic binary evolutionary tracks and find the best fitting model. The system is found to be semi-detached, in a conservative Case-B mass transfer stage, with age 7.68 107 yr and mass transfer rate 1.6 10-6 . For 5 well-studied DPVs, the disc luminosity scales with the primary mass and is much larger than the theoretical accretion luminosity.
keywords:
stars: early-type - stars: evolution - stars: mass-loss - stars: emission-line - stars: variables-others1 Introduction
The interacting binary HD 170582 (BD-14 5085, ASAS ID 183048-1447.5, = 18:30:47.5, = -14:47:27.8, = 9.66 mag, = 0.41 mag, spectral type A9V)111http://simbad.u-strasbg.fr/simbad/ is a member of the class of Double Periodic Variables, Algol-related binaries showing a long photometric cycle lasting about 33 times the orbital period with a period ratio mostly between 25 and 45 (Mennickent et al. 2003, Mennickent et al. 2008, Poleski et al. 2010, Mennickent et al. 2012a, 2012b, Mennickent 2013, Garrido et al. 2013, Barría et al. 2013, 2014, Pawlak et al. 2013). Recently, Mennickent et al. (2016) showed that DPVs are those semi-detached Algols with B-type primaries of radius slightly larger than the critical radius222The critical radius just allows the stream coming from the secondary to hit the primary. A smaller primary radius is traditionally assumed for the existence of an accretion disc. and also that they host stable accretion discs (Mennickent, Otero, & Kołaczkowski, 2016).
In a recent study Mennickent et al. (2015, hereafter M15) disentangled the light curve of HD 170582 into an orbital part, determining a period of 16.87 days and revealing orbital ellipsoidal variability with unequal maxima, and a long cycle of 587 days, showing quasi-sinusoidal changes with amplitude = 0.1 mag. They modeled the orbital light curve with a cool evolved star of = 1.9 0.1 , = 8000 100 and = 15.6 0.2 , and an early B-type dwarf of = 9.0 0.2 surrounded by a geometrically and optically thick accretion disc of radial extension 20.8 0.3 , contributing about 35% to the system luminosity in the -band. M15 fit the light curve asymmetries with two extended regions located at opposite sides of the disc rim, and hotter than the disc by 67% and 46%. One of these regions can be associated to the impact with, and penetration of the gas stream into the accretion disc.
The origin of the long cycle in DPVs still is not understood, but it could be related to episodic mass loss from the system driven possibly by a bipolar wind (Mennickent et al. 2008, 2012b). This result shows the importance of imaging the circumstellar material with the aid of tomographic reconstructions, which are still scarce for the class of DPVs (Atwood-Stone et al. 2012, Richards et al. 2014, Mennickent et al. 2012b).
In this paper we complement the work by M15, studying the long-term variability of the Balmer emission. We also get insights on the line emissivity distribution at high and low stage with the aid of the technique of Doppler tomography. We also investigate for the first time the evolutionary stage of this binary determining its age and mass transfer rate and provide insights on the luminosity of the discs surrounding the primaries of DPVs. We divide the paper as follows: in Section 2 we present the spectroscopic data used in this paper, in Section 3 we give insights on emission line profile variability. In the same section we build Doppler tomograms for the H and H emission lines, discuss the system evolutionary stage, obtain a value for the mass transfer rate, and present a study of the luminosity of the DPV accretion discs. We give a discussion in Section 4 and our conclusions are presented in Section 5.
2 Spectroscopic data
Most of the observing material considered in this paper was described by M15, it consists of 136 echelle optical spectra obtained between years 2008 and 2013 with resolving power 40,000, at the observatories Las Campanas with the echelle spectrograph (DuPont telescope), Cerro Tololo with the CHIRON spectrograph (1.5m telescope) and La Silla with the CORALIE spectrograph (EULER telescope). In addition to the aforementioned observing material, new spectra are studied in this paper.
The new spectroscopic data were obtained using the Echelle Spectrograph (Levine & Chakarabarty, 1995) attached to the 2.12 m telescope of the Observatorio Astronómico Nacional at San Pedro Mártir (OAN SPM), Mexico. This spectrograph provides spectra spread over 27 orders, covering the spectral range of 3500-7105 Å with a spectral resolution power of = 18000. A ThAr lamp was used for wavelength calibration. The spectra were reduced by a standard way using the echelle package in IRAF333IRAF is distributed by the National Optical Astronomy Observatories, which are operated by the Association of Universities for Research in Astronomy, Inc., under cooperative agreement with the National Science Foundation., including flat and bias correction, wavelength calibration and order merging. All spectra discussed in this paper are normalized to the continuum and the RVs are heliocentric ones. We use the orbital and long-cycle ephemerides for the binary provided by M15. The log of observation and characteristics of the new spectra are given in Table 1.
| UT-date | UT-middle | S/N | HJD | ||
|---|---|---|---|---|---|
| 2014-09-19 | 04:17:24 | 60 | 2456919.67296 | 0.8353 | 0.2603 |
| 2014-09-19 | 04:37:36 | 68 | 2456919.68698 | 0.8361 | 0.2603 |
| 2014-09-19 | 04:57:48 | 62 | 2456919.70101 | 0.8369 | 0.2603 |
| 2014-11-02 | 02:02:16 | 79 | 2456963.57498 | 0.4373 | 0.3351 |
| 2014-11-02 | 02:22:33 | 82 | 2456963.58906 | 0.4381 | 0.3351 |
| 2014-11-02 | 02:49:57 | 92 | 2456964.60801 | 0.4985 | 0.3368 |
3 Results
3.1 Spectroscopy
3.1.1 Spectral disentangling and donor-subtracted spectra
The following light sources are present in HD 170582: the donor, the gainer, the disc and possibly the gas stream. In order to remove the donor from the spectra we assume that its contribution to the total light adds to the other sources and it is characterized by a synthetic spectrum with = 8000 , log = 1.7, projected rotational velocity 44 km s-1 and microturbulent velocity 1 km s-1. This spectrum was selected by M15 from a grid of spectra calculated using the SYNTHE code plus atmospheric models computed with the line-blanketed local thermodynamic equilibrium ATLAS9 code (Kurucz 1993).
The donor-subtracted spectra were constructed removing the donor synthetic spectrum from the observed spectra. Firstly, the synthetic spectrum was Doppler corrected and scaled according to the contribution of the secondary star at a given orbital phase and at the given wavelength range. For normalized fluxes at given orbital and long-cycle phases ( and , respectively):
| (1) |
where is the donor-subtracted flux, the observed flux, fd the synthetic spectrum of the donor, is its fractional contribution according to our model and the representative wavelength where this factor is calculated. Theoretical -factors were computed from the M15 model; they correctly account for the variable projected area of the donor and its larger flux contribution at longer wavelengths (Fig. 1). This method effectively removed the main contribution of the donor from the observed spectra. The result was a set of disentangled spectra that were normalized to the new continuum.


Disentangling of the gainer and the disc was not intended since there is no model for the disc absorption lines, and there is evidence that its spectrum combine in a complex way with the stellar spectrum of the primary (M15). We find in the residual spectra H and H double emission lines and a central absorption moving across the emission regularly during the whole cycle (Fig. 2).
3.1.2 Long-term spectroscopy
The long-term behavior of the Balmer emission, as measured by the equivalent width, is shown in Fig. 3. While H practically does not show large long-term variability (except for two spectra taken in 2014), H emission is stronger during 2012-2013 (CHIRON observations) and weaker during 2014 (SPM data) and 2008-2009 (CORALIE & DuPont observations).
The investigation of the long-cycle variability is limited by timings of our dataset, which are scarce during the first half of the long cycle; although most SPM/Du-Pont/CORALIE data are found in this range they consist of very few epochs. In general, the H emission is lower during the first half of the long-cycle, but H does not show the same pattern (Fig. 4).
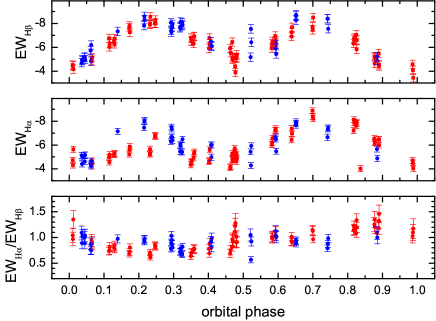
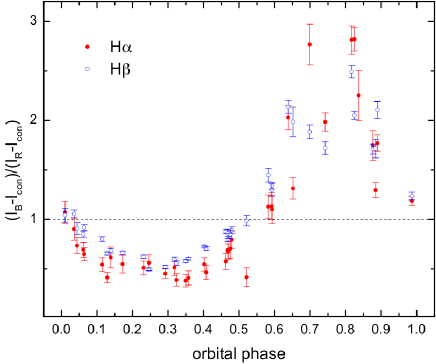
For CHIRON data the Balmer emission shows a double-wave modulation during the orbital cycle, closely following the light curve described by M15; it is maximum at quadratures, i.e. when continuum emission is maximum (Fig. 5). The ratio between the equivalent widths of H and H describes a modulation with the orbital cycle with a maximum around = 0.9. Interestingly, there is no evidence for changes in the emission line strength with the long-cycle during the interval covered by CHIRON data (roughly 1.0).
3.2 Emission line orbital variability
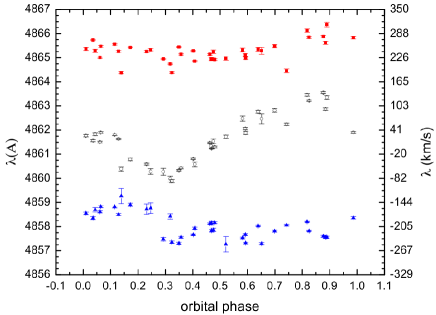
We measured the position of the blue and red peak, the central absorption (CA) and the intensities of the H and H lines. This was made by directly measuring the CA positions with the cursor and fitting each peak with a gaussian using the IRAF "splot" task. The method of deblending the whole profile with a double-gaussian function produced spurious results, specially for the CA, and was not considered. The measurements show that the central absorption moves quasi-sinusoidally in both lines with total amplitude about 180 km s-1 in H and 210 km s-1 in H. The peaks follow a more complex pattern (Fig. 6). The CA reaches maximum receding velocity around = 0.85 and maximum approaching velocity around = 0.30. The H peak separation is 390 60 (std) km s-1 and for H is 330 30 km s-1. For H the full width at zero intensity is 2555 260 km s-1 and for H is 2660 370 km s-1. The peaks intensity varies in anti phase during the cycle (Fig. 7) and the central absorption scatters around a level about 20% below the continuum. The red peak is larger around = 0.25 and minimum around = 0.80, while the opposite happens for the blue peak (Fig. 7).
3.3 Doppler tomography
We use the Doppler tomography technique to probe the structure of the accretion disc and circumstellar material in HD 170582. Recently, this method has been successfully applied to Algols revealing their importance to obtain images of gravitational and magnetic phenomena in these interacting binaries (Richards et al., 2014). The general description of the method can be found in the original paper of Marsh & Horne (1988). Briefly, The Doppler tomography technique uses the information encoded in spectral line profiles taken at different orbital phases to calculate a distribution of emission over the binary. Doppler tomography provides a quantitative mapping of optically thin line forming regions in velocity space.
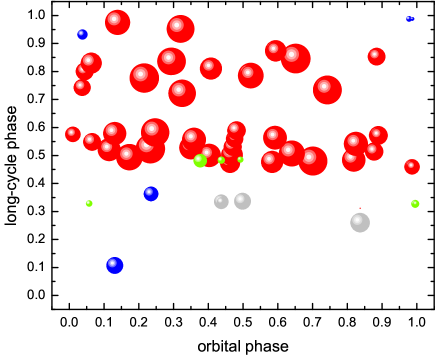
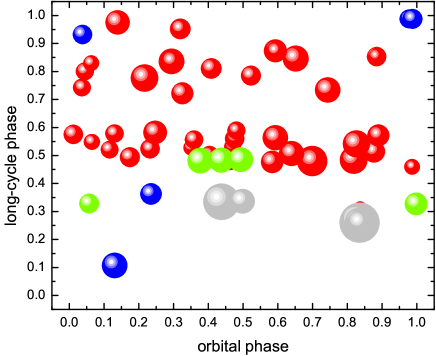
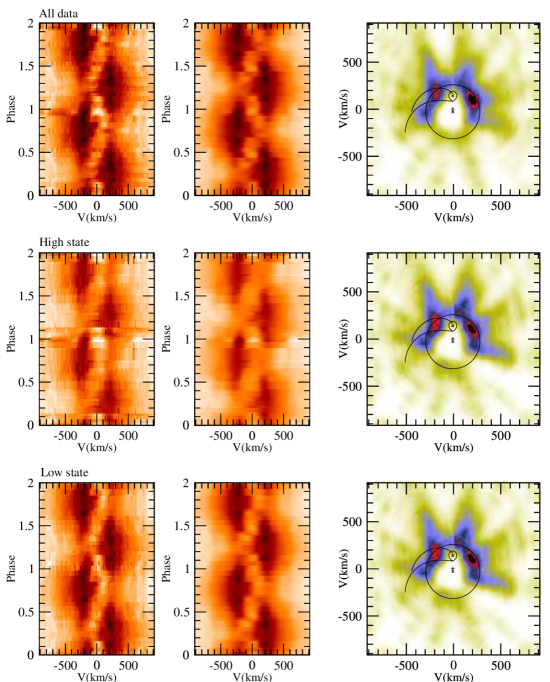
The Doppler maps for H and H emission lines were constructed using the maximum entropy method (Lucy, 1994) as implemented by Spruit (1998)444The code and its description are available at http://www.mpa-garching.mpg.de/henk/pub/dopmap/. Our time-resolved spectral observations allowed us to cover practically uniformly all orbital phases of the system within an average of spectra per 0.05 phase step of the orbital period (see Fig. 4). The system parameters of = 9.0 M⊙, mass ratio = 0.21, inclination angle 674 and orbital period 1687 from M15 are used to plot the positions of the stellar components, the mass transfer stream and its Keplerian velocity and the outer edge of the accretion disc. We also separately considered spectra taken at the high stage (0.7 1.2) and the low stage (0.2 0.7)555The high state of the system corresponds to the system brightest increasing along of the long period, the low state is the opposite case, see Fig. 1 from M15. In practice, due to data sampling, most spectra are in the ranges 0.7 1.0 and 0.4 0.6 but with a very good coverage of the orbital cycle (see Fig. 4). The resulting Doppler maps are presented in Figs. 8 and 9.
We find that the Balmer line emission is not formed in a disc, but in a horseshoe structure located in the upper velocity hemisphere. In addition, bright structures are detected in the first (upper left) quadrant and also in an elongated region in the fourth (upper right) quadrant. Practically no emission is found at the second and third quadrants. Two bright regions are found at angular distances 320°and 10° 35 °respectively, measured from the line joining the stellar centers as measured in direction opposite to the orbital motion. The first one can be associated with the bright spot detected in the LC analysis by M15 at 334°, but the second large bright region is different from the bright spot detected in the continuum light at 135°(M15). The emissivity (compared to the local continuum) is larger in H than in H and follows a similar horseshoe pattern. On the other hand, the emission ratio H/H is not axisymmetrical, which reveals spatially variable physical conditions in the circumstellar material.
Particle-dynamic simulations performed for close binary systems allow us to interpret the bright zones detected in the Doppler maps. Bisikalo et al. (1998) found that the gas stream penetrates the disc forming a hotline that could be related to the bright region detected in the 1st quadrant. In addition, Fujiwara et al. (2001) shows a shock region in the 4th quadrant produced by the impact of disc material onto this hotline.
There is practically no differences among the H Doppler maps obtained at high and low stage and almost the same happens for H, except in the 1st quadrant, where emission is notably lower during high state. This change in the ratio of H to H emission occurs in the stream-disc impact region, and might indicate a change in the physical characteristics of the material, from an optically thin (at the low stage) to an optically thick (at high stage) condition.666The Balmer emission decrement is usually taken as an indicator of optical thickness in gas excited by photoionization and electronic recombination.
Since the present analysis is based on irregularly sampled spectra obtained over a relatively long time-span, some possible intrinsic variability might not be resolved by the Doppler maps, being masked during the process of phase-binning the spectra. The current volume of the data does not allows us to study this possible variability with Doppler tomography.
| quantity | value | quantity | value |
|---|---|---|---|
| 1.9 0.1 M⊙ | 9.0 0.2 M⊙ | ||
| 8000 100 | 18000 1500 | ||
| log | 3.903 0.005 | log | 4.255 0.037 |
| 863 80 L⊙ | 2858 529 L⊙ | ||
| log | 2.936 0.040 | log | 3.456 0.080 |
| 15.6 0.2 R⊙ | 5.5 0.2 R⊙ |
| quantity | best model | quantity | best model |
|---|---|---|---|
| age | 7.6778(5)E7 yr | period | 16.89 0.17 d |
| 1.922 0.007 M⊙ | 9.474 0.008 M⊙ | ||
| -1.6(2)E-6 M⊙ yr-1 | 1.6(2)E-6 M⊙ yr-1 | ||
| 6918 16 | 23120 0 | ||
| log | 3.840 0.001 | log | 4.364 0.000 |
| 507 12 L⊙ | 7656 L⊙ | ||
| log | 2.705 0.010 | log | 3.8840 0.0005 |
| 15.65 0.08 R⊙ | 5.452 0.002 R⊙ | ||
| 0.000 0.000 | 0.494 0.000 | ||
| 0.980 0.000 | 0.486 0.000 |

3.4 Evolutionary stage, age and mass transfer rate
In this Section we compare the system parameters with those predicted by binary evolution models including epochs of non-conservative evolution following the method described by Mennickent (2014). The stellar and system parameters given by M15 were chosen as representative for the system, and are given in Table 2; in this paper we use subscript h and c for the hot and cool star, respectively. In our study the orbital period of 16.8722(17) days is also taken from M15. We discuss the effect of the uncertainties associated to the system parameters in our methodology.
We inspected the 561 evolutionary tracks by Van Rensbergen et al. (2008), available at the Center de Données Stellaires (CDS), searching for the best match for the system parameters. Models with strong and weak tidal interaction were studied, along with conservative and non-conservative models. Following Mennickent et al. (2012a), a multi-parametric fit was made with the synthetic () and observed () parameters stellar mass, temperature, luminosity and radii, and the system orbital period, where (from 1 to 561) indicates the synthetic model, the time and (from 1 to 9) the stellar or orbital parameter. Non-adjusted parameters were mass loss rate, Roche lobe radii, chemical composition, age and fraction of accreted mass lost by the system. For every synthetic model we calculated the quantity at every defined by
| (2) |
where is the number of observations (9) and the statistical weight of the parameter , calculated as
| (3) |
where is the error associated to the observable . The model with the minimum corresponds to the model with the best evolutionary history of HD 170582. The absolute minimum gives the age of the system along with the theoretical stellar and orbital parameters. The high accuracy of the orbital period dominates the search for the best solution in a single evolutionary track, but the others parameters play a role when comparing tracks corresponding to different initial stellar masses and orbital periods.
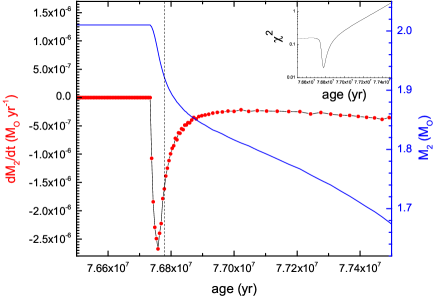
We find the best model for the system with a minimum at 0.020. Parameters for this solution are given in Table 3. The absolute minimum corresponds to the conservative model with initial masses of 6 M⊙ and 5.4 M⊙ and initial orbital period of 3.0 days. The best model gives a temperature of 23 kK and a mass of 9.47 M⊙ for the B star, which turns out to be slightly evolved with a core consisting of hydrogen and helium in almost equal fractions. The best fit also indicates that HD 170582 is found inside a burst of mass transfer, the second one in the lifetime of this binary (Fig. 11). The donor is an inflated ( = 15.6 R⊙) and evolved 1.92 M⊙ star with its core completely exhausted of hydrogen. According to the best model the system has now an age of 7.68 107 yr, a mass transfer rate = -1.6 10-6 M⊙ yr-1 and a mass ratio = 0.20. The orbital period rate of change, according to the best model, is about 2.9 seconds per year, impossible to detect with the accuracy of the derived photometric period (146.9 seconds, M15).
Deviations of the best fit parameters from those obtained from the LC model are = 0.47 M⊙, = 0.02 M⊙, = -0.05 R⊙, = 0.05 R⊙, = 5120 K and = 1082 K, i.e. up to 1% for the radii, 5% for the masses and 20% for the temperatures.
Although formal errors can be obtained for the derived parameters, especially age and , from the above described methodology, we notice that the limited grid of models and ad-hoc assumption of mass loss in the non-conservative cases are intrinsic limitations. To illustrate possible uncertainties we notice that among the 10 better models, i.e. those with lower (between 0.020 to 0.029), the range in age is 7.3 107 yr to 7.7 107 yr and in is -2.2 10-5 M⊙ yr-1 to -1.1 10-6 M⊙ yr-1.
3.5 On the luminosity of DPV discs
It is possible that discs of DPVs are different from classical accretion discs since the primary star, accelerated by the tangential impact of the gas stream (Mennickent, Otero, & Kołaczkowski, 2016), might be rotating at the critical velocity, impeding further accretion. In addition, DPV discs are smaller than the tidal radius (Mennickent, Otero, & Kołaczkowski, 2016), something that could indicate young discs or efficient mass loss from the system. In any case, few studies have been performed of these discs and in this Section we explore their properties, especially concerning their luminosity.
The luminosity of an accretion disc is given by:
| (4) |
where , and are the primary, inner-disc and outer-disc radius, respectively, and the gravitational constant (Frank, King, & Raine, 2002). For the parameters of HD 170582 ( = and = 3.8 from M15) we obtain = 19.6 .
The disc luminosity can also be calculated using the M15 light-curve model based on the Nelder-Mead simplex algorithm (see e.g. Press et al. 1992) with optimizations described by Dennis and Torczon (1991), and the model of a binary system with a disc. For more detail see e.g. Djurašević (1992). We call this figure the observed disc luminosity; it can be determined with typical accuracy less than 10%. For HD 170582 we obtain 1564 , much higher than the accretion luminosity calculated with Eq. 4.
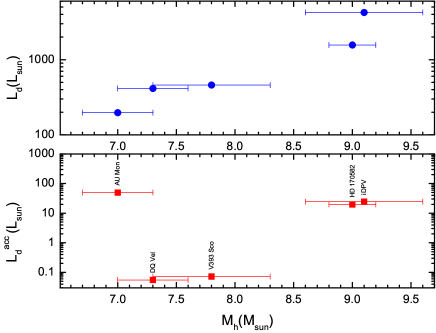
The above result moved us to compare the accretion luminosity of all well-studied DPVs with their disc luminosities, the last ones inferred from the light curve models that we have found in recent years. These data are shown in Table 4 and illustrated in Fig. 11. We find that for the 5 studied DPVs the observed disc luminosity is between 14 and 54% of the primary luminosity, and always much larger than the accretion luminosity. In addition, the observed disc luminosity scales with the primary mass whereas the accretion luminosity does not.
We conclude that the discs for the 5 well-studied DPVs are not accretion powered. We notice that this result rests on the value for , that was determined through comparison of the observed system parameters with grids of synthetic evolutionary paths. We also notice that for having similar accretion and disc luminosities the mass transfer rate would increase by several orders of magnitude, reaching unrealistic values which should produce large but undetected orbital period changes (Table 4, e.g. Eggleton 2011). For the above reason, we are confident of the difference between observed and accretion disc luminosity, and consequently, one should not use the accretion disc theory to derive mass transfer rates for these systems.
4 Discussion
Doppler tomograms for DPVs have been previously published for AU Mon (Atwood-Stone et al. 2012, Richards et al. 2014), and V 393 Sco (Mennickent et al. 2012a, 2012b). For AU Mon the disc is clearly visible in the Doppler tomograms in all quadrants; Atwood-Stone et al. (2012) identify “an asymmetric component of an elliptical accretion disk, and material moving at sub-Keplerian velocities that provides excess H emission, plausibly associated with the continuation of the mass transfer stream beyond the splash site” and this result is confirmed by Richards et al. (2014). The H Doppler map of V 393 Sco (at high state) reveals a ring-like emissivity distribution with enhanced emission in the 1st and 4th quadrants.
The case of the DPV HD 170582 is considered in this paper; for the first time Doppler maps of a DPV are separately shown for the high and low stage. The maps reveal a horseshoe pattern with increased emission at the 1st and 4th quadrants. While emissivity at the 1st quadrant can be associated to the region of penetration of the stream into the disc, emission at the 4th quadrant can be interpreted as a shock generated by the disc material encountering the stream after encircling the primary, as hydrodynamical simulations predict (Fujiwara et al., 2001). The position of the first structure coincides with one of the bright spots found after the light curve analysis (M15).
As mentioned above very few DPVs have Doppler tomographic reconstruction, therefore we still cannot extract significant conclusions of line emissivity distributions for DPVs as a class. However, the three cases discussed so far show the variety of patterns that can be found, from whole emitting discs (AU Mon) to emission located at specific quadrants (HD 170582). It is interesting that in the case of the eclipsing systems AU Mon (Barría, 2014), V 393 Sco (Mennickent et al., 2012b) and DQ Vel (Barría et al., 2013) larger Balmer emission is found at high state. In HD 170582, seen at intermediate inclination, the H emission at the stream-disc impact region during high state decreases, compared with the H emission, something that could be interpreted as evidence of optically thicker material produced by a larger mass transfer rate. If this tendency is confirmed in other DPVs, it could be an indicator that the long cycles are modulated by a variable mass transfer rate. In this context it is worth noticing that the larger Balmer emission observed at the high state of V 393 Sco has been interpreted as the result of a bipolar wind emerging from the stream-disc impact region (Mennickent et al., 2012b).
DPV discs seems to be stable, optically thick and relatively small, with radial extension a few times the stellar radius (Mennickent, Otero, & Kołaczkowski, 2016). Since DPVs are tangential impact systems, these discs are probably formed by saturation of the primary after rapid spin-up till critical velocity (Mennickent, Otero, & Kołaczkowski, 2016). To our knowledge, no previous study has been done to inquire about the source of luminosity for these discs. We have found that they are not accretion powered, like discs around compact objects. This is reasonable due to the smoother gravitational potential well. However, they are relatively luminous, as much as 50% the primary luminosity. One possible heating source for the disc is the primary star, through capture and reprocessing of their high-energy photons, others possible sources are the shock produced by the gas stream and the disc dynamics.
5 Conclusions
Most of the spectra of HD 170582 used in this paper were obtained with resolving power 40 000 between years 2008-2013 and were presented for the first time by M15.
In this work we present a complementary analysis, studying the orbital and long-term behavior of H and H emission lines obtained after disentangling the donor spectrum. We also explore the system evolutionary stage. Critical in
our methodology is the assumption that the line emissivity can be recovered by subtracting the donor absorption spectrum at every orbital phase. In addition, comparison
of the system parameters with the grid of binary star evolutionary tracks is limited by the ad-hoc treatment of mass loss by the models. This point might be not an important issue, since the best model is a conservative one.
Keeping in mind these limitations, we have arrived at the following conclusions:
-
•
The line emission velocities are not associated with the stable and optically thick disc contributing to the orbital light variability, but to outer optically thinner circumstellar regions.
-
•
Two bright regions, one in the 1st and another in the 4th quadrant, are visible in the Doppler tomograms. They can be interpreted as shock regions arising from the gas dynamics in the system, as indicated by published hydrodynamical simulations of semidetached close binaries; the penetration of the gas stream into the disc and the hitting of disc material back into the stream.
-
•
We find a change in the emissivity properties of the material located in the stream-disc impact region: at high stage the H emission is weaker than in low stage compared with H emission. This fact might indicate optically thicker material at high state, possibly caused by a larger mass transfer rate. If this tendency is confirmed in other DPVs, it could be an indicator that the long cycles are modulated by variable mass transfer rates.
-
•
The disc luminosity, inferred from the light curve model, is larger than expected due to accretion. Therefore, other heating sources are likely acting in the disc material, i.e. reprocessing of the primary high-energy photons or heating by shock regions.
-
•
The disc luminosity for 5 well-studied DPVs scales with the primary mass and is always much larger than the luminosity inferred from the accretion disc theory and the published mass transfer rates.
-
•
For the above reason, we should not use the assumption of accretion driven disc luminosity to infer values for the mass transfer rate in DPVs.
-
•
We find the best model for the system among a grid of evolutionary models for Algol-type binaries. It is found in a Case-B conservative mass transfer stage, with an age of 7.68 107 yr and a mass transfer rate of 1.6 10-6 M⊙ yr-1.
| DPV | () | () | ||||||||||
|---|---|---|---|---|---|---|---|---|---|---|---|---|
| OGLE 05155332-6925581 | 9.1 | 0.5 | 5.6 | 0.2 | 3.1E-6 | 10471 | 14.1 | 0.5 | 24.45 | 4225 | 0.40 | 5.0E-4 |
| HD 170582 | 9 | 0.2 | 5.5 | 0.2 | 1.6E-6 | 2884 | 20.8 | 0.3 | 19.65 | 1564 | 0.54 | 2.0E-4 |
| V393 Sco | 7.8 | 0.5 | 4.1 | 0.2 | 9.5E-9 | 1148 | 9.7 | 0.3 | 0.07 | 460 | 0.40 | 1.0E-4 |
| DQ Vel | 7.3 | 0.3 | 3.6 | 0.2 | 9.8E-9 | 1380 | 12.9 | 0.3 | 0.06 | 413 | 0.30 | 1.0E-4 |
| AU Mon | 7 | 0.3 | 5.1 | 0.5 | 7.6E-6 | 1380 | 12.7 | 0.6 | 49.77 | 197 | 0.14 | 3.0E-5 |


Acknowledgments
We acknowledge an anonymous referee for useful comments regarding the first version of this paper. R.E.M. acknowledges support by VRID-Enlace 214.016.001-1.0 and the BASAL Centro de Astrofísica y Tecnologías Afines (CATA) PFB–06/2007. S. Z. acknowledges support from DGAPA/PAPIIT project IN100614 and CONACyT grant CAR 208512. G. D. gratefully acknowledges the financial support of the Ministry of Education and Science of the Republic of Serbia through the project 176004, Stellar physics.
References
- Atwood-Stone et al. (2012) Atwood-Stone C., Miller B. P., Richards M. T., Budaj J., Peters G. J., 2012, ApJ, 760, 134
- Barría (2014) Barría, D., 2014, PhD thesis, Universidad de Concepción, Chile.
- Barría et al. (2013) Barría D., Mennickent R. E., Schmidtobreick L., Djurašević G., Kołaczkowski Z., Michalska G., Vučković M., Niemczura fE., 2013, A&A, 552, A63
- Barría et al. (2014) Barría D., Mennickent R. E., Graczyk D., Kołaczkowski Z., 2014, A&A, 567, A140
- Bisikalo et al. (1998) Bisikalo D. V., Boyarchuk A. A., Chechetkin V. M., Kuznetsov O. A., Molteni D., 1998, MNRAS, 300, 39
- Dennis and Torczon (1991) Dennis J.E., Torczon V., 1991, Direct search methods on parallel machines, in SIAM Journal on Optimization, Vol. 1, Issue 4, pages 448-474
- Djurašević (1992) Djurašević G., 1992, Ap&SS, 197, 17
- Eggleton (2011) Eggleton P., 2011, Evolutionary Processes in Binary and Multiple Stars, by Peter Eggleton, Cambridge, UK: Cambridge University Press.
- Frank, King, & Raine (2002) Frank J., King A., Raine D. J., 2002, Accretion Power in Astrophysics, by Juhan Frank and Andrew King and Derek Raine, pp. 398. ISBN 0521620538. Cambridge, UK: Cambridge University Press, February 2002.
- Fujiwara et al. (2001) Fujiwara H., Makita M., Nagae T., Takuya, 2001, Progress of Theoretical Physics, Vol. 106, No. 4, pp. 729-749.
- Garrido et al. (2013) Garrido H. E., Mennickent R. E., Djurašević G., Kołaczkowski Z., Niemczura E., Mennekens N., 2013, MNRAS, 428, 1594
- (12) Kurucz R., 1993, CD-ROM 18 (available at: http://kurucz.harvard.edu/)
- Levine & Chakarabarty (1995) Levine S., Chakarabarty D., 1995, IA-UNAM Technical Report MU-94-04
- Lucy (1994) Lucy L. B., 1994, A&A, 289, 983
- Marsh & Horne (1988) Marsh T. R., Horne K., 1988, MNRAS, 235, 269
- Mennickent (2013) Mennickent R. E., 2013, Central European Astrophysical Bulletin, 37, 41
- Mennickent (2014) Mennickent R. E., 2014, PASP, 126, 821
- Mennickent & Djurašević (2013) Mennickent R. E., Djurašević G., 2013, MNRAS, 432, 799
- Mennickent et al. (2003) Mennickent R. E., Pietrzyński G., Diaz M., Gieren W., 2003, A&A, 399, L47
- Mennickent et al. (2008) Mennickent R. E., Kołaczkowski Z., Michalska G., Pietrzyński G., Gallardo R., Cidale L., Granada A., Gieren W., 2008, MNRAS, 389, 1605
- Mennickent et al. (2012a) Mennickent R. E., Djurašević G., Kołaczkowski Z., Michalska G., 2012a, MNRAS, 421, 862
- Mennickent et al. (2012b) Mennickent R. E., Kołaczkowski Z., Niemczura E., Diaz M., Cure M., Araya I., Peters G., 2012b, MNRAS, 427, 607
- Mennickent et al. (2015) Mennickent R. E., Djurašević G., Cabezas M., Cséki A., Rosales J. G., Niemczura E., Araya I., Curé M., 2015, MNRAS, 448, 1137
- Mennickent, Otero, & Kołaczkowski (2016) Mennickent R. E., Otero S., Kołaczkowski Z., 2016, MNRAS 455, 1728–1745
- Pawlak et al. (2013) Pawlak M., et al., 2013, AcA, 63, 323
- Poleski (2010) Poleski R., Soszyński I., Udalski A., Szymański M. K., Kubiak M., Pietrzyński G., Wyrzykowski Ł., Ulaczyk K., 2010, AcA, 60, 179
- Press et al. (1992) Press W. H., Teukolsky S. A., Vetterling W. T., Flannery B. P., 1992, Numerical Recipes in Fortran, second ed., in: The Art of Scientific Computing, vol. 120, Cambridge University Press
- Richards et al. (2014) Richards M. T., Cocking A. S., Fisher J. G., Conover M. J., 2014, ApJ, 795, 160
- Spruit (1998) Spruit H. C., 1998, astro, arXiv:astro-ph/9806141
- van Rensbergen et al. (2008) van Rensbergen W., De Greve J. P., De Loore C., Mennekens N., 2008, yCat, 348, 71129