Circular polarization of the CMB: Foregrounds and detection prospects
Abstract
The cosmic microwave background (CMB) is one of the finest probes of cosmology. Its all-sky temperature and linear polarization (LP) fluctuations have been measured precisely at a level of 10-6. In comparison, circular polarization (CP) of the CMB, however, has not been precisely explored. Current upper limit on the CP of the CMB is at a level of 10-4 and is limited on large scales. Some of the cosmologically important sources which can induce a CP in the CMB include early universe symmetry breaking, primordial magnetic field, galaxy clusters and Pop III stars (also known as the First stars). Among these sources, Pop III stars are expected to induce the strongest signal with levels strongly dependent on the frequency of observation and on the number, Np, of the Pop III stars per halo. Optimistically, a CP signal in the CMB due to the Pop III stars could be at a level of 2 10-7 in scales of 1 at 10 GHz, which is much smaller than the currently existing upper limits on the CP measurements. Primary foregrounds in the cosmological CP detection will come from the galactic synchrotron emission (GSE), which is naturally (intrinsically) circularly polarized. We use data-driven models of the galactic magnetic field (GMF), thermal electron density and relativistic electron density to simulate all-sky maps of the galactic CP. This work also points out that the galactic CP levels are important below 50 GHz and is an important factor for telescopes aiming to detect primordial B-modes using CP as a systematics rejection channel. In this paper, we focus on S/N evaluation for the detectability of the Pop III induced CP signal in the CMB. We find that a S/N higher than unity is achievable, for example, with a 10 m telescope and an observation time of 20 months at 10 GHz, if N 100. We also find that, if frequency of observation and resolution of the beam is appropriately chosen, a S/N higher than unity is possible with Np 10 and resolution-per-pixel 1 K at an observation time of 60 months. A summary of different sources which can induce a CP in the CMB is summarized in Table. 1. Final results related to the detectability of cosmologically important CP are summarized in Fig. (11-13).
I Introduction
The CMB has been a finest probe of cosmology. A complete characterization of the CMB is made by quantifying the four Stokes parameters (jones, ) associated to its unpolarized intensity, LP and CP. Temperature and polarization anisotropies of the CMB have provided invaluable insight into the universe that we live in. Venture into the CMB studies began with its discovery in 1965 (penzias, ; dicke, ) which showed the CMB radiation to be a Black-body with a mean temperature of T 2.7255 K. Subsequently, the first detection of angular variation of the CMB mean temperature was measured with the COBE satellite (cobe, ) and today, the temperature fluctuations have been measured with an unprecedented precision (dasi, ; wmap, ; planckgeneral, ; act-temp, ; spt-temp, ). CMB is also linearly polarized due to Thomson scattering at the surface of last scattering. This polarization level is at 5 of the temperature anisotropies. Polarization fluctuations have been measured with a high precision and many future experiments are aimed to increase the precision of polarization measurements (bicep2-lensing, ; polarbear, ; quiet, ; spt-lensing, ; act-lensing, ). The Planck experiment reached a sensitivity level, 10-6 for temperature and polarization, a much higher level of sensitivity compared to the WMAP satellite. Together, the CMB temperature and LP data bring an overwhelming support for the cosmological standard model or the CDM (bond, ) model. It is only natural to wonder what information does the CP of the CMB store? The CP of the CMB has not been explored extensively and the current level of CMB CP measurement stands at a level 10-4 in the scales of 8 and 24 (mainini, ). This upper limit is much higher than the level of CP signal expected from any cosmologically relevant sources. Previously, lubin had made one of the first efforts to measure to the CP of the CMB. Recently, CLASS (class, ) and PIPER (piper, ) experiments proposed to measure the LP and CP of the CMB, however, the experiment is designed to focus on primarily the measurements of the LP of the CMB. These experiments aim to detect primordial B-modes using variable-delay polarization (VPM) instruments where the observing strategy relies on the expectation of CP of the sky to be null to constrain systematic uncertainties. In this paper, we have provided galactic CP maps for frequencies relevant for both CLASS at 40 GHz and PIPER at 220 GHz, showing that the galactic CP effects are important for frequencies below 50 GHz.
There are various cosmologically important sources which may induce a CP in the CMB via different mechanisms. Some of these CP production channels are intrinsic to the emission from a certain type of source, for example synchrotron emitting radio sources (sazonov, ; westfold, ). Some are due to the effects of external magnetic fields (ensslin, ) or other birefringent effects, and finally some mechanisms propose CP generation in the CMB by models that stand on departures from the Standard model of particle physics (thomson, ; compton, ; noncomm, ; noncomm-1, ; cnub, ; lv, ).
Among the sources which can induce a CP in the CMB due to presence of a magnetic field, are the so called Pop III stars, also known as the First stars. See (bromm ; pop3-properties ) for a review of the Pop III stars. decp describes how a CP in the CMB can be induced by the remnants of Pop III stars that went supernovae (SNe). These stars, residing in dark matter mini-halos, provide a window into the early structure formation which ended the cosmological dark ages and began the re-ionization along with metal enrichment of the inter-galactic medium. Pop III stars are expected to exist based on the numerical simulations of primordial stars formation and fossil abundance of SNe. However, there are no definite constraints on the properties of these stars (brommpop3openqs, ; currentprobpop3, ). These stars are generally expected to be directly detected by the most advanced future space telescopes like the WFIRST and the JWST (jwst, ), except under certain conditions when these Pop III stars explode into pair instability SNe (pinspop3, ) or hyper nova (hypernova, ) releasing energies around 1053 ergs. These stars and their properties are speculated by numerical simulations (tomsim, ; ragesim, ), however, they are far from being verified by observations. CP of the CMB provides an indirect and a much economical way of exploring into these Pop III stars.
In this paper we will primarily focus on S/N determination of the CP signal in the CMB due to the Pop III stars. However, there are other cosmologically important sources which induce CP in the CMB. These sources include the primordial magnetic field (PMF) (thomson, ; compton, ), different modifications and symmetry breaking mechanisms (noncomm, ; noncomm-1, ; cnub, ) beyond the Standard model particle physics and the galaxy clusters (cooray, ). Most of these sources induce a lower signal level in CP of the CMB when compared to the level of CP induced by the Pop III stars. However, these sources could certainly be explored via the CP in the CMB once the instrumental sensitivity improves.
In addition to the cosmologically important sources of CP, the Milky Way (MW) galaxy produces synchrotron radiation which is intrinsically circularly polarized. Circularly polarized synchrotron emission from the MW galaxy acts as a foreground towards the detection of the cosmological CP in the CMB. Currently, there is not enough observational data to accurately shed light on the level of CP from the GSE. In this paper, we generate numerical simulations of the galactic CP due to synchrotron emission using data-driven models of the GMF and cosmic ray electron energy distribution.
CP in the CMB could potentially detect the existence of the Pop III stars, symmetry breaking in the early universe or the existence of primordial magnetic field. Implementing direct detection of these sources will need a revolution on the instrumentation front, involve a long time-scale and a very high cost. Exploring some of these highly interesting sources indirectly via the CP in the CMB is possible within the current reach of instrumentation, achievable at a moderate timeline and cost.
In this paper, we will discuss the sources, foregrounds and detection prospects of the cosmological CP of the CMB. Sec. II discusses theoretical framework needed for the description of CP, Sec. III presents an overview of various sources and mechanisms which induce CP in the CMB. Sec. IV-VI discuss the galactic foregrounds in CP and simulations. Sec. VIII represent the results on detection prospects. Finally, we discuss the future directions and implications of this work in Sec. IX.
II Polarization transfer equation
A complete description of polarization of an electro-magnetic (EM) wave is described by four Stokes parameters, intensity I, linear polarizations (LP) Q and U, and circular polarization (CP) V. Together (I,Q,U,V) represent the Stokes vector associated to the EM wave. The evolution of different Stokes vector components of an EM wave propagating through a plasma are governed by the following polarization transfer equation (jones, ).
| (1) |
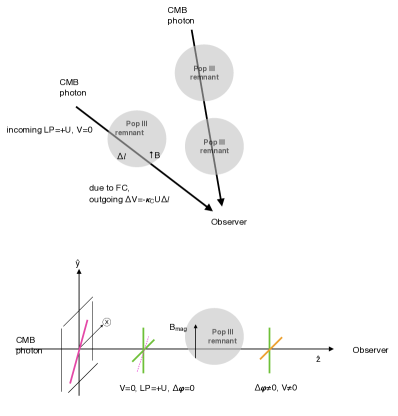
where the spatial derivatives on the left side of the equation indicate the change in Stokes vector along the line of sight, taken to be inclined along the z axis. The coefficients indicate emissivity and indicate absorption coefficients corresponding to the Stokes vectors I, Q, U and V. Under an isotropic distribution of unperturbed particles in a plasma, the conversion coefficient, between Q and V, vanishes due to dielectric symmetries (jones, ; beckert, ). Eq. (1) uses a coordinate frame where the sky projected magnetic field component is aligned along the y axis. Under this geometry, Stokes components +U is defined as LP aligned along an axis which makes an angle of 45, clockwise with respect to the y axis. Component +Q(-Q) is defined as LP aligned along the y(x) axis. Please see Fig. 1 for a schematic view of the coordinate system used. Stokes components I and V are invariants under coordinate transformations (kosowsky, ).
The ordinary rotation between Stokes components Q and U are driven by the Faraday rotation (FR) coefficient, . FR is simply the rotation of the plane of LP of an EM wave propagating through a magneto-active plasma due to a local magnetic field along the line of sight.
The generalized rotation, also known as the Faraday conversion (FC), described by the conversion coefficient, , controls the transfer between U and V components. To understand the FC effect, consider a linearly polarized EM wave propagating through a plasma where an external magnetic field is aligned along the y axis. Charged particles moving along the y axis will experience a different Lorentz force than those along the x axis. Let the LP of the incoming EM wave be +U (for example), which can be decomposed into two linear components, each along the y and the x axes. Since the particles along the x and y axes move differently due to the asymmetry introduced by the external magnetic field, there will now be a phase difference between the orthogonal LP components (along x and y axes). Thus EM wave will therefore have acquired a CP, depicted by the Stokes component V.
In the case of the CMB, under the standard cosmological model, vanishes (weinbergbook, ). The coefficients are non-zero due to anisotropic Thomson scattering. Effects of non-standard cosmology or new physics can induce a non-zero . We provide a summary of such possibilities in Sec. III.4 and in Table. (1). Conversion between U and Q components of the CMB due to FR induced by the galactic magnetic field has been been studied by defr .
Possibilities of conversion between U and V components of the CMB due to the FC effects induced by the Pop III remnants and galaxy clusters are discussed in Sec. III.1 and Sec. III.2, respectively.
III Overview of different CP sources
III.1 Pop III stars as CP sources in the CMB
Pop III stars mark the transition of a simple homogeneous universe of H-He gas into a complex and structured universe after the cosmic dark ages. Pop III stars are therefore also known as the First stars. Simple interpretation of optical depth observed by WMAP and PLANCK suggest star formation activity at z 11 (plancktau, ; yoshida, ; dunlop, ). Supernovae explosions of the Pop III stars was responsible for the metal enrichment of the inter-galactic medium (loeb, ). These Pop III stars are predicted to form in dark matter minihalos of mass 10 around z 20-30 (brommpop3openqs, ). A low-mass halo is needed to virial temperature below the threshold of Tvir=104K to allow efficient atomic hydrogen cooling, necessary for collapse. The Pop III stars are yet unobserved and there is significant lack of certainty of their properties, most of which are predicted from numerical simulations and therefore, are highly model dependent.
Significance of understanding of the Pop III stars is enormous. Many of the implications drawn from the Pop III stars depend on the mass of these primordial stars. If the Pop III stars are massive ( 100 ), they can be connected to several effects which can be tested in the distant future. For example, Sunyaev Zeldovich effects of the CMB (haiman, ; oh, ), Gravity waves from Black holes formed from Pop III remnants (madau, ; suwa, ). One of the most certain and significant effects of the Pop III stars is the cosmological heavy element production and the cosmic reionization (frebel, ; tumlinson, ; greif, ; wyithe, ).
In decp , Pop III stars are established as a source of appreciable CP in the CMB. Intrinsic CP of such sources is small, however, the CMB acts as a back-light in this scenario. As the CMB photons pass through the relativistic plasma of the Pop III remnants, a fraction of the CMB linear polarization is converted into CP, via the FC mechanism. Please refer to Sec. II for a schematic explanation of the FC mechanism under which in Eq. (1) describes the transfer of the Stokes U into the Stokes V component in the CMB.
Using a simple analytical model of a SN remnant of a Pop III star, decp evaluates described in Eq. (1) as
| (2) |
where is the age of the SN remnant, is the energy of the explosion and and are the fractions of the explosion energy respectively into the relativistic electron energy and the magnetic fields in a SN remnant. is the CMB observation frequency. Following the so-called halo model, the angular power spectrum of the CP due to the Pop III stars is evaluated. Angular power spectrum is effectively the square of the rms fluctuation in V, or . In decp , Pop III stars are assumed to only exist in halos with virial temperature, K where atomic hydrogen cooling is effective for the collapse. Since the signal of CP due to FC mechanism falls off with frequency, we set our normalization frequency to be 10 GHz in future equations in this paper. A frequency much lower than 10 GHz calls for a full solution of the transfer equation, which will be addressed in future work.
Around , a simple formula corresponding to the brightness temperature associated to the fluctuation V can be expressed as the following.
| (3) |
where Np is the number of Pop III stars per halo. is the spectral index of the electron energy distribution around the Pop III remnant, and 2 (syncpop3, ).
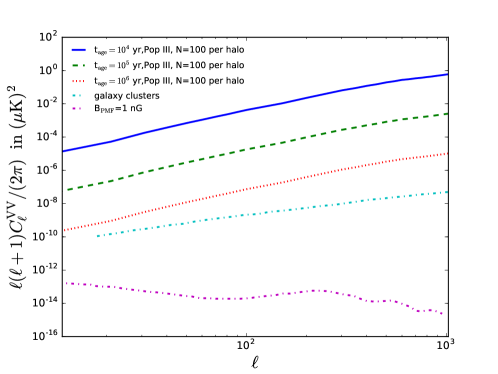
In Fig. 2 different Pop III associated CP signals are shown. Note that, falls off very sharply with frequency of CMB observation as and also with increasing age, of the Pop III remnants. In Fig. 2 we use which comes from the Compton cooling timescale of the remnants. The number of Pop III stars in a halo is uncertain and could be up to 103 (pop3-xu, ). increases with Np as N. Not explicit from Eq. (3), the quadratic dependence of the signal in V on the local magnetic field, B is B2. This dependence can be easily seen in Eq. (2) via linear dependence of on or effectively the magnetic energy ().
All relevant cosmological and astrophysical parameters are also described in decp .
| Source | Mechanism for CP | Frequency | B | Predicted CP | |
| dependence | dependence | signal in V (K) | |||
| at =10 GHz | |||||
| Primordial | primordial B+ | B | 10-9 | ||
| Compton scattering (compton, ) | |||||
| Primordial | Lorentz invariance | NA | 10-12 | ||
| violations (lv, ) | |||||
| primordial | Non-commutivity (noncomm, ; noncomm-1, ) | NA | 10-12 | ||
| primordial | B+Thomson | B2 | 10-12 | ||
| scattering (thomson, ) | |||||
| Cosmic neutrino | Scattering with | NA | 10-8 | ||
| background | left handed | ||||
| (CB) | neutrinos (cnub, ) | ||||
| Pop III stars | FC (sazonov, ; decp, ) | B2 | few 10-6 | ||
| ( 1000, =104 yr, =100) | |||||
| few 10-5 | |||||
| ( 1000, tage=104 yr, =1000) | |||||
| few 10-7 | |||||
| ( 100, tage=104 yr, =100) | |||||
| Galaxy clusters | FC | 10-10 | |||
| ( 1000 (cooray, )) | |||||
| Galactic synchrotron | intrinsic | B3/2 | 10-8 ( 100) | ||
| emission (westfold, ) | 10-9 ( 500) |
III.2 Galaxy clusters as a source of CP in the CMB
Another source of CP in the CMB are the galaxy clusters which induce CP via the FC mechanism due to their magnetic field and relativistic electrons. This scenario was explored in cooray where a mean field of 10 G with a coherent scale of 1 Mpc was adopted. In Fig. 2 we also represent the induced in the CMB due to FC in the galaxy clusters at GHz, a result which has been derived from cooray . FC coefficient in this scenario is given by,
| (4) |
where RM is the rotation measure for the galaxy clusters. Temperature equivalent Stokes V in the CMB due to galaxy clusters around can be simply expressed as
| (5) |
Note that the CP signal due to galaxy clusters is much smaller compared to that due to the Pop III stars.
III.3 Primordial magnetic field as a source of CP in the CMB
Primordial magnetic field (PMF) is speculated as a source of magnetic field in the universe (reviewpmf, ; ruth, ). Current limits on the PMF is few nG today (planckpmf, ). thomson showed that CP is naturally generated in the CMB in presence of Thomson scattering, primordial magnetic field, spatial curvature and adiabatic fluctuations. This CP generation is intrinsic () and does not require any pre-existing linear polarization, unlike FC. In Fig. 2 due to the presence of a primordial magnetic field of an equivalent field strength, BPMF=1 nG is shown, following (thomson, ).
| (6) |
For all cases in Fig. 2, is set at 10 GHz.
III.4 Summary of other CP sources
Under the realms of the Standard model, the CMB does not have any significant intrinsic Stokes V component. However, an early universe symmetry-breaking, or the presence of new-physics, or scattering processes in presence of the primordial magnetic field could induce an intrinsic Stokes V component in the CMB. Many of these possibilities are summarized in Table. (1) along with references. One of the most concerning source of non-cosmological CP is synchrotron emission in our galaxy. GSE is intrinsically circularly polarized and therefore poses as a foreground to cosmologically important CP sources in the CMB. The GSE is produced by the cosmic ray electrons in presence of the galactic magnetic field. We will discuss the GSE in much more detail in Sec. IV.1 and Sec. IV.2. Table. (1) also lists sources for FC driven and intrinsic CP generation. In each case, Table. (1) lists frequency and magnetic field dependence of the signal. Each case also projects an expected signal at =10 GHz.
IV Modeling of foregrounds to the CMB CP
IV.1 Intrinsic CP of the GSE
Total brightness of the galactic radio sky is dominated by the diffused synchrotron emission due to the cosmic ray electrons and positrons gyrating in the GMF (cowsik, ). This emission is significant between frequencies of a few tens of MHz to a few tens of GHz. The primary sources of cosmic ray electrons are supernovae remnants, pulsars in the galaxy. The energy range of the cosmic ray electrons are between a few hundred Mev to tens of Gev. The GMF strength a few G. The ordered components of the GMF is coherent on kpc scales, however, the GMF also has a random component which varies in scales of a few hundred parsecs (beckreview, ).
Synchrotron emission due to the MW galaxy happens to be the strongest source of foreground to the CMB observations at low frequencies (wmapy1fore, ; wmapy7fore, ). Synchrotron emission is also naturally expected to have a rather high level of LP, and there has not be any significant measurements of its CP. Synchrotron emission coming from relativistic cosmic rays, is expected to be elliptically polarized even with an isotropic distribution of the electron velocity (westfold, ). Emissivity, or the intrinsic CP of the GSE under a power-law electron energy distribution is given by
| (7) |
where is the elemental length along the line of sight. is the emissivity associated to the unpolarized intensity of the synchrotron emission. is the gyro-frequency of the magnetic field component perpendicular to the line of sight. is a function of the spectral index of the electron energy distribution and its detailed form is found in westfold . In this paper, for simplicity, we set (see eq. (31-35) of westfold ) which is obtained using reasonable parameters for the electron energy distribution obtained from the observation of the Crab nebula (crab, ; crab2, ) and low frequency observations from the Planck satellite (planckdiffuse, ). Typically, F1 lies between 1 and 2, if 1<<3, being the spectral index of cosmic ray electron energy distribution.
IV.2 CP generation via FC in the MW galaxy
GSE is a crucial and significant source of foreground towards cosmologically important sources of CP in the CMB. In this paper, we only focus on the intrinsic emission of the galactic synchrotron as the most significant foreground towards the cosmic CP. Circularly polarized synchrotron emission in the MW galaxy is described by the term in Eq. (1) and its precise form is given in Eq. (7).
Another possible mechanism of galactic CP generation is the FC in the galaxy due to relativistic cosmic ray electrons gyrating in the GMF. In this section, using simple analytic models, we will estimate the magnitude of FC induced galactic CP. We begin with the following cosmic ray electron density distribution (page, ; strong, ).
| (8) |
where r is the galactic radius and z is the height. Synchrotron spectral index, 3, Lorentz factor, lies between 100 and 300 for the galaxy and Ccre=4 cm-3. The radial scale and disc height are respectively set by kpc and =1 kpc. We use 0.5 kpc and 0.5 kpc at =10 GHz in Eq. (8) to obtain relativistic electron density in the MW galaxy. We then use Appendix D. of beckert to obtain FC coefficient in the galaxy, kpc-1.
The amount of CP induced via the FC effect in the galaxy is , where is the total incoming LP due to the CMB and the GSE at a given frequency . K, and therefore induces a CP due its passage through the galaxy as K, which is much smaller than any other cosmologically important source of CP in the CMB.
GSE also has a significant level of intrinsic LP (westfold, ) and therefore is subjected to FC effects in the galaxy. In Sec. VI.2, we show the expected level of LP in the GSE (see Fig. 5) at =30 GHz. We note that the highest level of intrinsic LP of the GSE is a few tenths of K. This level does not change significantly with our frequencies of interest ( 5 GHz). Therefore, CP induced in the galaxy due FC of the GSE is 10-16kpc-1K. In contrast, intrinsic CP of the GSE at =10 GHz is K, obtained using equations in Appendix D. of beckert with B 10G. This level is also supported by Fig. 6. Therefore, FC induced CP of the GSE is negligible compared to its intrinsic CP.
CP levels in the galaxy is a function of frequency and the relative importance of different channels to generate CP, depends on the frequency. The of the ratio of intrinsically generated CP vs FC induced CP in the galaxy is given by
| (9) |
where is the total incoming LP in the galaxy, composed of contributions from both the CMB and the GSE. is the angle between the magnetic field and the line of sight, is the minimum Lorentz factor for the relativistic electrons in the galaxy and is the cyclotron frequency given by . The ratio is at =10 GHz, B=10G, and . LP in the CMB is not a function of frequency and is given by K. The level of LP in the galactic synchrotron emission is significant compared to the unpolarized intensity. K at =10 GHz and eventually falls off with higher frequency. Therefore, along a given line of sight, is a monotonically increasing function of frequency. Therefore, in our frequencies of interest (5 GHz < <30 GHz) for the CMB CP measurement, FC induced CP of the CMB or the GSE is not an important effect.
To every emission there is an associated absorption. This applies to both the unpolarized Stokes intensity, I and circular polarization Stokes intensity V. The intrinsic emission in Stokes V will be extinct if the emission and absorption were perfectly balanced, or . Therefore, it is also important to consider the absorption of the circularly polarized emission in the galaxy. The absorption is given by . Following Appendix D of beckert we obtain,
| (10) |
where is a function of the spectral index, , of the relativistic electron energy distribution. For the galaxy, we use . For the GSE, . The ratio is at =10 GHz, B 10 G, K and is an increasing function of frequency. This implies that absorption of the CP emission in CMB observation frequencies (1 GHz or above) is not significant. Absorption of the synchrotron emission component is however significant in so-called self-absorbed synchrotron sources where . This scenario is realized at much lower frequencies, 10 MHz (smootsync, ). Therefore, synchrotron self absorption of its circularly polarized emission is not a concern in our case.
Synchrotron self-absorption of the unpolarized intensity, is also not important for the galaxy in the frequencies of interest ( 1 GHz). In the case of very low frequencies 1 GHz, some extra-galactic sources could become self-absorbed or optically thick. In this low frequency regime, synchrotron flux from the sources decreases with decreasing frequency. On the contrary, at higher frequencies, flux emitted by the synchrotron sources decreases with increasing frequency. This turn-over in flux-frequency relation pollutes the smooth synchrotron frequency dependence, altering the spectral index of the synchrotron brightness temperature. Spectral smoothness is important in order to successfully remove foregrounds. Synchrotron flux from the galaxy is still high at frequencies 1 GHz. However, due to the smooth dependence of the synchrotron flux on the frequency, foreground removal via a polynomial fit, is easier. This is especially relevant where the signal of interest (for example, the CMB CP due to galaxy clusters) is lower than the foregrounds. Unless the number of such sources is small enough, it is wiser to confine the search for the cosmic CP at frequencies 5 GHz. This is also the motivation for us to confine the CMB CP observation frequencies between 5-30 GHz.
Below we summarize the conclusions from the current section.
-
–
CP induced in the CMB due to the MW galaxy (via the FC mechanism) is much smaller than the levels of CP induced in the CMB due to cosmologically important sources (see Table. (1)).
-
–
CP induced in the GSE via the FC mechanism is much smaller than the intrinsic emission of circularly polarized synchrotron radiation in the galaxy.
-
–
CP induced intrinsically (via the term in Eq. (1)) is higher than the FC induced CP in the galaxy at all frequencies of interest.
-
–
Self-absorption of the circularly polarized GSE is not important in the frequencies of interest.
-
–
Self-absorption of unpolarized intensity of the GSE may pollute the smoothness of synchrotron spectra at frequencies 1 GHz.
 |
 |
 |
 |
V Non-synchrotron foreground sources of circular polarization
The MW galaxy is bright in free-free emission in our frequencies of interest, 5-30 GHz. The free-free signal does not attribute to polarized sky. There is some spinning dust signal which is linear polarized (planckdiffuse, ), however, linear polarization in these frequencies due to spinning dust is much smaller than LP due to synchrotron. An intrinsic CP due to spinning dust is not expected. There is also little chance of FC of the LP (due to dust), as we have seen in Sec. IV.2 that the FC coefficient due to the MW galaxy is very small. Therefore, we do not expect any appreciable CP due to the free-free and the spinning dust emission in the galaxy, in the frequencies between 5-30 GHz.
oxygen discusses recent observations of meso-spheric oxygen induced CP at large angular scales. Temperature equivalent CP due to the atmospheric source is sensitive to the height of the atmospheric sources. Typically, this signal is described by a dipole-like large scale structure with K. We will neglect this atmospheric contribution into the noise estimate. Oxygen related effects are only important in the largest scales for the balloon based experiments. They are however, more serious for the ground based experiments that are aiming to detect a circularly polarized component in the CMB.
Generally, brightness in free-free emission or dust emission will not affect the CP measurement unless there is leakage, which causes mixing between different types of signal, such as polarized signal and non-polarized signal. In this paper, we neglect leakage of any kind.
VI Construction of the Stokes V maps due to the GSE
VI.1 The HAMMURABI code: Implementation of CP due to the GSE
We use the HAMMURABI code (waelkens ) to create maps of Stokes parameters I, Q, U and V due to the GSE. Calculation of Stokes I, Q and U parameters are part of the original implementation of HAMMURABI and clearly described in waelkens . These simulations use an input magnetic field, free electron density and relativistic electron density models to output the Stokes vectors into Healpix formatted maps (healpix, ) at a given frequency and spatial resolution. Below we summarize the precise inputs used for the HAMMURABI code to generate the Stokes V simulated maps.
 |
 |
Please note, Stokes V calculation is not part of the original HAMMURABI implementation. We use Eq. (7) to implement the construction of Stokes V field due to intrinsic synchrotron emission of the MW galaxy, into HAMMURABI. All the Stokes vector outputs are expressed in temperature units of K and Healpix formatted maps of user specified resolution. A synchrotron spectral index of p=2.8 was used in all HAMMURABI simulation unless specified otherwise.
VI.2 Comparison between HAMMURABI simulations and observations
The main goal of this section is to justify the use of the HAMMURABI code in galactic CP power spectrum calculation. In order to do so, we use the component separated synchrotron maps of both intensity and polarization provided at the Planck collaboration website.
The data-driven model of GSE in the Planck website is based on a few datasets. They are,
-
–
408 MHz synchrotron emission map (haslam, ).
-
–
WMAP low frequency observations (wmap, ) (with resolution of 1).
-
–
PLANCK low frequency observations (planckdiffuse, ).
Following the methods described in rema and using the above datasets, a 408 MHz map of the GSE is generated (see http://irsa.ipac.caltech.edu/data/Planck/release_2/all-sky-maps/foregrounds.html). This map has a a resolution of 1 . Following similar methods and datasets a 30 GHz map of polarized synchrotron emission (planckdiffuse, ; psmpaper, ) was generated with a resolution of 40 arcmin.
Next question to ask is, which quantities one must compare between the HAMMURABI simulations and the observed datasets to validate the HAMMURABI code generated Stokes V map? To answer this question, we consult Eq. (7), which describes our implementation of the intrinsic CP of the GSE. Eq. (7) indicates that CP depends on the Isync at a given point in the sky, and ratio of line of sight component and the perpendicular component of the GMF. Generally, synchrotron emission (in polarized and total intensity) are proportional to B⟂ component of the GMF. On the other hand, galactic rotation measure (RM) is proportional to (defined along the line of sight). Magnitude of CP along a line of sight is proportional to Isync along that line of sight but also sensitive to B⟂/B∥, which is more uncertain to determine.
We make comparisons between HAMMURABI and Planck, WMAP and Haslam joint dataset. We do this both in real space and also in terms of the angular power spectra. Lets define an all-sky intensity field I=Isync() and use Healpy, a python implementation of the original Healpix, to find
| (11) |
where W() is the mask which is 0 if a pixel is masked and 1 if it is not. We then evaluate
| (12) |
where fsky is the sky fraction. represent the angular power spectrum of the unpolarized intensity of the GSE.
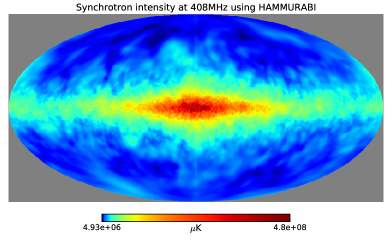
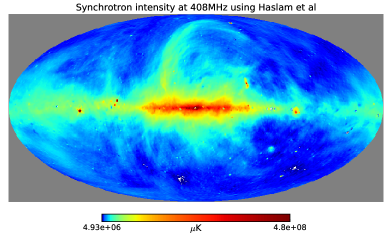
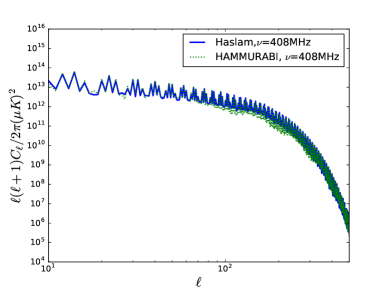
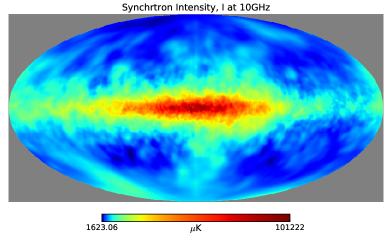
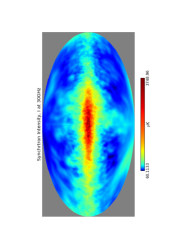
In Fig. 3 we present 408 MHz Haslam (haslam, ; rema, ) dataset derived galactic synchrotron intensity, on the right column. On the left column, we present the 408 MHz map of the GSE created by the HAMMURABI simulation. The spectral index chosen for this simulation was =2.8. Other inputs chosen for the simulation are described in Sec. VI.1. Both maps are smoothed at a resolution of 1.
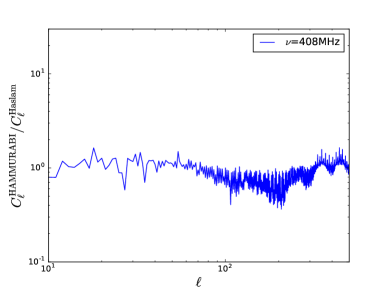
In Fig. 4 we present the angular power spectra of the 408 MHz Haslam data driven synchrotron power spectrum, and that given by the HAMMURABI simulation. We follow Eq. (12) to derive the power spectra. In each case, an identical mask was used to remove the high-foreground galactic disc from the sky. A 20 symmetric cut around the equator along with the WMAP K-band mask was used. More on the specifics of other masks and their effect on the power spectra is described in Sec. VII.1. Fig. 4 shows that the shapes of the power spectra are similar and the ratio of power at each angular scale fluctuates around unity. The HAMMURABI map was scaled with the Haslam 408 MHz map at =100.
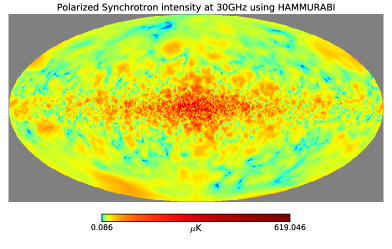
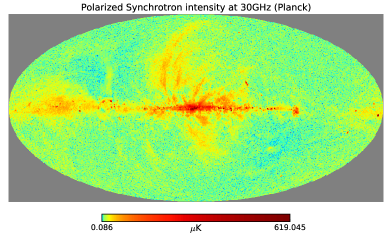
In Fig. 5 we present the 30 GHz synchrotron polarized map (left panel) derived from the Haslam, Planck and WMAP data (rema, ; psmpaper, ; wmap, ; planckdiffuse, ) and the HAMMURABI waelkens simulations (right panel). The total polarization from synchrotron emission from the galaxy is plotted. The maps are presented in Rayleigh-Jeans temperature equivalent units. The maps represent the total polarization given by P= in the units of K. The left panel represent the 30 GHz polarized map of the GSE obtained with an uniform synchrotron spectral index of =2.8. The right panel represent the data-driven synchrotron polarization map. Each map produce similar morphology although there are many mismatches in details. The more detailed and accurate maps could be produced by using more accurate GMF models which are not available at the moment.
-
–
The power spectra of synchrotron intensity between the HAMMURABI simulation and observed data at 408 MHz match at each scale with their fluctuation within unity.
-
–
The polarization of the GSE between the HAMMURABI and observed data at 30 GHz match in overall morphology and order of magnitude estimates for the polarization.
-
–
There are many finer details of morphological mismatch between the polarization maps between the HAMMURABI simulation and the observed data. This mismatch arises from inadequate GMF models and models of the cosmic ray electron density, which can only be improved with more data in the future.
-
–
The galactic disc is the highest source of synchrotron intensity and polarization. The disc-removed angular power spectra of the synchrotron intensity between HAMMURABI and observed data agree reasonably well. Therefore, S/N derived using GSE angular power spectrum estimates is expected to be reliable (See Eq. 15).
Currently, there are no reliable observed datasets for all-sky galactic CP. We will describe HAMMURABI code generated simulation of galactic CP in the next section.
VI.3 All-sky maps of galactic CP simulated by HAMMURABI
 |
 |
 |
 |
 |
 |
 |
 |
 |
 |
Below, we will describe maps of both unpolarized and polarized synchrotron emission due to the MW galaxy, evaluated at 10 and 30 GHz. The resolution of the maps were managed using Healpix specified parameter NSIDE, where the corresponding angular resolution of the map is given by . Each map was generated with NSIDE=256.
As already discussed in Sec. IV.2, FC effects due to the MW galaxy is insignificant compared to the CP or the Stokes V induced in the CMB due to primordial effects or intrinsic V of the synchrotron emission of the MW galaxy itself. Therefore, only the intrinsic generation of CP due to galactic synchrotron emission or (in Eq. (1)) term was considered for the galactic Stokes V map calculation.
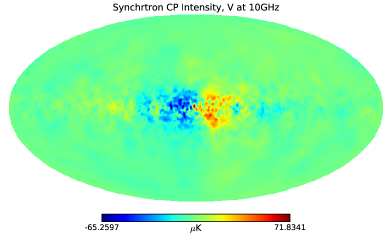
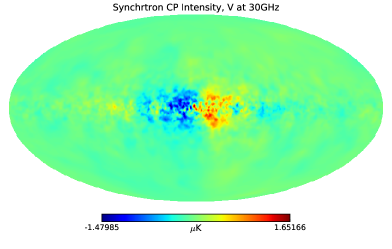
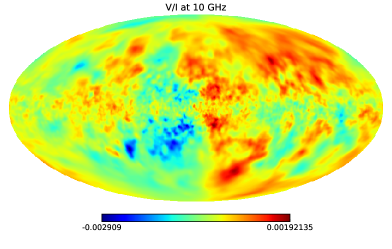
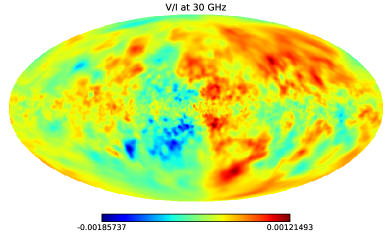
In the left column of Fig. 6 we display synchrotron radiation from the MW galaxy in Stokes I, V and V/I. Left panel represents =10 GHz and the right panel corresponds to =30 GHz. Each map was smoothed at a resolution of 1.
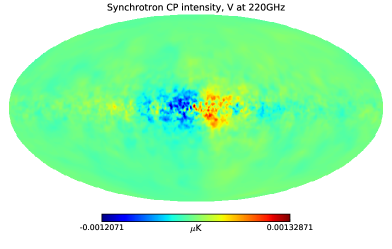
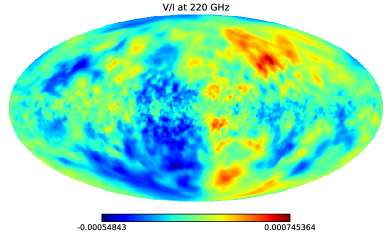
In Fig. 7 we add two sets of maps at 40 GHz and 220 GHz which are more relevant to the upcoming CMB telescopes, CLASS and PIPER with capabilities to measure Stokes V. Please note, that for the frequency relevant for the PIPER telescope, galactic CP is lower by a factor of (40/220)3=610-3, compared to its levels at 40 GHz which is relevant for the CLASS telescope.
-
–
The magnetic field strengths are highest around the disc of the galaxy causing the highest synchrotron signal in Stokes I along the disc.
-
–
Along a given line of sight, synchrotron intensity falls off as a power law with increasing frequency as . Note that, this frequency dependence is different from dependence in the case of FC generated CP.
-
–
It follows from Eq. (7) that emission in Stokes is proportional to the synchrotron intensity, and also depends on the ratio , where is the sky projected magnetic field and is the line-of-sight magnetic field. Following a magnetic field configuration that is symmetric around the galactic disc, a high correlation between I and V along the disc is expected. The level of Stokes V agrees well with analytic calculations using simple equations for the coefficients of the transfer equation in Appendix D. of beckert .
-
–
Along a given line of sight, CP of the GSE falls off as a power law with increasing frequency.
-
–
The ratio of V/I along a given line of sight, decreases with increasing frequency (See Eq. (7)).
VII Angular power spectra of CP due to the GSE
VII.1 Construction of the galactic mask
From Fig. 6 it is clear that the galactic disc is the highest source of foreground emission in V. Therefore, we create a mask to block these parts of the sky in order to evaluate S/N in Sec. VIII. The mask used in this paper is a superposition of a WMAP K-band mask (wmap, ) and a symmetric 20 cut around the galactic plane. The galactic plane was cut out to avoid the highest source of foreground in V. The WMAP mask was used to remove additional point sources and generally high synchrotron source, since it is expected from Eq. (7) that increases with . The effective sky fraction, using this particular mask is 0.65.
VII.2 Angular power spectrum of galactic CP from HAMMURABI
 |
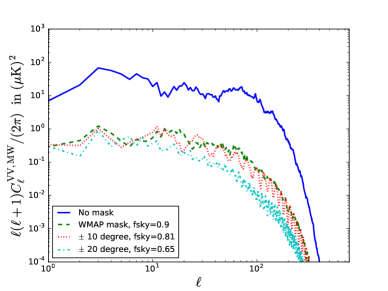 |
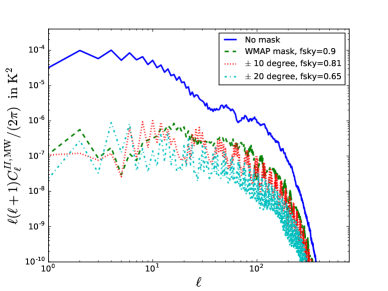
In this section we will discuss the angular power spectrum of CP due to the synchrotron emission of the MW galaxy. The only source of CP is the intrinsic emission term described in Eq. (1). In order to construct the angular power spectra, we first generate the galactic circular polarization field V=Vsync() using HAMMURABI, as a function of solid angle . To calculate the power spectra, of the CP due to the GSE, we use the following equation.
| (13) |
where fsky is the sky fraction. Please see Eq. (11) for the definition of . Angular power spectra of the Stokes I and V components due to the GSE are shown in Fig. 8. We compute using different masks, each labeled in the plot. Each mask is a superposition of both WMAP K-band mask and a symmetric galactic cut. The synchrotron I and V fields were smoothed with a Gaussian beam of FWHM=1. We make the following observations in the power spectra of CP and unpolarized intensity, due to the GSE.
-
–
A saw-tooth feature in the power spectra of both Stokes I and V at larger scale, which is due to symmetry between the northern and southern galactic sky and invariance with shift in longitude (sarkar, ). A perfectly symmetric map around the galactic plane, will only have angular power with non-zero if only is even. However, if the symmetry is partially broken, or not perfect, then for odd values of will also get populated. This is supported by an increasingly saw-tooth nature of the spectra in both I and V as we remove the galactic plane using a mask and tend to a smoother and more symmetric synchrotron sky.
-
–
The saw tooth behavior of in large scale is opposite of , due to the extra factor of in evaluation of following Eq. (7). This implies for a perfectly symmetric sky in , CP sky will be perfectly anti-symmetric. This results in to be non-zero for only odd values of . In case of a broken or imperfect anti-symmetry, for even values of also get populated.
-
–
In smaller scale, the power primarily come from turbulence and for both I and CP are relatively smooth. falls off as beyond 50 (sridhar, ). The scale dependence of is also similar to of unpolarized synchrotron because is proportional to . In the observed spectrum of synchrotron emission at 408 MHz (haslam, ) from the MW galaxy, there is more power in small scales which are mostly contributed by point sources. Since we have removed the point sources, power in small scale drops (sarkar, ).
VIII Detection Prospects
In this section, we attempt to forecast detection prospects of a cosmological signal of Stokes V in the CMB via current and future CMB experiments. Let, be the signal of interest, composed of signal from the Pop III stars, galaxy clusters or primordial sources. Therefore,
| (14) |
where is by far the highest signal among the scenarios that are reviewed in this paper. See Fig. 2 for a quick comparison. is then dominated by the contribution from . Detection prospects of the cosmological signal of interest can then be simply evaluated as
| (15) |
where
| (16) |
In Eq. (15), we use Eq. (7) of decp to evaluate . The galactic foreground contribution, is primarily due to intrinsically circularly polarized GSE. The calculation for is described in Sec. VII.2 and Sec. IV.1-IV.2. The galactic signal may also include the mesospheric oxygen signal described in Sec. V. However, we have ignored the mesospheric oxygen signal (of CP) due to its limitation to only the largest scales. We have also set angular power, , coming from the extragalactic sources (that are not included in the signal of interest in Eq. (15)) to be zero. Angular power related to instrumental noise, is given by the following.
| (17) |
where, (in K/K)(in radian)TCMB. An important quantity, the resolution-per-pixel, is defined using given in Eq. (17) such that =. Full width at half maximum of the Gaussian beam is denoted by . Resolution-per-pixel is related to the detector noise-equivalent temperature, and total observation time, in the following manner.
| (18) |
where is in the units of K(sec)1/2 and is in seconds. The Eq. (18) follows from the following. The area covered by each pixel is . Time required to get a resolution-per-pixel of with a detector noise-equivalent temperature of is . Therefore, within a given observing time of , number of pixels covered will be Npix=. Therefore, the fraction of sky area covered by the pixels is .
Goal spatial resolution depends on the type of the telescope used. Generally, in arc min units is given by,
| (19) |
where D(m) is the diameter of the telescope in meters and is the frequency of CMB observation in GHz. One can therefore use a 10m telescope at 10 GHz to obtain a resolution of 18 arcmin. It is easier to find dedicated observing time in smaller telescopes than the larger ones.
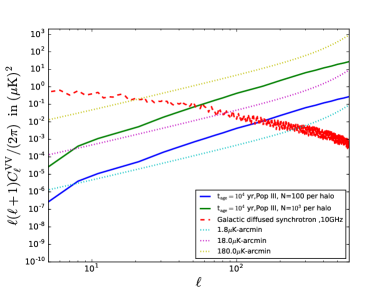
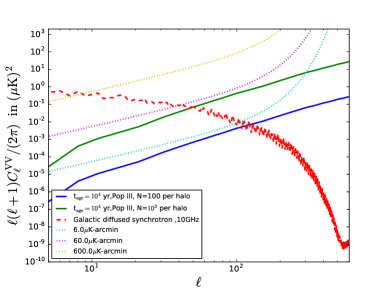
In Fig. 9 we plot different competing factors, such as the signal, noise and foregrounds for two different beam resolutions, 18 arcmin (left panel) and 1 (right panel). Resolution-per-pixel in each case is considered to be at three different values, 0.1, 1 and 10 in the units of K.
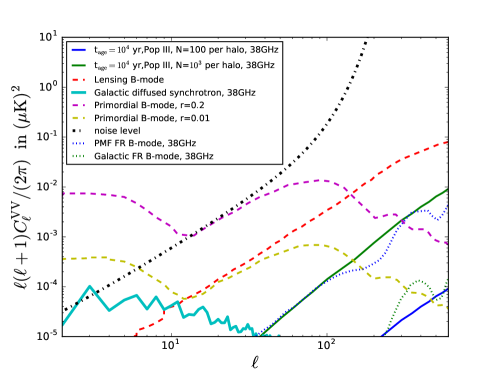
We plot comparison between both frequency dependent (FR related) and frequency independent (lensing and primordial gravitational waves) B-modes along with FC generated CP and CP due to the GSE in Fig. 10. In this case the results were presented at =40 GHz due to its immediate relevance to the CLASS telescope. Please note that the angular power in galactic CP will be down by a factor of (40/220)6.8 10-5 at the frequency (220 GHz) relevant to the PIPER telescope. The angular power in cosmological CP due to the Pop III stars will be down by a factor of (40/220)6 510-5 at 220 GHz. Its important to note that, the galactic CP will be an important factor to consider while probing B-modes for lower values of tensor-to-scalar ratio, . In probing B-modes, galactic CP is a serious effect to consider over large scales while in smaller scales other effects such as the FR due to the galaxy and cosmological CP could be more important. However, detectability in smaller scales is limited by thermal noise of the detector for both cosmological CP and B-modes.
 |
 |
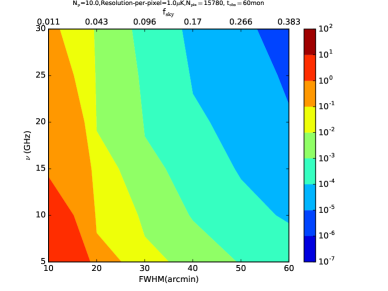
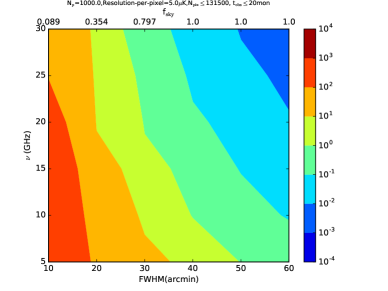
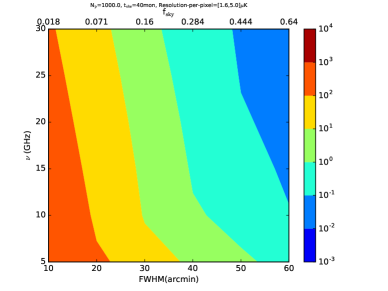
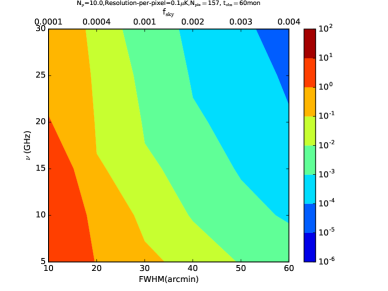
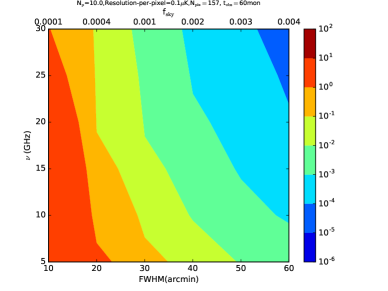
In Fig. 11 and Fig. 12 we present S/N estimates for the detection of the Pop III stars as frequency and beam resolution are varied. We consider different values of number of Pop III stars per halo as Np=1-1000. The main observations from the S/N estimates are the following.
-
–
S/N is significantly higher than unity for NP 100.
-
–
S/N increases with decreasing frequency and beam width.
-
–
If Np=1, S/N of higher than unity is generally not expected at any beam resolution within the frequency range of 5-30 GHz.
-
–
If Np 10, a S/N higher than unity is expected with an appropriate choice of frequency and beam resolution.
-
–
If Np 100, a S/N significantly higher than unity is expected with an observing time of 20 months or less. In this case, the choice of frequency and FWHM of the beam is more relaxed. For example, if Np =1000, a S/N higher than unity can be achieved with FWHM up to 40’ and frequency of up to 50 GHz.
 |
Some typical scenarios for observing CP involve the following. If Np 100, a S/N significantly higher than unity is achievable using a 10m telescope at 10 GHz at 40 months of observing time. If Np 10, a S/N higher than unity is achievable using a 10m telescope at 10 GHz at 60 months of observing time.
Note, that the signal of interest in our case is composed of the primordial, Pop III star related and galaxy cluster related CP signals. However, Pop III related CP signal is much higher (See Fig. 2) and dominates other sources of CP signals of interest. For example, S/N for solely observing the CP signal from the galaxy clusters is much less than unity with the most optimal beam resolution and low frequency. Therefore, a S/N higher than unity will most certainly imply the presence of CP signal induced by the Pop III stars.
 |
 |
 |
 |
 |
 |
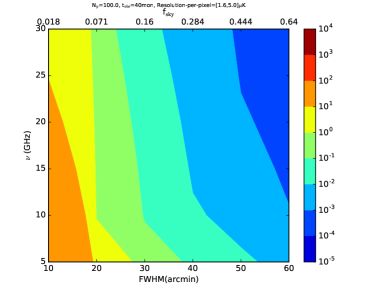
In Fig. 13 improvements in S/N due to partial removal of the galaxy is considered. Partial removal of the galaxy is achieved using a factor, , using which angular power due to galactic CP in Eq. (15) is modified as . Partial removal of the galactic effects extends the detectability prospects to higher frequencies, especially for lower values of . Finally, the detectability remain limited by the thermal noise of the detector.
 |
 |
IX Discussion
In this paper we have evaluated S/N for the detection of cosmologically important CP signals in the CMB. Frequency range of observation was chosen to be 5-30 GHz. The lower limit of 5 GHz in the frequency range of interest is chosen to avoid irregularities in the synchrotron spectra due to extra-galactic self-absorbing sources. Additionally, treatment of CP in lower frequencies need a full solution of the polarization transfer equation in many scenarios (huang, ). An upper limit of 30 GHz is chosen due to sharp fall off of the CP signal with increasing frequency.
Our work follows from decp who showed that Pop III stars could induce a CP signal in the CMB. In addition to the Pop III signal, CP signal induced in the CMB due to the galaxy clusters and other primordial sources, such as the primordial magnetic field or symmetry breaking mechanisms, were also considered. Of all the cosmologically important sources of CP discussed in this paper, CP due to the Pop III stars dominate with a significantly higher signal in the frequency range of interest. A detailed description of the mechanisms that produce CP in various sources are discussed in Sec. III and Sec. II. CP in the CMB is produced by the Pop III stars via the FC mechanism which transforms an incoming linear polarization into circular polarization in presence of an external magnetic field.
An important foreground to the CP observation is the galactic CP due to the GSE, which is naturally (intrinsically) circularly polarized. We evaluate the signal level of the CP generated from the GSE using numerical simulations generated by the HAMMURABI code where we have implemented the calculation of Stokes V (component corresponding to CP) following Eq. (7).
The goal frequency of observation is in the 5-30 GHz range which is chosen due to the reasons described earlier in this section. There is not much known about the mass and other properties of the Pop III stars. If the number of Pop III stars per halo is as high as 1000, then observations at higher frequency (of up to 50 GHz) could lead to a S/N higher than unity.
The final result of our work is summarized in Fig. (11-13). A S/N significantly higher than unity is achievable if Np 100. Generally, a S/N higher than unity is accessible if Np 10, with an appropriately chosen frequency of observation and beam resolution. Under the most optimistic scenario (for example, Np=1000), a S/N higher than unity is accessible at =50 GHz with beam resolution of up to 40’. Under the least optimistic scenario, when Np=1, we do not expect a S/N higher than unity.
Limitations of our results come from the current status of the GMF models. Our results for the galactic foreground in CP is based on numerical simulations which are partially driven by galactic synchrotron and low frequency CMB data. The GMF models considered in this paper are compared with Haslam data (408 MHz map), low frequency CMB data from Planck and WMAP satellites. However, the resolution of these datasets are at best 40’-1, limiting our knowledge of the GMF at smaller scales. Maps of Stokes V presented in this paper depend on the GMF models we have adopted, which need to be improved to produce the accurate maps of the GSE which match the observations more closely. This will also improve the Stokes V maps. Finally, there is no observed maps of the galactic CP. An all-sky map of the observed galactic CP will reveal the nature of the GMF in greater detail, verify the theoretical predictions on CP from the polarization transfer equations and yield foregrounds levels to the measurements of the cosmic CP.
A low frequency measurement of the cosmic CP in the CMB can reveal information about the Pop III stars, early universe symmetry breaking or new physics, galaxy clusters or even the primordial magnetic field. The signal from the Pop III stars are particularly interesting due to their expected high signal level and consequently, significantly high S/N. Observing CP in the CMB will be an indirect probe of the Pop III stars which are highly significant as the first formed structures since the cosmic dark ages and seeds of reionization of the universe. Not much is known about the Pop III stars currently. Direct observation of these high redshift objects (z 15) are generally beyond the reach of future telescopes like the JWST. Observing the CP induced in the CMB provides a much economical way of learning about the existence and nature of the Pop III stars, which can even be realized in the immediate future. With the current status of instrumentation, observing CP of the CMB provides the highest promise in probing the Pop III stars. If the instrumentation is improved in the near future, new physics related signal can also be explored which currently remains far out of the reach of the highly expensive modern day accelerators.
Finally, an immediate practical significance of this work is towards the cosmic B-mode exploration. This applies to the telescopes that are now being built and propose to explore primordial B-modes using VPM techniques. The observing strategy relies on using CP as a systematics rejections channel. This work points out that the galactic CP effects are important in large scales, especially for frequencies below 50 GHz.
Acknowledgements
We thank Hiroyuki Tashiro for important discussions and suggestions as well for a previous collaboration which inspired the current work. We thank Tess Jaffe for her help with the HAMMURABI code. We thank Ari Kaplan for discussions on Planck sky models simulations used to compare with some of the HAMMURABI results. We thank the anonymous referee for an insightful and encouraging review.
References
- (1) Jones, T. W., & Odell, S. L. 1977, Astrophys. J. , 214, 522
- (2) Penzias, A. A., & Wilson, R. W. 1965, Astrophys. J. , 142, 419
- (3) Dicke, R. H., Peebles, P. J. E., Roll, P. G., & Wilkinson, D. T. 1965, Astrophys. J. , 142, 414
- (4) Smoot, G. F., Bennett, C. L., Kogut, A., et al. 1992, Astrophys. J., Lett., 396, L1
- (5) Kovac, J. M., Leitch, E. M., Pryke, C., Carlstrom, J. E., Halverson, N. W., & Holzapfel, W. L. 2002, Nature (London), 420, 772
- (6) Bennett, C. L., Larson, D., Weiland, J. L., et al. 2013, Astrophys. J., Suppl., 208, 20
- (7) Planck Collaboration, Adam, R., Ade, P. A. R., et al. 2015, arXiv:1502.01582
- (8) Sievers, J. L., Hlozek, R. A., Nolta, M. R., et al. 2013, JCAP, 10, 060
- (9) Reichardt, C. L., Shaw, L., Zahn, O., et al. 2012, Astrophys. J. , 755, 70
- (10) BICEP2 and Keck Array Collaborations, Ade, P. A. R., Ahmed, Z., et al. 2015, Astrophys. J. , 811, 126
- (11) Ade, P. A. R., Akiba, Y., Anthony, A. E., et al. 2014, Physical Review Letters, 113, 021301
- (12) QUIET Collaboration, Araujo, D., Bischoff, C., et al. 2012, Astrophys. J. , 760, 145
- (13) Hanson, D., Hoover, S., Crites, A., et al. 2013, Physical Review Letters, 111, 141301
- (14) van Engelen, A., Sherwin, B. D., Sehgal, N., et al. 2015, Astrophys. J. , 808, 7
- (15) Bond, J. R., Jaffe, A. H., & Knox, L. 1998, Phys. Rev. D, 57, 2117
- (16) Mainini, R., Minelli, D., Gervasi, M., Boella, G., Sironi, G., Baú, A., Banfi, S., Passerini, A., De Lucia, A., & Cavaliere, F. 2013, JCAP, 8, 33
- (17) Lubin, P. M., & Smoot, G. F. 1981, Astrophys. J. , 245, 1
- (18) Essinger-Hileman, T., Ali, A., Amiri, M., et al. 2014, Proc. SPIE, 9153, 91531I
- (19) Lazear, J., Ade, P. A. R., Benford, D., et al. 2014, Proc. SPIE, 9153, 91531L
- (20) Sazonov, V. N. 1972, Astrophysics and Space Science, 19, 25
- (21) Legg, M. P. C., & Westfold, K. C. 1968, Astrophys. J. , 154, 499
- (22) Enßlin, T. A. 2003, Astron. Astrophys., 401, 499
- (23) Giovannini, M. 2009, Phys. Rev. D, 80, 123013
- (24) Zarei, M., Bavarsad, E., Haghighat, M., Mohammadi, R., Motie, I., & Rezaei, Z. 2010, Phys. Rev. D, 81, 084035
- (25) Aschieri, P., Jurčo, B., Schupp, P., & Wess, J. 2003, Nuclear Physics B, 651, 45
- (26) Schaposnik, F. A. 2004, ArXiv High Energy Physics - Theory e-prints
- (27) Mohammadi, R. 2013, arXiv:1312.2199
- (28) Colladay, D., & Kostelecký, V. A. 1998, Phys. Rev. D, 58, 116002
- (29) Bromm, V. 2013, Reports on Progress in Physics, 76, 112901
- (30) Schaerer, D. 2002, in Astrophysics and Space Science Library, Vol. 274, New Quests in Stellar Astrophysics: the Link Between Stars and Cosmology, ed. M. Chávez, A. Bressan, A. Buzzoni, & D. Mayya, 185–188
- (31) De, S., & Tashiro, H. 2015, Phys. Rev. D, 92, 123506
- (32) Bromm, V., & Larson, R. B. 2004, Ann. Rev. Astron. Astrophys., 42, 79
- (33) Whalen, D. J. 2013, Acta Polytechnica, 53, 573
- (34) Gardner, J. P., Mather, J. C., Clampin, M., et al. 2006, Space Sci. Rev., 123, 485
- (35) Whalen, D. J., Even, W., Frey, L. H., et al. 2013, Astrophys. J. , 777, 110
- (36) Smidt, J., Whalen, D. J., Wiggins, B. K., et al. 2014, Astrophys. J. , 797, 97
- (37) Abel, T., Bryan, G. L., & Norman, M. L. 2002, Science, 295, 93
- (38) Johnson, J. L., Whalen, D. J., Even, W., et al. 2013, Astrophys. J. , 775, 107
- (39) Cooray, A., Melchiorri, A., & Silk, J. 2003, Physics Letters B, 554, 1
- (40) Beckert, T., & Falcke, H. 2002, Astron. Astrophys., 388, 1106
- (41) Kosowsky, A. 1996, Annals of Physics, 246, 49
- (42) Weinberg, S. 2008, Cosmology, by Steven Weinberg. ISBN 978-0-19-852682-7. Published by Oxford University Press, Oxford, UK, 2008.
- (43) De, S., Pogosian, L., & Vachaspati, T. 2013, Phys. Rev. D, 88, 063527
- (44) Planck Collaboration, Adam, R., Aghanim, N., et al. 2016, arXiv:1605.03507
- (45) Bromm, V., & Yoshida, N. 2011, Ann. Rev. Astron. Astrophys., 49, 373
- (46) Dunlop, J. S., Rogers, A. B., McLure, R. J., et al. 2013, Mon. Not. Roy. Astron. Soc., 432, 3520
- (47) Barkana, R., & Loeb, A. 2001, Phys. Rep., 349, 125
- (48) Haiman, Z. 1998, Ph.D. Thesis, 2246
- (49) Oh, S. P., Cooray, A., & Kamionkowski, M. 2003, Mon. Not. Roy. Astron. Soc., 342, L20
- (50) Madau, P., & Rees, M. J. 2001, Astrophys. J., Lett., 551, L27
- (51) Suwa, Y., Takiwaki, T., Kotake, K., & Sato, K. 2008, First Stars III, 990, 142
- (52) Frebel, A., Aoki, W., Christlieb, N., et al. 2005, Nature (London), 434, 871
- (53) Tumlinson, J., Venkatesan, A., & Shull, J. M. 2004, Astrophys. J. , 612, 602
- (54) Greif, T. H., Glover, S. C. O., Bromm, V., & Klessen, R. S. 2010, Astrophys. J. , 716, 510
- (55) Wyithe, J. S. B., & Loeb, A. 2003, Astrophys. J., Lett., 588, L69
- (56) Meiksin, A., & Whalen, D. J. 2013, Mon. Not. Roy. Astron. Soc., 430, 2854
- (57) Xu, H., Wise, J. H., & Norman, M. L. 2013, Astrophys. J. , 773, 83
- (58) Grasso, D., & Rubinstein, H. R. 2001, Phys. Rep., 348, 163
- (59) Durrer, R., & Neronov, A. 2013, Astron. Astrophys. Rev., 21, 62
- (60) Planck Collaboration, Ade, P. A. R., Aghanim, N., et al. 2015, arXiv:1502.01594
- (61) Cowsik, R., & Mitteldorf, J. 1974, Astrophys. J. , 189, 51
- (62) Beck, R., & Wielebinski, R. 2013, Planets, Stars and Stellar Systems. Volume 5: Galactic Structure and Stellar Populations, 5, 641
- (63) Bennett, C. L., Hill, R. S., Hinshaw, G., et al. 2003, Astrophys. J., Suppl., 148, 97
- (64) Gold, B., Odegard, N., Weiland, J. L., et al. 2011, Astrophys. J., Suppl., 192, 15
- (65) Andrew, B. H., & Purton, C. R. 1967, Nature (London), 215, 493
- (66) Tademaru, E. 1973, Astrophys. J. , 183, 625
- (67) Planck Collaboration, Ade, P. A. R., Aghanim, N., et al. 2014, Astron. Astrophys., 571, A12
- (68) Page, L., Hinshaw, G., Komatsu, E., et al. 2007, Astrophys. J., Suppl., 170, 335
- (69) Strong, A. W., Moskalenko, I. V., & Reimer, O. 2004, Astrophys. J. , 613, 962
- (70) Smoot, G. F. 1999, arXiv:astro-ph/9902201
- (71) Hanany, S., & Rosenkranz, P. 2003, New Astron. Rev., 47, 1159
- (72) Waelkens, A., Jaffe, T., Reinecke, M., Kitaura, F. S., & Enßlin, T. A. 2009, Astron. Astrophys., 495, 697
- (73) Górski, K. M., Hivon, E., Banday, A. J., et al. 2005, Astrophys. J. , 622, 759
- (74) Sun, X. H., Reich, W., Waelkens, A., & Enßlin, T. A. 2008, Astron. Astrophys., 477, 573
- (75) Han, J. L., Ferriere, K., & Manchester, R. N. 2004, Astrophys. J. , 610, 820
- (76) Cordes, J. M., & Lazio, T. J. W. 2002, arXiv:astro-ph/0207156
- (77) Haslam, C. G. T., Salter, C. J., Stoffel, H., & Wilson, W. E. 1982, Astron. Astrophys., Suppl., 47, 1
- (78) Remazeilles, M., Dickinson, C., Banday, A. J., Bigot-Sazy, M.-A., & Ghosh, T. 2015, Mon. Not. Roy. Astron. Soc., 451, 4311
- (79) Delabrouille, J., Betoule, M., Melin, J.-B., et al. 2013, Astron. Astrophys., 553, A96
- (80) Mertsch, P., & Sarkar, S. 2013, JCAP, 6, 041
- (81) Goldreich, P., & Sridhar, S. 1997, Astrophys. J. , 485, 680
- (82) Huang, L., Liu, S., Shen, Z.-Q., Cai, M. J., Li, H., & Fryer, C. L. 2008, Astrophys. J., Lett., 676, L119