The role of cosmic ray pressure in accelerating galactic outflows
Abstract
We study the formation of galactic outflows from supernova explosions (SNe) with the moving-mesh code AREPO in a stratified column of gas with a surface density similar to the Milky Way disk at the solar circle. We compare different simulation models for SNe placement and energy feedback, including cosmic rays (CR), and find that models that place SNe in dense gas and account for CR diffusion are able to drive outflows with similar mass loading as obtained from a random placement of SNe with no CRs. Despite this similarity, CR-driven outflows differ in several other key properties including their overall clumpiness and velocity. Moreover, the forces driving these outflows originate in different sources of pressure, with the CR diffusion model relying on non-thermal pressure gradients to create an outflow driven by internal pressure and the random-placement model depending on kinetic pressure gradients to propel a ballistic outflow. CRs therefore appear to be non-negligible physics in the formation of outflows from the interstellar medium.
1 Introduction
Stellar feedback plays a critical role in galaxy- and star-formation through its regulation of the interstellar medium (ISM) (Joung et al., 2009; Walch et al., 2015; Martizzi et al., 2016; Girichidis et al., 2016b) and the powering of galactic winds (Hopkins et al., 2014; Marinacci et al., 2014; Vogelsberger et al., 2014; Schaye et al., 2015). The sources of stellar feedback are varied and impart different types of energy on different timescales, and in different environments (e.g. Agertz et al., 2013). SNe are a particularly important feedback source, and their energy likely combines with other stellar feedback effects (e.g. UV radiation from young stars) in a non-linear way to impact the ISM (Geen et al., 2015).
The acceleration of CRs at shock fronts in supernova remnants is a potentially crucial aspect of SNe feedback. Observations of local SNe remnants suggest that of order 10% of the explosion energy is converted to CRs (Helder et al., 2012; Morlino & Caprioli, 2012; Ackermann et al., 2013). CR energy, once created, does not dissipate quickly, in contrast to cooling processes that operate for thermal energy. In addition, CRs are transported through both advection and diffusion processes. The diffusion process in particular has the ability to transport significant amounts of CR energy independent of bulk gas motions to distances far from CR acceleration sites, thereby creating potentially significant pressure imbalances that can drive large-scale gas flows.
Previous work has already demonstrated the impact of CRs in isolated and cosmological simulations of galaxies (Jubelgas et al., 2008; Uhlig et al., 2012; Booth et al., 2013; Salem & Bryan, 2014; Salem et al., 2014; Pakmor et al., 2016b) and in simulations of the ISM (Peters et al., 2015; Girichidis et al., 2016a). The goal of this letter is to investigate how CRs from SNe accelerate galactic outflows, and whether diffusion of these CRs represents the critical physical effect that explains galactic outflows in a regime where the star formation rate (SFR) is local and varying and SNe take place in dense gas. To this end, we test a variety of SNe feedback and CR transport models, combined with low-temperature cooling and a self-consistent multiphase ISM treatment that goes beyond the subgrid model used in previous galactic studies of CRs with AREPO (Pakmor et al., 2016b).
2 Simulation Setup
We simulate a tall column of stratified gas intended to represent a small portion of a galactic disk. The domain dimensions are 1 kpc 1 kpc 10 kpc. We impose periodic boundaries along the two short axes and outflow boundaries along the long axis. Gas starts the simulation in hydrostatic equilibrium with a temperature of K.
Gravitational forces are computed both from gas self-gravity using a tree-based algorithm with mixed periodic/non-periodic boundary conditions and a constant softening length of pc; and from an analytic potential representing the pre-existing stellar density at startup. We assume this fixed stellar density field is proportional to the initial gas density for an assumed gas fraction of via Poisson’s equation in a manner analogous to the method of Creasey et al. (2013): .
The initial gas density varies with vertical height above the box mid-plane along the long axis, also following the setup of Creasey et al. (2013):
| (1) |
where is the initial gas surface density and is the initial isothermal scale height. We choose M⊙ pc-2 and , which results in pc. The initial gas density of cells above 4.4 kpc is limited to a minimum value of M⊙ pc-3. Galactic shearing effects are neglected.
Hydrodynamics is computed to second order with the moving-mesh code AREPO (Springel, 2010; Pakmor et al., 2016c). AREPO yields a quasi-Lagrangian solution to the ideal hydrodynamic equations that captures shocks and discontinuities well. We assume a thermal adiabatic index of and impose an effective pressure floor in the Riemann solver equal to times the Jeans pressure at the minimum allowed cell diameter to provide pressure support in under-resolved dense gas (Machacek et al., 2001). A minimum allowed temperature of 5 K is adopted.
Initially, the simulated volume is divided into gas cells, concentrated in the mid-plane, but also comprising a Cartesian background mesh with a cell length of 43.5 pc up to 1 kpc and of 90.9 pc beyond. Refinement and derefinement of the mesh is applied to maintain roughly constant cell masses to within a factor of two of the target gas mass of 10 M⊙, subject to the constraints that cell volumes are limited to between 2.93 pc3 and pc3; a maximum volume ratio of 10 between adjacent cells is maintained; and cell diameters are required to be no larger than of the Jeans length.
We use the chemistry and cooling network implemented by Smith et al. (2014). This model solves hydrogen chemistry, including H2 (Glover & Mac Low, 2007a, b), and has a simple treatment for CO chemistry (Nelson & Langer, 1997; Glover & Clark, 2012). We assume the same species abundances for carbon, oxygen, helium, and dust as used by Smith et al. (2014) and the same initial ionization fractions and uniform interstellar radiation field as used in their fiducial model. Gas self-shielding and dust shielding are accounted for using the TreeCol algorithm (Clark et al., 2012). Metal cooling of high-temperature gas assuming collisional ionization equilibrium is also included (Gnat & Ferland, 2012; Walch et al., 2015) assuming a constant solar gas metallicity.
In most simulations, we include ideal magnetohydrodynamics (MHD) computed with a Powell cleaning scheme (Pakmor et al., 2011) for divergence control. We use an initial seed field with a strength of , oriented parallel to the disk plane. In a subset of our simulations, CRs are followed with a two fluid approximation, assuming an adiabatic index of and including a CR cooling model that dissipates CR energy through Coulomb and hadronic processes (Pfrommer et al., 2016).
3 Tested Models
We investigate several models for supernova feedback and galactic wind acceleration. In all models, SNe are modeled as discrete explosions of erg deposited into the 32 closest cells to the explosion position. Explosion events are only added to the mesh when all gas cells are synchronized; the maximum allowed timestep is 0.1 Myr. SNe are injected stochastically, assuming a rate of 1.8 SNe per 100 M⊙ of newly formed stars. SNe energy is split between three energetic channels: thermal, kinetic, and CR. The six models explored are as follows:
-
•
In NOCR, all SNe energy is thermal and distributed over the explosion cells proportional to each cell’s volume. Sites for SNe are chosen probabilistically, with a local SFR computed for each cell from the local free-fall time, which depends on the cell’s total baryon density : . It also depends on the cell mass and a star formation efficiency , which we assume to be 0.01, yielding the cell’s SFR:
(2) The probability of a SNe at the cell’s position in a timestep is then computed as
(3) -
•
KE30 is identical to NOCR in the selection of SNe sites, with the only difference being that 30% of the SNe energy is added in kinetic form. Explosion cells are given momenta directed radially away from the central cell analogous to the method of Simpson et al. (2015).
-
•
CRAV is again identical to NOCR and differs only in that 10% of the SNe energy is put into CR energy. The remaining 90% is added as thermal energy. The CR energy can advect with the gas but no other CR transport mechanism is included.
-
•
CRID is the same as CRAV, except that this model includes the additional CR transport mechanism of isotropic diffusion, as described by Pakmor et al. (2016a). A diffusion coefficient of cm2 s-1 is used.
-
•
CRAD is also identical to CRAV, but it includes anisotropic instead of isotropic CR diffusion (Pakmor et al., 2016a). The diffusion coefficient in this model is cm2 s-1 parallel to the magnetic field and zero in all transverse directions.
-
•
RAND differs from all the other models in the way the locations of SNe are chosen. Rather than computing a local SFR for each cell, a global SFR for the entire volume is calculated from the gas column density according to the empirical Kennicutt star-formation relation (Kennicutt, 1998). As mass is lost from the volume, the SFR is adjusted to the new gas column density. The locations of SNe explosions are randomly distributed, uniformly in the plane parallel to the disk and following the functional form of Eqn. (1) in the vertical direction. The scale height of the latter distribution is varied according to the current height containing half the initial mass of the box, . RAND is intended to test a mode of wind generation that does not rely on CR effects, but rather on decoupling SNe locations from dense gas in a ‘random-driving’ scenario. To this end, all SNe are purely thermal, and this model does not include MHD.
4 Summary of Results
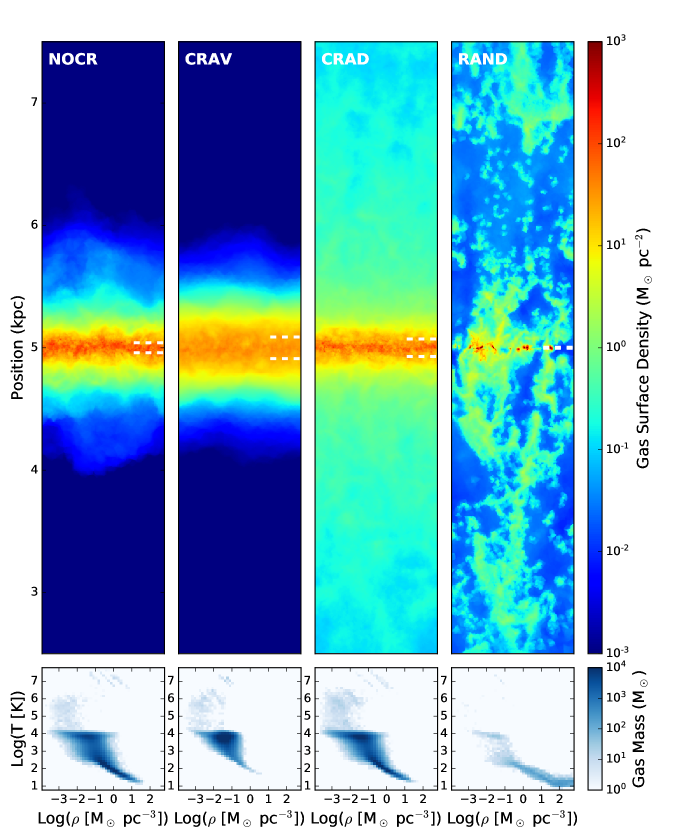
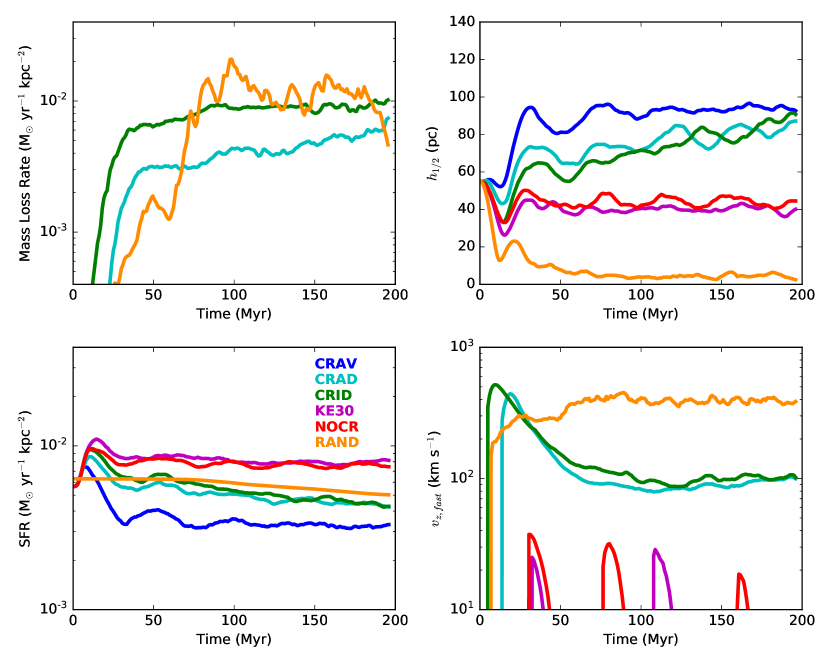
A comparison of the gas density distribution after 100 Myr of evolution, shown in Figure 1, immediately reveals significant differences between several of our tested models. The disk scale heights, mid-plane density structures, and extended gas distributions are all visually distinct and demonstrate key variations in model behavior. In addition, the phase-space distributions of gas within the mid-plane (bottom panels of Figure 1) reflect the ability, or inability, of each model to regulate the supply of dense gas. These differences also appear in the time evolution of global properties such as mass loss, SFR, and disk scale height, displayed in Figure 2.
In the simplest scenario tested, NOCR, where SNe are modeled as purely thermal energy injection events, the mid-plane gas quickly becomes a turbulent, multi-phase medium that maintains a scale height slightly below its initial value. Little material in this model reaches more than a few hundred parsecs above the mid-plane. Gas in the mid-plane becomes denser on average due to cooling, causing an overall SFR increase. However, the density increase is limited and regulated by SNe, which are preferentially injected into dense regions.
In KE30, we explore the effect of directly injecting 30% of the SNe energy in kinetic form. This model produces only small differences relative to NOCR, as shown in Figure 2. There appears to be a small enhancement in the availability of dense gas in KE30, but the overall similarity between these two models can be understood as being primarily due to the high simulation resolution, allowing the purely thermal model of NOCR to closely capture the Sedov-Taylor phase of SNe remnants, as discussed in Simpson et al. (2015).
Allowing the addition of CRs in SNe changes this picture significantly. First, without diffusion (model CRAV), CRs have a significant impact on the mid-plane gas structure. The non-thermal pressure contributed by CRs suppresses the formation of dense gas and increases the disk scale height. This results in a lower SFR. However, the new reservoir of non-thermal pressure is not sufficient by itself to accelerate material to significant heights above the mid-plane.
Adding CR diffusion, as in CRAD and CRID, alters the influence of CRs dramatically. In these models, gas is driven from the ISM to significant heights above the mid-plane, yielding mass loss rates comparable to the SFR. The type of diffusion also plays a role in the overall evolution. The onset of diffusion-generated outflows in CRAD is delayed relative to CRID, and the outflows are generally weaker. Early in CRAD diffusion is less efficient in transporting CR energy away from the mid-plane because of the initial orientation of the magnetic field parallel to the mid-plane. This temporarily results in the trapping of CR energy in the mid-plane, producing a higher scale height and lower SFR, until the magnetic field reorients. At late times, CRAD evolves much more like CRID, indicating that ISM turbulence has accomplished this and CRs are now able to escape the mid-plane.
Aside from the CR diffusion models, the only other scenario that produces robust outflows is the RAND model. The nature of outflows between the CR diffusion models and RAND is quite different. Figure 1 shows the clumpy nature of gas above the mid-plane in RAND, contrasting with the much smoother flow in CRAD. The outflows produced are also faster. The mass loss rate of RAND is similar to CRID, but the SFR is larger, yielding a somewhat smaller mass loading of the outflow. The mid-plane ISM in RAND undergoes a thermal runaway, where the mid-plane gas becomes maximally porous as most of the mass collapses into small, dense clumps, also seen in Figure 1. The disk scale height equilibrates to approximately four times the minimum allowed cell diameter, implicating the imposed pressure floor as the main disk-support in RAND.
5 Discussion
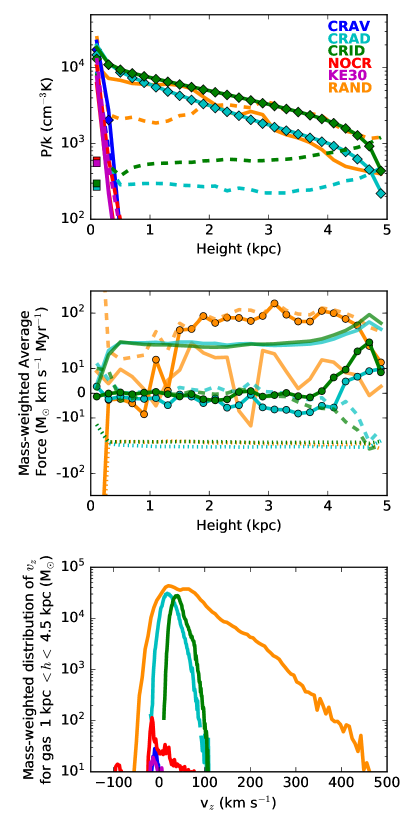
Three of our tested models, CRID, CRAD, and RAND, have demonstrated the ability to accelerate significant amounts of gas several kpc above the mid-plane. While the outflows in these models have similar mass loading factors, as revealed by Figure 2, the physical mechanisms driving these flows are quite different. In fact, the simulations exhibit two distinct modes of wind generation: a ‘pressure-driven wind’ and a ‘ballistic wind’. Figure 3 shows that CRID, CRAD, and RAND are the only models that have significant internal gas pressure at heights above 1 kpc from the mid-plane. The internal pressure of cell is defined as
| (4) |
where is the gas density, is the specific internal thermal energy, is the specific CR energy, and is the magnetic field strength. In CRID and CRAD, the total pressure is dominated by the CR pressure term, . In RAND, however, internal pressure only dominates up to a height of 2 kpc; beyond this, the kinetic ram pressure, , begins to dominate ( is the gas speed). The magnetic pressure, , is subdominant in all models above the disk.
How do these pressures drive gas? We consider the forces acting on the gas in the vertical direction to explore this question. These forces are in effect the terms from the momentum-conservation equation. They include the gravitational force:
| (5) |
where is the cell gravitational acceleration; the internal pressure force:
| (6) |
where is the cell volume; and the kinetic force:
| (7) |
Figure 3 shows the average force acting on the gas versus height. In RAND, the total force is dominated by the gravitational force within the disk, and by the kinetic force above the disk. By comparison, the internal pressure force is not as significant and alternates between positive and negative values with height, likely reflecting the clumpy nature of the outflow. In CRID and CRAD, the kinetic force is very small in magnitude at most heights. In contrast, the internal pressure and gravitational forces are more significant and of similar magnitude, but of opposite sign. The gravitational force dominates on average, but as is seen in the distribution of gas velocities, this does not prevent individual gas elements from reaching high outflowing velocities, sustaining a nearly constant mass loss rate from the box over time.
We note that the outflows described here are unlikely to reach wind velocities large enough to be unbound from the galaxy. The Milky Way escape velocity at the solar circle probably exceeds 500 km s-1 (Smith et al., 2007). In addition, extrapolations from recent UV observations of local star-bursting galaxies suggest that for the SFR surface densities simulated here, outflow velocities rarely exceed 50 km s-1 (Heckman & Borthakur, 2016). CRID and CRAD sustain significant amounts of outflowing gas with velocities111The quoted outflow velocities for CRID and CRAD exclude gas within 500 pc of the outflow boundaries because the CR energy of mirrored ghost cells beyond these boundaries is fixed to be zero. This gives spurious CR pressure gradients at the boundary. above 50 km s-1, but propel very little gas mass above 100 km s-1. Similarly, RAND does produce significant amounts of gas above 50 km s-1, but little above 500 km s-1. The ‘outflows’ simulated here are therefore more accurately characterized as galactic fountain flows, which is also consistent with the significant amounts of gas above 1 kpc that have inflowing velocities in both CRAD and RAND, as shown in Figure 3.
It is remarkable that the CR diffusion models, despite their placement of SNe in dense gas, produce winds of comparable mass loading to the ‘random-driving’ scenario of RAND. The physical motivation for the latter is to account for plausibly lower SNe background densities, due to ionized H II regions around young stars or to ‘run-away’ stars that move significant distances from their birth clouds before SNe can occur. Global galaxy simulations suggest that in the absence of CRs this effect may significantly impact galaxy properties (Rosdahl et al., 2015). How these effects would alter the dichotomy presented here between ‘pressure-driven’ and ‘ballistic’ winds, and alter the outflows of the CR diffusion models, will be a topic of future investigation.
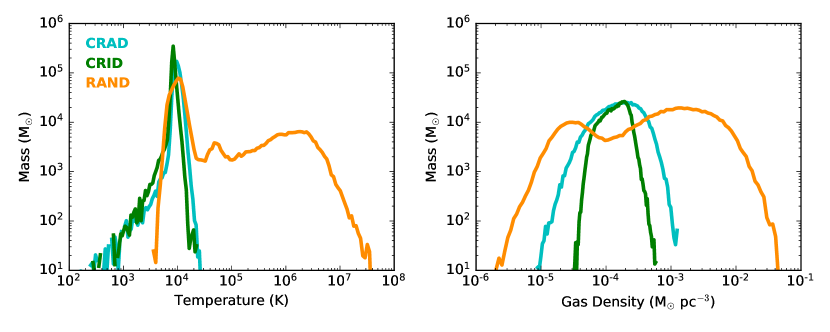
Our results are consistent with those of Girichidis et al. (2016a) and Peters et al. (2015) who also explored the role of anisotropic CR diffusion on galactic outflows launched from the ISM. Both studies assumed a constant SFR and constant fractions of randomly-placed and clustered SNe. Despite the different model for SNe placement, Girichidis et al. (2016a) found similar outflow velocities, suggesting that in this regime, CR diffusion may indeed be the dominant physical effect driving outflows. However, Peters et al. (2015) demonstrated that the inclusion of self-gravity altered wind properties, suggesting some mediating role for other physical effects. Both studies found that CR-driven outflows were colder and denser than thermally-driven outflows. Figure 4 shows that the outflows in RAND have two components: a hot, diffuse component, comprised of the high-velocity gas; and a slower, K-component, denser than CR-driven outflows of similar temperature. The adaptive nature of our mesh also gives better resolution in outflowing gas and may allow better resolution of density peaks in irregular flows.
The complex outflow in RAND is likely more sensitive to model assumptions such as the rate and placement of SNe than the CR-driven outflows. A higher value for the global SNe rate could produce faster winds in RAND, but the value adopted for this rate is already greater than 100 SNe Myr-1, motivated by the Chabrier IMF and extending the mass range for core-collapse SNe-producing stars down to 6 M⊙ (Creasey et al., 2013). RAND should be considered an upper limit to the outflow-efficiency of purely-random thermal feedback. We will also note that these models when applied to higher gas surface densities found in starbursting systems or in galactic centers may produce faster outflows, possibly exceeding galactic escape velocities.
Our models lack several effects potentially important for modeling CR-driven outflows. CR streaming, not included here, may modify CR-driven outflows (Ruszkowski et al., 2016) by possibly altering CR fluxes and heating thermal gas through the excitation of Alfvén waves (Uhlig et al., 2012). Galactic shear may also be important, because of its impact on the magnetic field orientation and therefore on the diffusivity of CRs in our anisotropic scheme. Our lack of an ordered, disk-parallel magnetic field in energy equipartition with the thermal gas may also impact the formation of this instability (Parker, 1966), however, our small horizontal box width (1 kpc) may limit the fastest-growing modes of the Parker instability that typically have wavelengths close to this value (Giz & Shu, 1993; Rodrigues et al., 2016).
In conclusion, the models presented here underline the importance of CR physics for driving galactic outflows. A full understanding of the impact of these outflows on galaxy evolution will require self-consistent simulations on global galactic scales. The methods explored here make use of adaptive and individual timesteps, making these models more readily extendable to a variety of galactic contexts and a promising direction for our work.
References
- Ackermann et al. (2013) Ackermann, M., Ajello, M., Allafort, A., et al. 2013, Science, 339, 807
- Agertz et al. (2013) Agertz, O., Kravtsov, A. V., Leitner, S. N., & Gnedin, N. Y. 2013, ApJ, 770, 25
- Booth et al. (2013) Booth, C. M., Agertz, O., Kravtsov, A. V., & Gnedin, N. Y. 2013, ApJ, 777, L16
- Clark et al. (2012) Clark, P. C., Glover, S. C. O., & Klessen, R. S. 2012, MNRAS, 420, 745
- Creasey et al. (2013) Creasey, P., Theuns, T., & Bower, R. G. 2013, MNRAS, 429, 1922
- Geen et al. (2015) Geen, S., Rosdahl, J., Blaizot, J., Devriendt, J., & Slyz, A. 2015, MNRAS, 448, 3248
- Girichidis et al. (2016a) Girichidis, P., Naab, T., Walch, S., et al. 2016a, ApJ, 816, L19
- Girichidis et al. (2016b) Girichidis, P., Walch, S., Naab, T., et al. 2016b, MNRAS, 456, 3432
- Giz & Shu (1993) Giz, A. T., & Shu, F. H. 1993, ApJ, 404, 185
- Glover & Clark (2012) Glover, S. C. O., & Clark, P. C. 2012, MNRAS, 421, 116
- Glover & Mac Low (2007a) Glover, S. C. O., & Mac Low, M.-M. 2007a, ApJS, 169, 239
- Glover & Mac Low (2007b) —. 2007b, ApJ, 659, 1317
- Gnat & Ferland (2012) Gnat, O., & Ferland, G. J. 2012, ApJS, 199, 20
- Heckman & Borthakur (2016) Heckman, T. M., & Borthakur, S. 2016, ApJ, 822, 9
- Helder et al. (2012) Helder, E. A., Vink, J., Bykov, A. M., et al. 2012, Space Sci. Rev., 173, 369
- Hopkins et al. (2014) Hopkins, P. F., Kereš, D., Oñorbe, J., et al. 2014, MNRAS, 445, 581
- Joung et al. (2009) Joung, M. R., Mac Low, M.-M., & Bryan, G. L. 2009, ApJ, 704, 137
- Jubelgas et al. (2008) Jubelgas, M., Springel, V., Enßlin, T., & Pfrommer, C. 2008, A&A, 481, 33
- Kennicutt (1998) Kennicutt, Jr., R. C. 1998, ApJ, 498, 541
- Machacek et al. (2001) Machacek, M. E., Bryan, G. L., & Abel, T. 2001, ApJ, 548, 509
- Marinacci et al. (2014) Marinacci, F., Pakmor, R., & Springel, V. 2014, MNRAS, 437, 1750
- Martizzi et al. (2016) Martizzi, D., Fielding, D., Faucher-Giguère, C.-A., & Quataert, E. 2016, MNRAS, 459, 2311
- Morlino & Caprioli (2012) Morlino, G., & Caprioli, D. 2012, A&A, 538, A81
- Nelson & Langer (1997) Nelson, R. P., & Langer, W. D. 1997, ApJ, 482, 796
- Pakmor et al. (2011) Pakmor, R., Bauer, A., & Springel, V. 2011, MNRAS, 418, 1392
- Pakmor et al. (2016a) Pakmor, R., Pfrommer, C., Simpson, C. M., Kannan, R., & Springel, V. 2016a, ArXiv e-prints, arXiv:1604.08587
- Pakmor et al. (2016b) Pakmor, R., Pfrommer, C., Simpson, C. M., & Springel, V. 2016b, ArXiv e-prints, arXiv:1605.00643
- Pakmor et al. (2016c) Pakmor, R., Springel, V., Bauer, A., et al. 2016c, MNRAS, 455, 1134
- Parker (1966) Parker, E. N. 1966, ApJ, 145, 811
- Peters et al. (2015) Peters, T., Girichidis, P., Gatto, A., et al. 2015, ApJ, 813, L27
- Pfrommer et al. (2016) Pfrommer, C., Pakmor, R., Schaal, K., Simpson, C. M., & Springel, V. 2016, ArXiv e-prints, arXiv:1604.07399
- Rodrigues et al. (2016) Rodrigues, L. F. S., Sarson, G. R., Shukurov, A., Bushby, P. J., & Fletcher, A. 2016, ApJ, 816, 2
- Rosdahl et al. (2015) Rosdahl, J., Schaye, J., Teyssier, R., & Agertz, O. 2015, MNRAS, 451, 34
- Ruszkowski et al. (2016) Ruszkowski, M., Yang, H.-Y. K., & Zweibel, E. 2016, ArXiv e-prints, arXiv:1602.04856
- Salem & Bryan (2014) Salem, M., & Bryan, G. L. 2014, MNRAS, 437, 3312
- Salem et al. (2014) Salem, M., Bryan, G. L., & Hummels, C. 2014, ApJ, 797, L18
- Schaye et al. (2015) Schaye, J., Crain, R. A., Bower, R. G., et al. 2015, MNRAS, 446, 521
- Simpson et al. (2015) Simpson, C. M., Bryan, G. L., Hummels, C., & Ostriker, J. P. 2015, ApJ, 809, 69
- Smith et al. (2007) Smith, M. C., Ruchti, G. R., Helmi, A., et al. 2007, MNRAS, 379, 755
- Smith et al. (2014) Smith, R. J., Glover, S. C. O., Clark, P. C., Klessen, R. S., & Springel, V. 2014, MNRAS, 441, 1628
- Springel (2010) Springel, V. 2010, MNRAS, 401, 791
- Uhlig et al. (2012) Uhlig, M., Pfrommer, C., Sharma, M., et al. 2012, MNRAS, 423, 2374
- Vogelsberger et al. (2014) Vogelsberger, M., Genel, S., Springel, V., et al. 2014, Nature, 509, 177
- Walch et al. (2015) Walch, S., Girichidis, P., Naab, T., et al. 2015, MNRAS, 454, 238