Observation of four-photon absorption and determination of corresponding nonlinearities in CdS quantum dots
Abstract
Bound- and excited-state electronic nonlinearities in CdS quantum dots have been investigated by Degenerate Four-Wave Mixing (DFWM) and Z-scan techniques in the femtosecond time regime. This QD sample shows Kerr-type nonlinearity for incident beam intensity below 0.18 TW/cm2. However, further increment in intensity results in four-photon absorption (4PA) indicated by open- and closed-aperture Z-scan experiments. Comparing open-aperture Z-scan experimental results with theoretical models, the 4PA coefficient has been deduced. Furthermore, third-order nonlinear index and refractive-index change coefficient corresponding to excited-state electrons due to 4PA have been calculated from the closed-aperture Z-scan results. UV-visible absorption and photoluminescence experimental results are analyzed towards estimating band gap energy and defect state energy. Time Correlated Single Photon Counting (TCSPC) was employed to determine the decay time corresponding to band-edge and defect states. The linear and nonlinear optical techniques have allowed the direct observation of lower and higher-order electronic states in CdS quantum dots.
pacs:
00.00, 20.00, 42.10I Introduction
The physics of quantum dots (QDs) is of great scientific interest from both fundamental and application point of view. A comprehensive knowledge about nonlinear absorption and refraction processes in quasi-zero dimensional semiconductor structures or QDs is important for further development of nonlinear-optical semiconductor devices Vivas et al. (2013); Dakovski and Shan (2013); Lad et al. (2007); He et al. (2008a). Quest for knowledge about this topic can be adequately addressed by nonlinear optical experimental techniques, such as Z-scan Yoshino et al. (2003); Sheik-Bahae et al. (1990); Said et al. (1992); Wei et al. (1992), degenerate four-wave mixing (DFWM) Canto-Said et al. (1991); Bindra et al. (1999), and pump-probe spectroscopy Gaponenko et al. (1994). Over the past years, these nonlinear optical experimental techniques have been extensively used as powerful tools towards investigating the excited electron-hole pair states dynamics of semiconductor QDs, providing complementary information that obtained by linear optical experimental techniques. With the access of ultrafast and ultrahigh intense laser pulses, multiphoton absorption simultaneous absorption of two or more photons has been extensively studied. These multiphoton absorption processes are exceedingly promising in many fields including optical limiting He et al. (1995, 2008b); Venkatram et al. (2008); Kiran et al. (2002), 3D microfabrication Maruo et al. (1997), optical data storage He et al. (2002); Parthenopoulos and Rentzepis (1989), and biomedical applications Yanik et al. (2006). In this regard, CdS QDs are of particular interest because of their high intrinsic nonlinearity Kalyaniwalla et al. (1990).
So far, various nonlinear processes for comprehensive materials were studied Sheik-Bahae et al. (1990); Canto-Said et al. (1991); Said et al. (1992). Furthermore, third-order nonlinear index and refractive-index change coefficient corresponding to free-carriers due to TPA have been calculated from closed-aperture Z-scan results Said et al. (1992). To the best of our knowledge, there are hardly any work included discussion on deriving these nonlinear parameters for three or four-photon absorption in QDs.
In this paper, we report the detail investigation of nonlinear optical processes in CdS QDs synthesized by gamma-irradiation technique. Towards understanding these processes, intensity dependent DFWM, open, and closed-aperture Z-scan experiments were performed. Furthermore, we derived and values corresponding to excited-state electrons generated by four-photon absorption. Results of open-aperture Z-scan with 400 nm femtosecond laser pulses has also been presented. In the first section of results and discussion, we report nonlinear studies on this CdS QD sample. In the later part, we present UV-visible absorption, room temperature photoluminescence and TCSPC experimental results for better understanding of the electronic states in the QDs.
II Experimental
The results of ultrafast nonlinear experiments including DFWM, open-aperture and closed-aperture Z-scan on colloidal solution of CdS QD sample have been reported in this paper. These nonlinear studies are performed using a Ti: Sapphire femtosecond laser (Spectra-Physics, Mai Tai, Spitfire amplifier) having wavelength nm, and repetition rate 1 KHz. The pulse width was determined to be 110 fs through intensity autocorrelation measurements. The nonlinear properties are investigated for the intensity regime 0.02 TW/cm2 to 0.80 TW/cm2 with the femtosecond laser pulses. The input beam intensity is varied using a polarizer and a plate combination. It can be noted that at this intensity range, the water solution does not show any nonlinear behaviour for DFWM as well as Z-scan experiments. The DFWM experiments are performed using folded boxcar geometry Wise (1998). In this technique, a three-dimensional phase-matching is implemented, which enables spatial separation of the signal-beam from the input beams. The fundamental beam is divided into three nearly equal intensity beams (intensity ratio of 1:1:0.9) in such a way that they form three corners of a square and are focused into the nonlinear medium. All three beams are synchronized both spatially and temporally. The resultant DFWM signal is generated due to the phase-matched interaction: . In Z-scan experiments, a Gaussian laser beam is tightly focused onto an optically non-linear sample using a finite aperture and the transmittance through the medium is measured in the far field. Finally, the resultant transmittance is recorded as function of the sample position Z measured about the focal plane. Open-aperture Z-scan has also been performed at wavelength 400 nm (second harmonic of the fundamental wavelength from a BBO crystal). The details about synthesis and structural characterization of the CdS QDs are reported in Roy et al. (2012). Particle size distribution and chemical composition are obtained from the HRTEM images, XPS and Raman spectra analysis.
III Results and discussion
DFWM signal versus probe delay plots for colloidal solution of CdS QDs are shown in Fig. 1 (a).
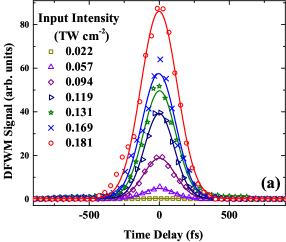
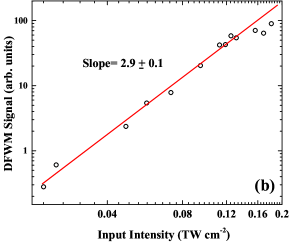
The signals are fitted with Gaussian function (solid curve). The signal profiles are nearly symmetric about the maximum ( zero time delay) illustrating that the response times of the nonlinearities are shorter than the pulse duration (110 fs). This fast response enhances their potential for photonic switching applications. The intensity dependence of the DFWM signal amplitude is presented in Fig. 1 (b). At relatively low input intensities ( GW/cm2), the DFWM signal amplitude followes a cubic (with a slope of 2.90.1) dependence. It clearly demonstrates that the nonlinearity behaves in a Kerr-like fashion and the origin of DFWM does not have contribution from any multiphoton absorption process, which leads to higher power dependence Sutherland (1996). It can be seen from the intensity dependence of the DFWM signal plot that the DFWM signal intensity goes down at input intensity around 180 GW/cm2. This substantial reduction in the DFWM signal intensity is mainly due to the nonlinear absorption of all interacting beams. However, the DFWM signal does not show any higher power dependence, expected for multiphoton absorption, indicating the dominance of process over multiphoton photon absorption at this input intensity regime. To confirm this, we have performed open-aperture Z-scan experiment, which is discussed in the next section. The measurement of values are performed at zero time delay of all the beams. We estimated the magnitude of by maintaining the same polarization for all the three incident beams. The third-order nonlinear optical susceptibility is estimated by comparing the measured DFWM signal of the sample with that of as reference ( esu Liao et al. (1998); Minoshima et al. (1991)) measured with the same experimental conditions. The equation relating and is given by Sutherland (1996)
| (1) |
where is the DFWM signal intensity, is the linear absorption coefficient, is sample path length, and ( and at nm) is the refractive-index. The effective refractive-index of the sample is essentially that of water solution. The value for the CdS QD sample comes out to be esu for an input intensity of 47.5 GW/cm2. Assuming no QD-QD interaction, the measured can be written as
| (2) |
where is the QD concentration in the solution and is the average nonlinearity per QD. The QD concentration for CdS QD sample is 3.2 M. The value for the CdS QDs comes out to be esu per QD. One of the main sources of error that arises in experiments is through the intensity fluctuations of laser pulses. This problem is tackled by taking the averaged data of 1000 pulses. The second major source of error could be from the determination of solution concentration. Considering all the unforced random experimental errors, we estimate an overall error of 10 in our calculations by repeating the experiments few times.
Towards performing Z-scan experiments, the incident Gaussian laser beam was passed through an aperture of diameter 3 mm and focused by a lens of focal length 12 cm. The beam waist () at the focal point (Z = 0) and the Rayleigh range () were 23.3 m and 2.13 cm, respectively. Whereas, the sample cell thickness was 1 mm. Therefore, the sample was considered as ’thin’ and the slowly varying envelope approximation (SVEA) was applied to obtain theoretical fitting of the experimental data points Sheik-Bahae et al. (1990). Fig. 2 (a) shows the measured open-aperture Z-scan plots of colloidal solution of CdS QDs for 800 nm wavelength, 110 fs laser pulses with three different input peak intensities (0.53 TW/cm2, 0.67 TW/cm2, and 0.80 TW/cm2). The scattered points are experimental data points and the continuous curves are the theoretical fitting corresponding to 4PA. All the theoretical simulations were performed following the analytic expression for open-aperture Z-scan transmittance under first-order approximation given by Bing Gu et al. Gu et al. (2010).
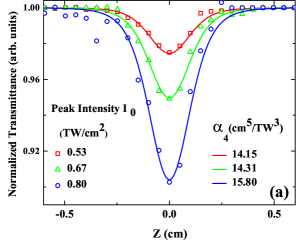
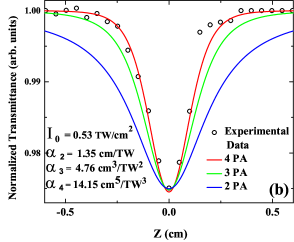
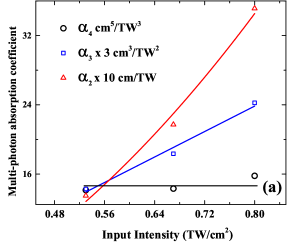
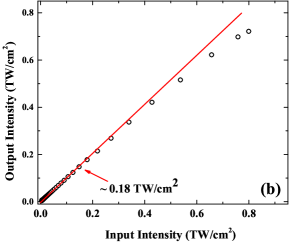
Fig. 2 (b) shows the theoretical fitting of the open-aperture Z-scan data corresponding to input peak intensity 0.53 TW/cm2 with n = 2, 3 , and 4. The theoretical fitting obtained with n = 2 and 3 corresponding to two-photon (TPA) and three-photon absorption (3PA) do not exactly reproduce the experimental data. This is a clear indication that the the TPA and 3PA are not the dominant processes at 800 nm excitation. The curves are therefore fitted with theoretically simulated result corresponding to four-photon absorption (4PA) process. The theoretical fitting with 4PA matches well with the experimental data. Fig. 3 (a) shows multi-photon absorption coefficient versus incident beam intensity plots. It can be noted that the value remains almost constant for the intensity range 0.53 TW/cm2 to 0.80 TW/cm2. Whereas, and increase quadratically and linearly with incident beam intensity, respectively. Therefore, it can be concluded that at this incident beam intensity range, four-photon absorption process is dominant. Fig. 3 (b) shows nonlinear transmittance plot for CdS QD sample. It shows that the nonlinear absorption starts at peak intensity around 0.18 TW/cm2, which supports the results obtained in DFWM experiments.
Towards understanding the role of 4PA in nonlinear refraction, in case of excitation of CdS QDs with 800 nm femtosecond laser pulses, closed-aperture experiment was performed at different irradiances, ranging from 0.17 TW/cm2 to 0.53 TW/cm2. Fig. 4 (a) shows the theoretical fitting of closed-aperture Z-scan plots corresponding to different incident beam intensity for CdS QD samples. All the theoretical fittings of closed-aperture Z-scan transmittance results were performed following the analytic expression given by Bing Gu et al. Gu et al. (2010).
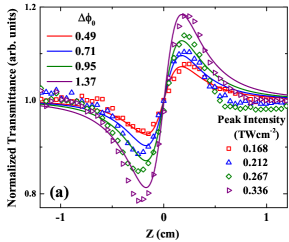
The valley-peak configuration of the closed-aperture Z-scan curve indicates positive (self-focusing) nonlinearity due to the electronic Kerr-effect and excited state electrons reached by 4PA process. The corresponding phase equation can be given by Sheik-Bahae et al. (1990)
| (3) |
where is the change in index of refraction. is the nonlinear index corresponding to the bound electrons and is the change in the refractive-index per unit photo-generated excited state electron density N. In the context of excited state electron generation due to 4PA, we can neglect excited state relaxation as these processes occur at longer time scale than the femtosecond laser pulses used for performing these experiments. Therefore, neglecting relaxation loss, the excited state electron generation rate due to 4PA can be given by
| (4) |
Using Eqs. 3 and 4, we obtained the formula relating and for the presence of third-order nonlinearity and photo-generated excited state electrons by 4PA. The equation is given by
| (5) |
where . Here is pulse width of the excitation laser beam. In absence of nonlinear absorption, the difference between peak and valley () in closed-aperture Z-scan transmittance can be given by Said et al. (1992)
| (6) |
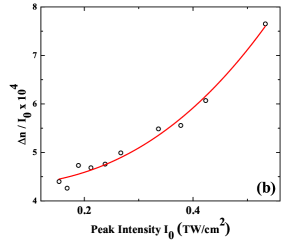
where and is the on-axis phase change at the focus. A closed and an open-aperture Z-scan are performed at same irradiance, and the closed-aperture data are divided by the open-aperture data. is obtained from the resultant curve. This value is then divided by to determine . For determining , is calculated using the formula , where is the linear absorption coefficient, and is the 4PA coefficient which is obtained from the open-aperture Z-scan experiment results. The experiments are performed at different irradiances, and is plotted as function of . versus plot is shown in Fig. 4 (b). In absence of any higher-order nonlinearity, this plot is expected to be a horizontal line with vertical intercept . From the theoretical fitting (red continuous curve) using Eq. 5, and are calculated and the values are and cm3, respectively. Therefore, the closed-aperture Z-scan results further establish the 4PA processes.
In this section, the results of the linear studies including UV-visible absorption, room temperature photoluminescence, and TCSPC are reported towards establishing the energetic positions of the electronic states and their decay times. Fig. 5 (a) shows absorption and photoluminescence spectra of colloidal solution of CdS QDs.
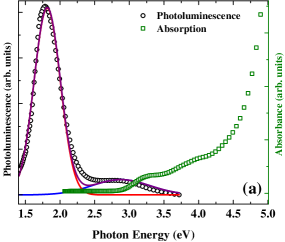

The peak positions of the absorption band-edge for these semiconductor QD sample appears at around 380 nm wavelength ( 3.26 eV). Whereas, the band gap of bulk CdS is 2.42 eV. This large blue shift of absorption band-edge is due to quantum confinement effect in QDs having diameter less than 5.8 nm (Bohr radius of bulk CdS). The broadness of the absorption band-edge suggests broad particle size distribution and confirmed by HRTEM images Roy et al. (2012). The average diameter of the QDs is 4.2 nm. The photoluminescence spectrum of these CdS QDs manifests two broad bands corresponding to Stokes shifted band-edge emission and defect state emission. The band-edge photoluminescence band ranges from 350 nm ( 3.5 eV) to 500 nm ( 2.5 eV). Whereas, the defect state emission band energy ranges from 2.5 eV to 1.6 eV with peak at around 1.9 eV. Time correlated single photon counting (TCSPC) was performed to determine the decay time of the band-edge and defect-state transitions in these QD sample. The fluorescence decay plots of the colloidal solutions of CdS QDs are shown in Fig. 5 (b). A picosecond laser of wavelength 375 nm is used as excitation source. The PL emission is monitored at wavelengths 400 nm and 650 nm which correspond to the band-to-band and defect state transitions respectively. The FWHM of the instrument respose function (IRF) is 254 ps. The curves can be fitted with three exponential decay functions. The fluorescence decay times corresponding to 400 nm emission wavelength are: ns, ns, and ns. The decay times corresponding to 650 nm emission wavelength are: ns, ns, and ns. Whereas, the decay time obtained in DFWM with 800 nm femtosecond laser pulses is of the order of 110 fs. These results confirm that electrons do not get excited to band edge or defect states for 800 nm fs laser pulse excitation. Left panel of Fig. 6 shows open-aperture Z-scan with 400 nm femtosecond laser pulses with peak intensity 1.0 TW/cm2. The theoretically simulated result corresponding to two-photon absorption (TPA) adequately reproduces the experimental data. The TPA coefficient value comes out to be 3.6 cm/TW.
The schematic description of two-photon and four-photon transition processes and all the electronic states probed by linear and nonlinear optical techniques are shown in the right panel of Fig. 6. The energy corresponding to 3PA for 800 nm excitation wavelength is 4.65 eV.
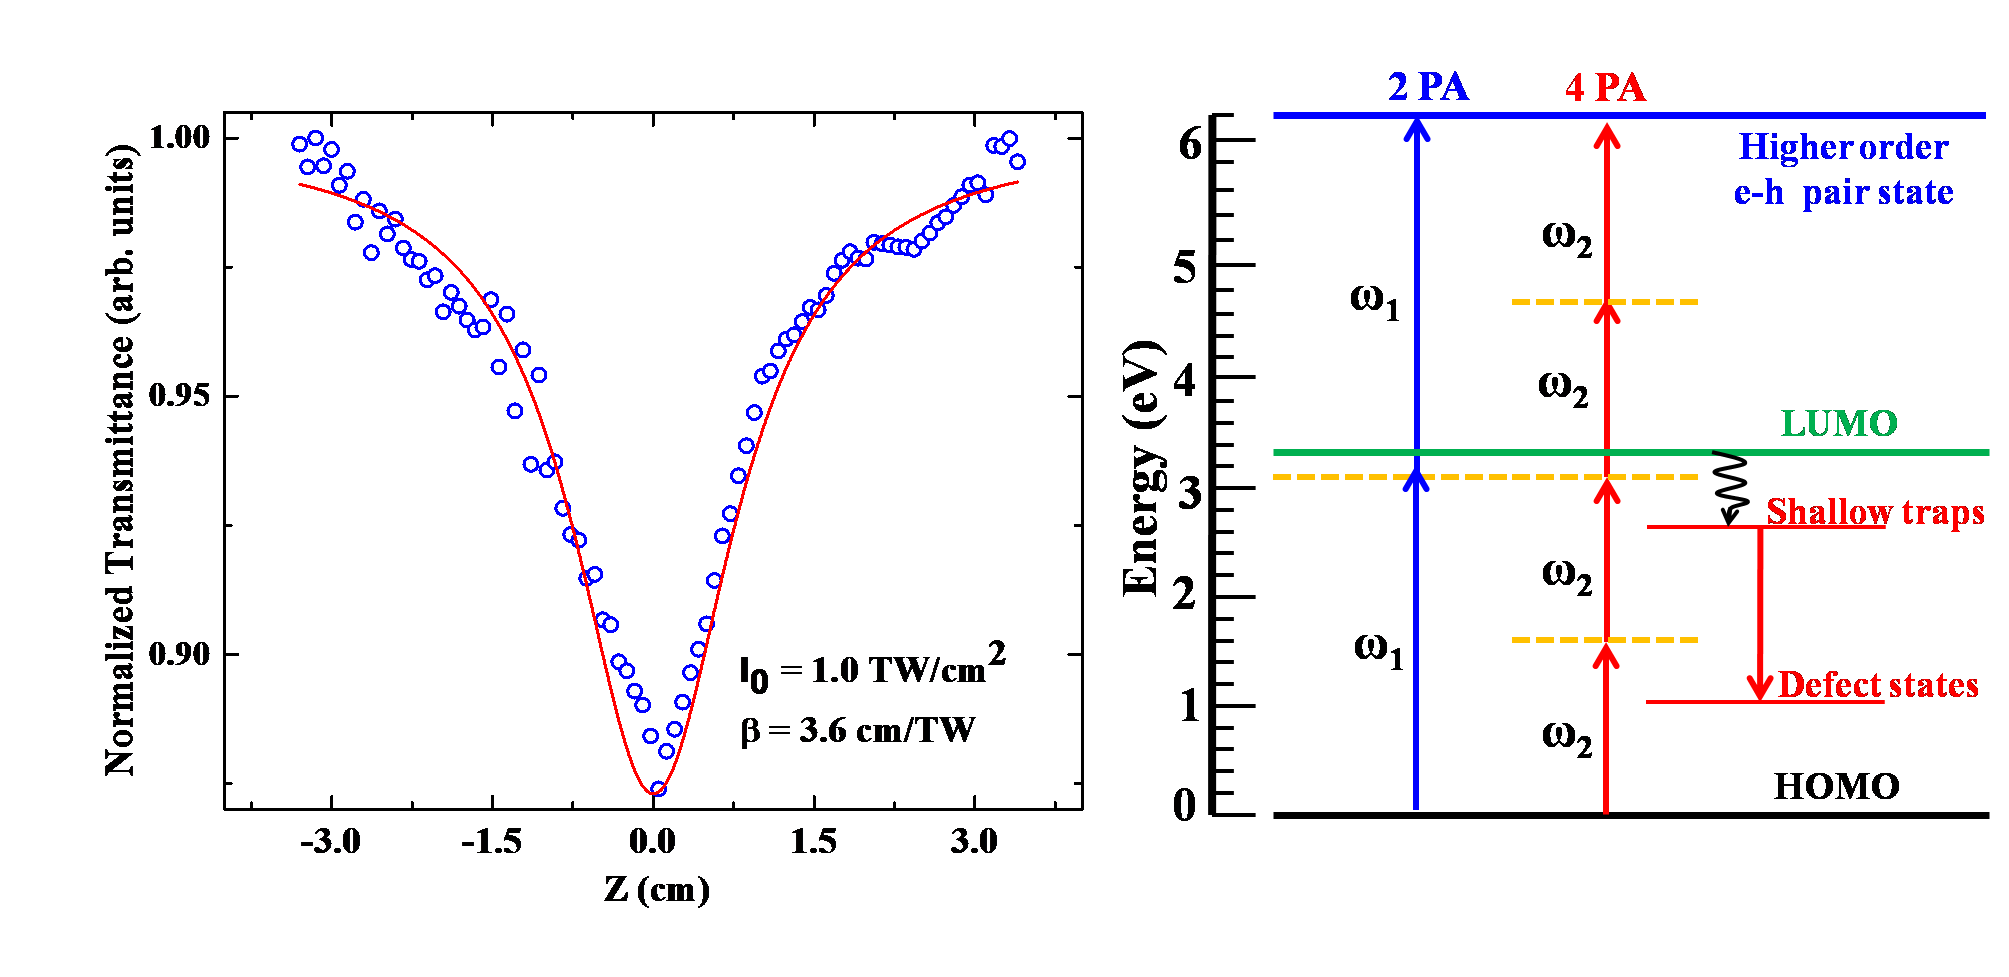
Whereas, Dhayal et al. Dhayal et al. (2014) have reported that there are real excited states at this energy level for CdS QDs. Therefore, it can be concluded that the electrons absorb three-photons initially and reach these real excited states. Thereafter the electrons absorb one more photon to reach the terminal state. Therefore, this multiphoton absorption process can be called as 3PA assisted 4PA.
IV Conclusion
The ultrafast nonlinear optical properties including the time response of CdS QD sample using degenerate four-wave mixing technique at a wavelength of 800 nm with 110 fs pulses were thoroughly investigated. The nonlinear experiments were performed for the intensity regime 0.02 TW/cm2 to 0.80 TW/cm2. The CdS QD sample shows Kerr-type nonlinearity for intensity below 0.18 TW/cm2. However, the intensity dependent open-aperture and closed-aperture Z-scan studies with 800 nm femtosecond laser pulses indicate 4PA above this input intensity. The closed-aperture Z-scan also manifests positive nonlinearity (self-focusing) for the CdS QDs. Open-aperture Z-scan with 400 nm femtosecond laser pulses shows two-photon absorption (TPA).
Band gap energy and the defect state energy of the CdS QDs were estimated from the UV-visible absorption and PL spectrum. Whereas, information about the energy positions of the higher-order electronic states is obtained from the multiphoton absorption processes.
Acknowledgments
We thank Prof. A. S. Pente, BARC, Mumbai, for providing gamma-irradiation facility for synthesis of CdS QDs. We also thank CRNTS and Central Surface Analytical Facility, IIT Bombay for facilitating HR-TEM characterizations.
References
References
- Vivas et al. (2013) M. G. Vivas, J. F. Cury, M. A. Schiavon, and C. R. Mendonca, The Journal of Physical Chemistry C 117, 8530 (2013).
- Dakovski and Shan (2013) G. L. Dakovski and J. Shan, Journal of Applied Physics 114, 014301 (2013).
- Lad et al. (2007) A. D. Lad, P. Prem Kiran, G. Ravindra Kumar, and S. Mahamuni, Applied Physics Letters 90, 133113 (2007).
- He et al. (2008a) G. S. He, Q. Zheng, K. T. Yong, F. Erogbogbo, M. T. Swihart, and P. N. Prasad, Nano Letters 8, 2688 (2008a).
- Yoshino et al. (2003) F. Yoshino, S. Polyakov, M. Liu, and G. Stegeman, Phys. Rev. Lett. 91, 063902 (2003).
- Sheik-Bahae et al. (1990) M. Sheik-Bahae, A. Said, T.-H. Wei, D. Hagan, and E. Van Stryland, IEEE J. Quantum Electron. 26, 760 (1990).
- Said et al. (1992) A. A. Said, M. Sheik-Bahae, D. J. Hagan, T. H. Wei, J. Wang, J. Young, and E. W. V. Stryland, J. Opt. Soc. Am. B 9, 405 (1992).
- Wei et al. (1992) T. Wei, D. Hagan, M. Sence, E. Van Stryland, J. Perry, and D. Coulter, Appl. Phys. B 54, 46 (1992).
- Canto-Said et al. (1991) E. Canto-Said, D. Hagan, J. Young, and E. Van Stryland, IEEE J. Quantum Electron. 27, 2274 (1991).
- Bindra et al. (1999) K. Bindra, S. Oak, and K. Rustagi, Phys. Rev. B 59, 2968 (1999).
- Gaponenko et al. (1994) S. Gaponenko, U. Woggon, A. Uhrig, W. Langbein, and C. Klingshirn, J. Lumin. 60–61, 302 (1994).
- He et al. (1995) G. S. He, B. A. Reinhardt, J. C. Bhatt, A. G. Dillard, G. C. Xu, and P. N. Prasad, Opt. Lett. 20, 435 (1995).
- He et al. (2008b) G. S. He, L.-S. Tan, Q. Zheng, and P. N. Prasad, Chem. Rev. 108, 1245 (2008b).
- Venkatram et al. (2008) N. Venkatram, D. Narayana Rao, L. Giribabu, and S. Venugopal Rao, Appl. Phys. B 91, 149 (2008).
- Kiran et al. (2002) P. P. Kiran, D. R. Reddy, B. G. Maiya, A. K. Dharmadhikari, G. R. Kumar, and N. R. Desai, Appl. Opt. 41, 7631 (2002).
- Maruo et al. (1997) S. Maruo, O. Nakamura, and S. Kawata, Opt. Lett. 22, 132 (1997).
- He et al. (2002) G. S. He, P. P. Markowicz, T.-C. Lin, and P. N. Prasad, Nature 415, 767 (2002).
- Parthenopoulos and Rentzepis (1989) D. A. Parthenopoulos and P. M. Rentzepis, Science 245, 843 (1989).
- Yanik et al. (2006) M. Yanik, H. Cinar, H. Cinar, A. Gibby, A. Chisholm, Y. Jin, and A. Ben-Yakar, IEEE J. Quantum Electron. 12, 1283 (2006).
- Kalyaniwalla et al. (1990) N. Kalyaniwalla, J. W. Haus, R. Inguva, and M. H. Birnboim, Phys. Rev. A 42, 5613 (1990).
- Wise (1998) D. L. Wise, Electrical and Optical Polymer Systems (CRC Press, 1998).
- Roy et al. (2012) S. Roy, V. Jain, R. Bajpai, P. Ghosh, A. S. Pente, B. P. Singh, and D. S. Misra, J. Phys. Chem. C 116, 19025 (2012).
- Sutherland (1996) R. L. Sutherland, Handbook of nonlinear optics (Marcel Dekker Inc., 1996).
- Liao et al. (1998) H. B. Liao, R. F. Xiao, J. S. Fu, H. Wang, K. S. Wong, and G. K. L. Wong, Opt. Lett. 23, 388 (1998).
- Minoshima et al. (1991) K. Minoshima, M. Taiji, and T. Kobayashi, Opt. Lett. 16, 1683 (1991).
- Gu et al. (2010) B. Gu, K. Lou, J. Chen, H.-T. Wang, and W. Ji, J. Opt. Soc. Am. B 27, 2438 (2010).
- Dhayal et al. (2014) S. S. Dhayal, L. M. Ramaniah, H. E. Ruda, and S. V. Nair, The Journal of Chemical Physics 141 (2014).