Tracking local magnetic dynamics via high-energy charge excitations
in a relativistic Mott insulator
Abstract
We use time- and energy-resolved optical spectroscopy to investigate the coupling of electron-hole excitations to the magnetic environment in the relativistic Mott insulator Na2IrO3. We show that, on the picosecond timescale, the photoinjected electron-hole pairs delocalize on the hexagons of the Ir lattice via the formation of quasi-molecular orbital (QMO) excitations and the exchange of energy with the short-range-ordered zig-zag magnetic background. The possibility of mapping the magnetic dynamics, which is characterized by typical frequencies in the THz range, onto high-energy (1-2 eV) charge excitations provides a new platform to investigate, and possibly control, the dynamics of magnetic interactions in correlated materials with strong spin-orbit coupling, even in the presence of complex magnetic phases.
Addressing the way local charge excitations delocalize and interact with the magnetic environment is a urgent task in the study of correlated materials. The possible impacts range from the clarification of the microscopic origin of the spin correlations that give rise to exotic magnetic states in transition-metal oxides Balents (2010); Pesin and Balents (2010); Tokiwa et al. (2014); Hwan Chun et al. (2015); Dean et al. (2016) to the possibility of photo-stimulating novel functionalities in materials in which the charge and magnetic excitations are strongly intertwined Kirilyuk et al. (2010); Kub ; Giannetti et al. (2016). The family of transition-metal oxides offers a particularly interesting playground to achieve these goals. In these materials, the on-site Coulomb repulsion is reduced to by the increased average radius of the orbitals and the spin-orbit coupling (SOC) interaction is pushed up to by the large mass of the metal atoms Kim et al. (2008); Jackeli and Khaliullin (2009); Shitade et al. (2009). As a consequence of the interplay of , and the delocalization driven by the hopping, neither a local Mott-like picture nor a delocalized orbital scenario is fully appropriate to capture the rich phenomenology of these materials: from Mott insulating states in which the local moments have also orbital character Kim et al. (2008); Comin et al. (2012) to exotic spin-liquid phases Balents (2010) driven by bond-directional magnetic interactions Hwan Chun et al. (2015).
Here, we focus on the honeycomb relativistic Mott insulator Na2IrO3 and adopt a non-equilibrium approach Giannetti et al. (2016). We investigate how electron-hole excitations, photoinjected across the Mott gap Alpichshev et al. (2015); Hinton et al. (2015), delocalize on the honeycomb lattice and release energy to the local magnetic background. Our experiment shows that the delocalization of local photostimulated charges is mediated by the excitations of specific QMOs. The perfect symmetry matching between the relevant QMOs and the zig-zag magnetic order allows the energy transfer to the magnetic background on the picosecond timescale. Exploiting the SOC-driven intertwining of magnetism and high-binding-energy electronic states, we show that the melting of the short-range zig-zag order is mapped onto the modification of the optical properties in the near infrared region. This finding provides a new platform to track the magnetic dynamics in 5 transition metal oxides, as well as in many other relativistic correlated materials.
In the honeycomb iridate Na2IrO3, the crystal-field-split Ir- orbitals host 5 electrons Felner and Bradaric (2002); Kobayashi et al. (2003); Singh and Gegenwart (2010). In the localized picture Kim et al. (2008); Chaloupka et al. (2010, 2013), SOC splits the manifold into completely filled =3/2 levels and one half-filled =1/2 state. The =1/2 level is further split by the on-site Coulomb repulsion into an empty upper-Hubbard-band (UHB) and an occupied lower-Hubbard-band (LHB), thus leading to a relativistic Mott insulator. This scenario provides a good explanation for both the measured insulating gap of Comin et al. (2012) and for the complex magnetic properties of the material, which exhibits strong magnetic correlations below and a long-range-ordered zig-zag phase below Singh and Gegenwart (2010); Ye et al. (2012); Choi et al. (2012). The large frustration parameter Singh and Gegenwart (2010) and the evidence of bond-directional magnetic interactions described by the Kitaev model Hwan Chun et al. (2015) suggest the tendency to form a low-temperature spin-liquid phase out of which the zig-zag order emerges.
On the other hand, the large oxygen-mediated hopping term () between neighboring Ir atoms drives a very effective electronic delocalization over the Ir hexagons. As a consequence, quasi-molecular orbitals (QMOs), built from linear combinations of Ir- Wannier functions, emerge as the natural basis for describing the electronic properties of Na2IrO3 Mazin et al. (2012); Foyevtsova et al. (2013). It has been recently demonstrated that the concept of QMOs is the key to rationalize the outcome of ab-initio band-structure calculations Mazin et al. (2012); Foyevtsova et al. (2013) and accounts for the manifold of structures observed in the energy range via photoemission and optical spectroscopy Comin et al. (2012); Li et al. (2015).
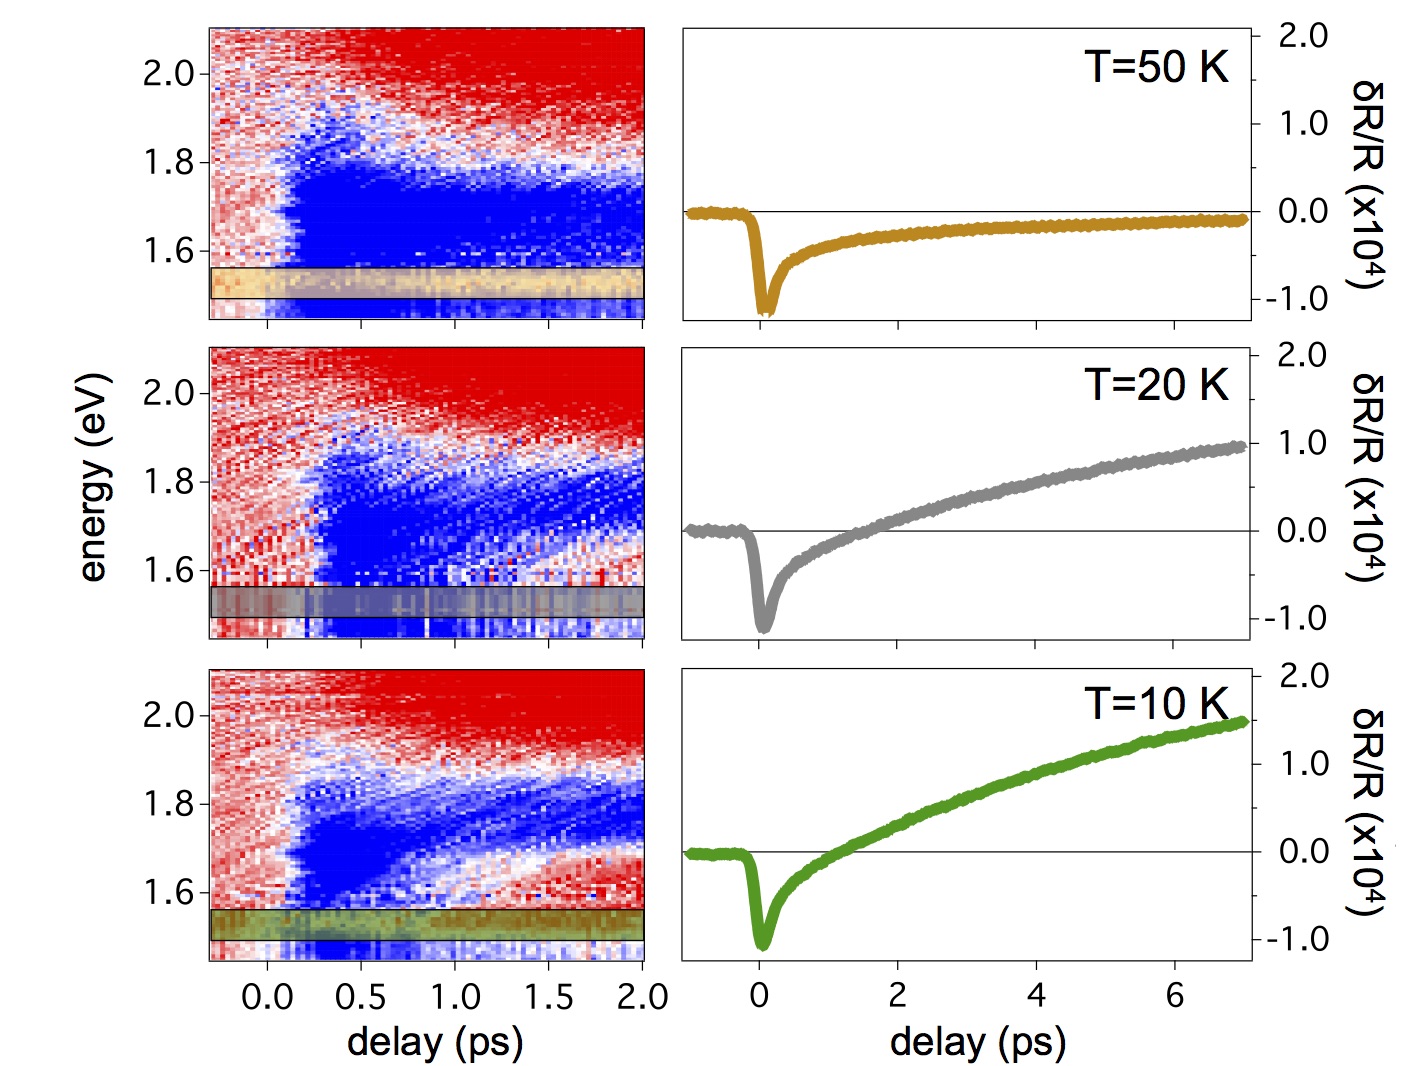
Broadband pump-probe optical spectroscopy is performed on high-quality Na2IrO3 crystalsSingh and Gegenwart (2010). While the pump pulse (=1.55 eV photon energy) is used to photoinject local electron-hole excitations across the Mott gap, the broadband probe snaps the dynamics of the optical transitions in the range 12 eV, that corresponds to large binding-energy QMOs. The time- and energy- resolved reflectivity variation (/) measurements have been performed by exploiting the supercontinuum white light produced by a photonic crystal fiber seeded by a cavity-dumped ( rep. rate) Ti:sapphire oscillator (for details see Refs. 25 and 26). This configuration allowed us to perform measurements in the low-excitation regime and avoid the local heating of the sampleSup . In Fig. 1 (left panels), we report the two-dimensional / plots taken at three different temperatures. Following the pump excitation at , the / signal is characterized by a temperature-independent response, which turns from positive (red) to negative (blue) at . This response can be attributed to a thermomodulation effect Sun et al. (1994) that results in the broadening of the interband transitions involving energy scales eV.
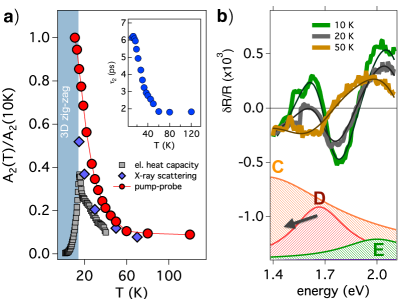
More interestingly, a new positive component appears a few picoseconds after the excitation in a narrow spectral region () when is approached. The dynamics of this additional component is clearly evidenced by the right panels of Fig. 1, which report the time-traces extracted from the signal at . On the picosecond timescale, the dynamics of the signal is characterized by a very slow build-up time of a positive component, whose amplitude increases at low . In order to systematically extract the amplitude and timescale of this component, we performed a simple double-exponential fit of the function to the data. While both and are found to be temperature independentSup in the entire explored temperature range (), the amplitude and timescale of the second component dramatically increase at low temperatures, as shown in Fig. 2a (red dots). To rule out possible artifacts related to impulsive heating, that could be particularly relevant at low temperatures, very low-fluence (0.1-10 J/cm2) single-color (=1.55 eV) time-resolved reflectivity measurements were performedSup . The values of and are found to be constant up to fluences of 10 J/cm2, thus demonstrating that the slowing down of the second dynamics is a genuine physical effect related to the progressive onset of magnetic correlations on approaching .
These results are in agreement with single-color measurements reported in Refs. 13 and 14, which suggested the following two-step picture: i) on the timescale, the high-energy electron-hole excitations created by the 1.55 eV pump pulse relax through electron-electron interactions and the coupling with optical phonons, thus leading to the fast accumulation of doublons (i.e. doubly occupied Ir sites) and holons (i.e. unoccupied Ir sites) at the bottom (top) of the UHB (LHB); ii) the interaction with the locally ordered magnetic environment, characterized by the combination of Kitaev and Heisenberg-type correlations, drives the binding of the holons and doublons into local excitons, whose binding energy grows with their distance Alpichshev et al. (2015). As a consequence of the strong dynamical constraints, the delocalization of the holon-doublon pairs is expected to be strongly delayed and to be eventually effective only on the picosecond timescale Alpichshev et al. (2015).
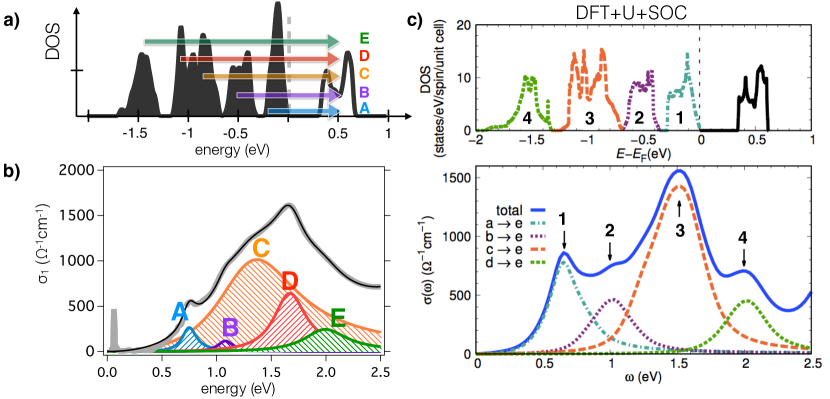
While the dynamics of the local excitons can be rationalized within the model Alpichshev et al. (2015), its relationship with the modification of the high-energy optical properties remained obscure so far. The frequency-resolution of the data reported in this work allows us to make a fundamental step beyond single-color measurements and to address both the origin of the observed signal at 1.6 eV and the way the local excitons delocalize on the Ir hexagons and release their excess energy to the zig-zag magnetic background. In particular, the results presented in Fig. 1 and 2a are characterized by two important features. First, the / signal in the spectral range is detected at temperatures well above (see Fig. 2a), while no divergence of and is observed at . This finding suggests that the relaxation dynamics of the excitons is slowed down by short-range zig-zag correlations Hinton et al. (2015). This observation can be corroborated by comparing the temperature-dependence of the component to the outcomes of equilibrium techniques. In Fig. 2a, we report the electronic contribution to the heat capacity measured in Ref. 17. The broad tail extending up to was interpretedSingh and Gegenwart (2010) as the signature of the presence of short-range magnetic correlations well above . More recently, the existence of zig-zag correlations at temperatures above the long-range magnetic phase transition has been directly supported by resonant inelastic X-ray scattering measurements Hwan Chun et al. (2015). The temperature-dependence of the magnetic diffraction peak, reported in Fig. 2a, directly demonstrates the persistence of zig-zag magnetic correlations, with a correlation length () of , at least up to . Importantly, the temperature dependence of the component in the signal almost perfectly overlaps with that of the short-range zig-zag correlations (see Fig. 2a). This observation strongly supports the interpretation of the slow dynamics observed in the pump-probe experiment as the time needed by the non-equilibrium distribution of electron-hole excitations to couple to the zig-zag order on a spatial scale , eventually leading to its (partial) melting. Second, the appearance of the slow signal is confined to a narrow frequency range. This suggests that the delocalization of the doublons and the consequent melting of the zig-zag order selectively affect a specific high-energy QMO. Quantitatively, this can be demonstrated by a differential fitting procedure, that builds on a multi Lorentzian model of the equilibrium dielectric functionSup . Both the position and the amplitude of the five oscillators used to reproduce the dielectric function perfectly map the transitions expected in the QMOs picture Li et al. (2015) (for a detailed discussion see Ref. 27). Importantly, the spectrally-narrow positive component that appears at low temperatures is solely related to a modification of a specific oscillator (labeled D as shown in Fig. 2), which thus unveil a direct interplay between the melting of the zig-zag order and one of the QMOs at binding energy 1 eV.
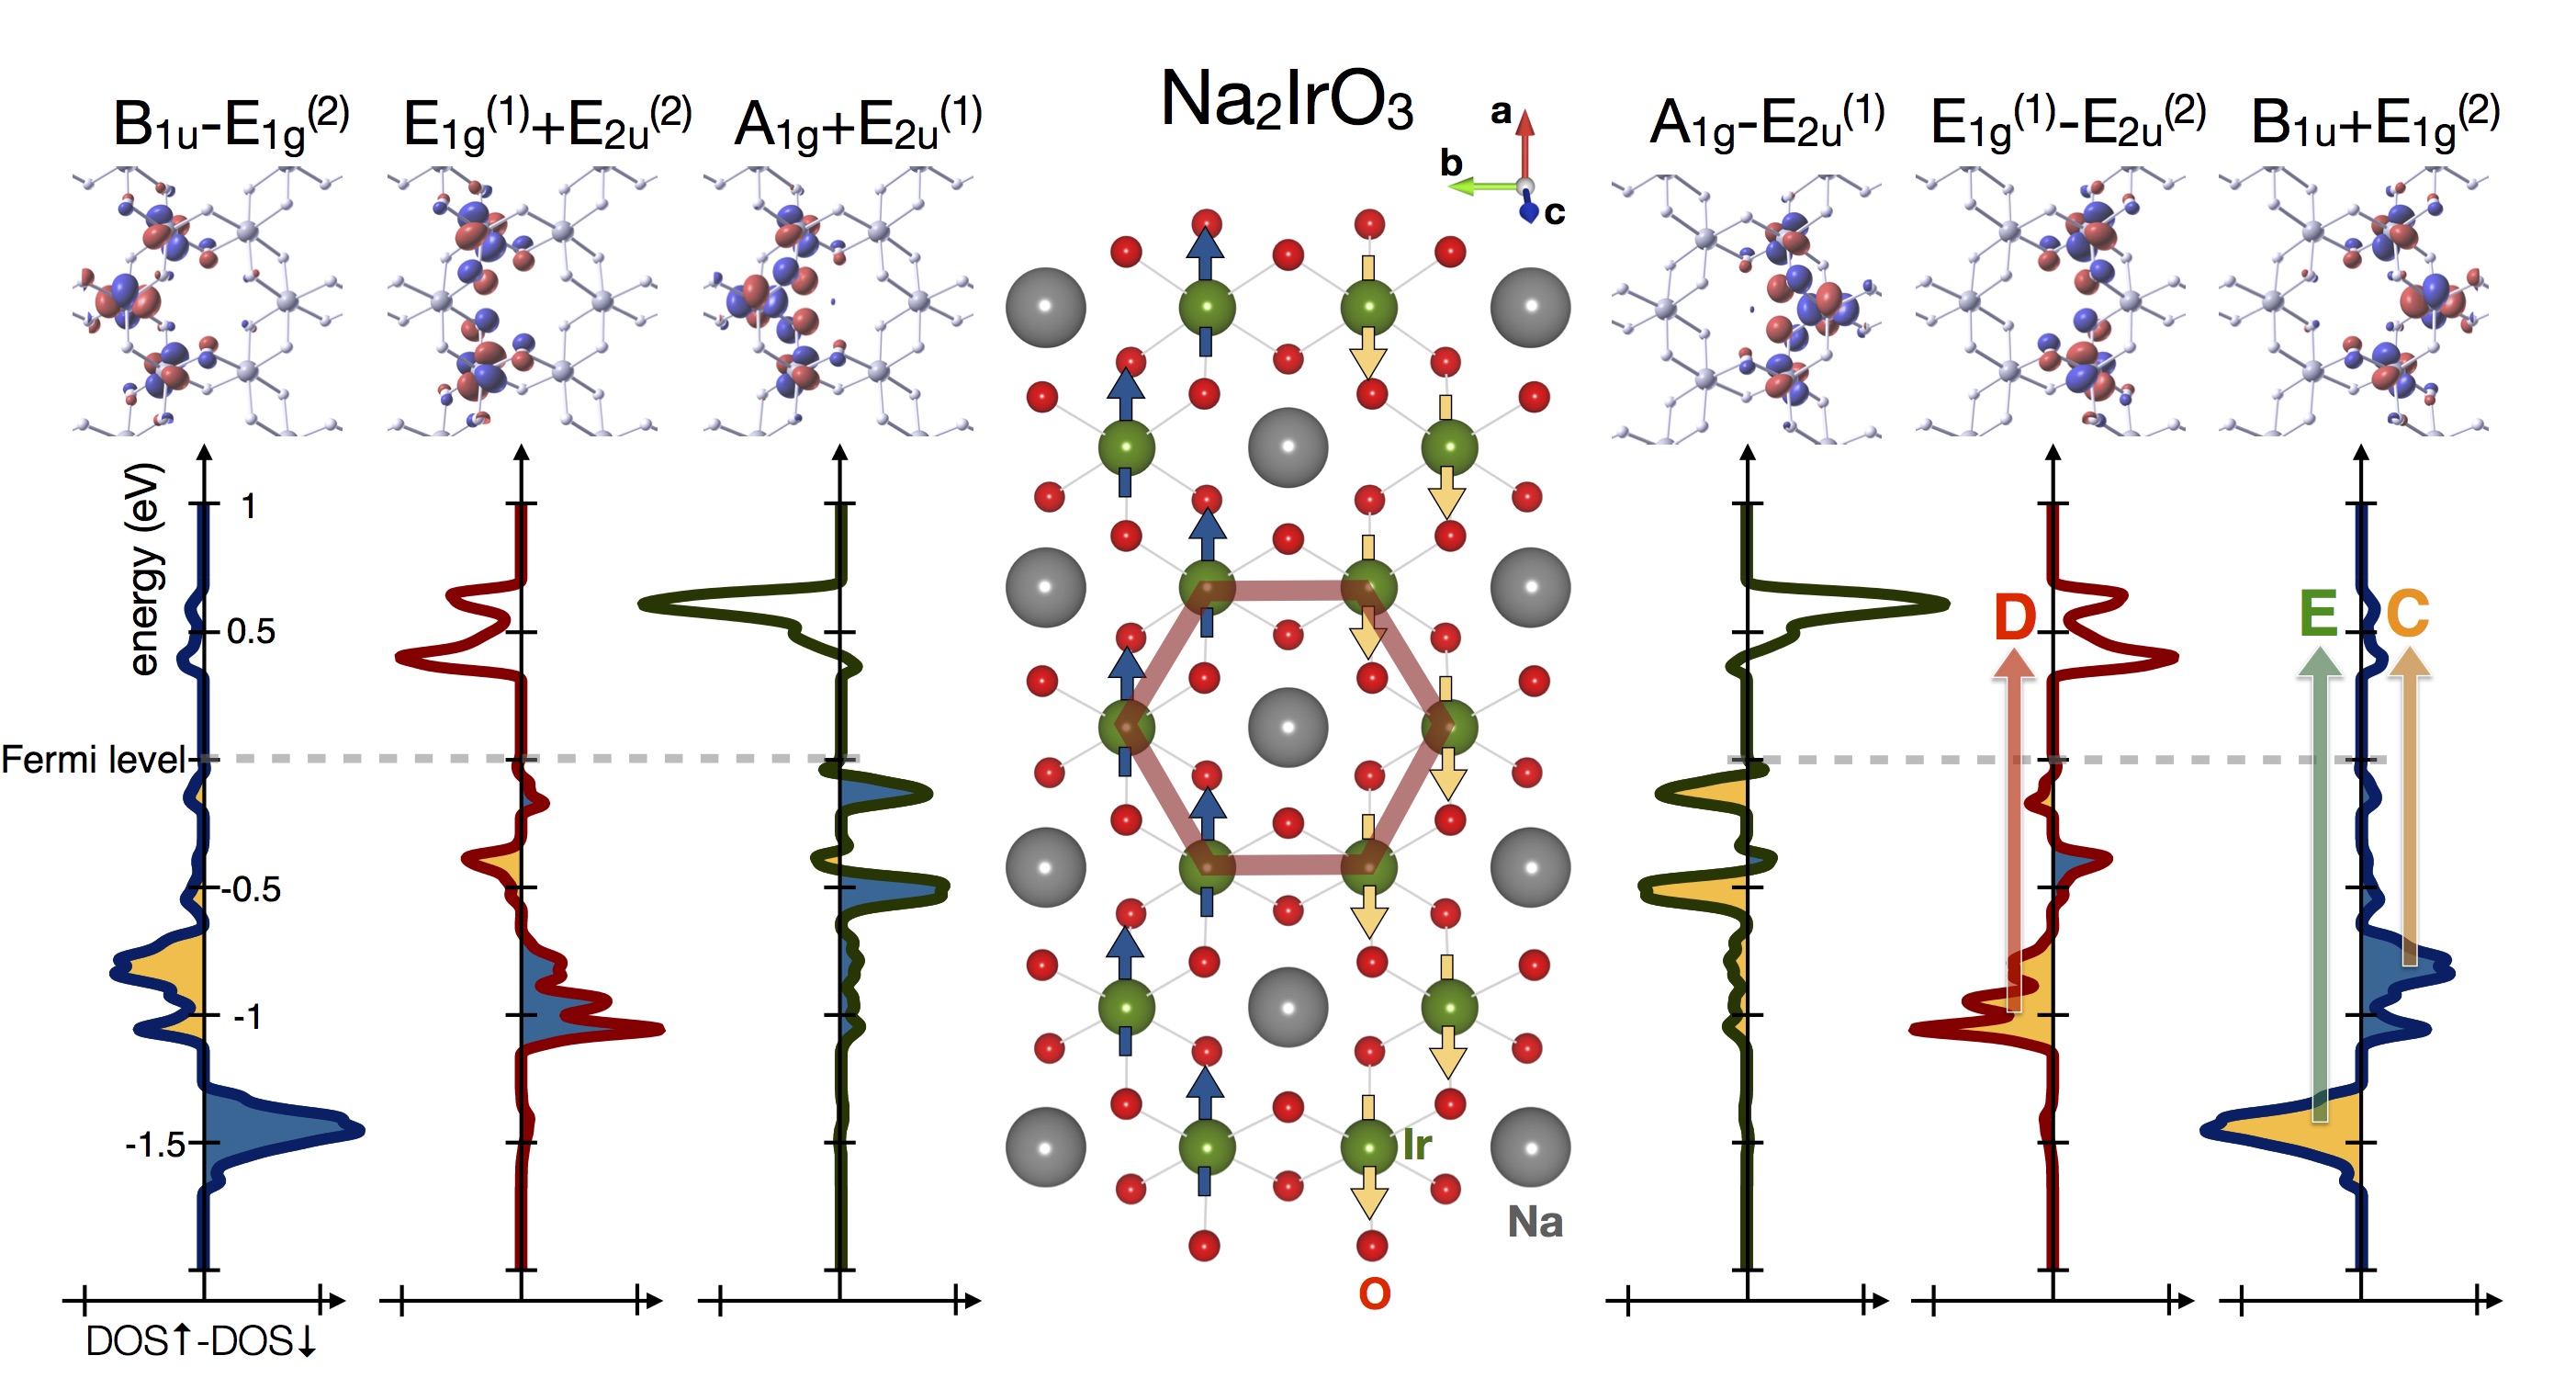
To shed light onto the relation between magnetism and QMOs, the electronic band structure of Na2IrO3 has been calculated by ab-initio relativistic Density Functional Theory (DFT), performed through the linearized augmented plane wave (LAPW) method as implemented in the full-potential code WIEN2k. As extensively discussed in several works Mazin et al. (2012, 2013); Foyevtsova et al. (2013); Li et al. (2015), the DFT-calculated density of states (DOS) presents five separated bands which are strongly reminiscent of the QMOs. The six QMOs localized on a particular hexagon can be grouped into the lowest-energy singlet, the two doublets and and the highest-energy singlet Mazin et al. (2012). SOC mixes the three QMOs closer to the Fermi energy, splits the doublets and leads to a suppression of the density of states at the Fermi level Mazin et al. (2012); Comin et al. (2012); Foyevtsova et al. (2013). This suppression further evolves into the experimental gap when the Coulomb repulsion is considered Comin et al. (2012); Li et al. (2015).
Interestingly, the QMO representation has a strong connection with the zig-zag magnetic order emerging at low temperature. Fig. 3 shows that suitable linear QMO combinations preserve both the spatial arrangement and the magnetic polarization of the zig-zag ordering. In particular, the combinations (dark red curves in Fig. 3), which are mainly located at binding energy and account for the optical transition D, are almost fully polarized according to the zig-zag pattern. Furthermore, they are characterized by a non-zero overlap with both the occupied states right below the Fermi level and the empty states at (Fig. S1), thus constituting the perfect link between the low-energy dynamics and the high-energy electronic properties.
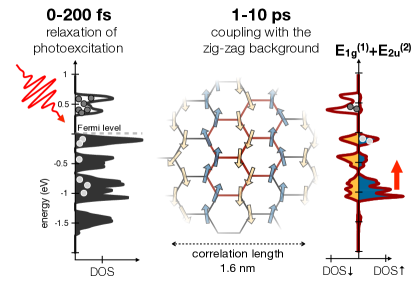
The combination of non-equilibrium optics and ab-initio calculations provides a comprehensive picture of the delocalization of the holon-doublon pairs and of the energy exchange with magnetic background (see Fig. 4). The holon-doublon pairs are initially confined by the dynamical constraints given by the topology of the zig-zag magnetic correlations Alpichshev et al. (2015). On the picosecond timescale, the local pairs degrade via the delocalization on the Ir hexagons and form QMO-like charge excitations that are delocalized over a length scale of the order of . In particular, the strong character of the empty states at the bottom of the UHB (see Fig. 3) allows us to identify this specific QMO combination as the channel for the energy transfer between charge excitations and the magnetic background. Considering the almost full zig-zag polarization of the QMOs (see Fig. 3), we argue that the excess charge excitations in the UHB are intrinsically associated to the weakening of the zig-zag order, thus driving an effective heating of the spin background. As a feedback, the perturbation of the zig-zag magnetic order is expected to particularly affect the QMOs combinations that exhibit the same spatial pattern and spin-polarization. Specifically, the partial quench of the zig-zag magnetic correlations leads to the modification of the strongly coupled QMOs at binding energy, thus allowing to map the low-energy magnetic dynamics onto the variation of the optical properties at .
Our results have also a wider impact on the physics of relativistic correlated materials. In the case of honeycomb iridates, our results demonstrate that the efficacy of the fully-localized () and quasi-delocalized (QMO) scenarios strongly depends on the energy scale considered: while the low-energy magnetic dynamics is compatible with a picture of localized moments characterized by bond-dependent (Kitaev) interactions, QMOs are the effective building blocks of the physics at binding energies larger than . More in general, the interplay of the on-site and SOC intrinsically leads to the intertwining between the magnetic order and the high-energy electronic states in multi-orbital systems, independently of the formation of QMOs. Therefore, the possibility of mapping the demagnetization processes onto specific optical transitions in the near-infrared/visible energy range could be extended to a variety of correlated materials and frustrated magnets, such as pyrochlore iridates and other systems that exhibit exotic spin-liquid phases driven by Kitaev interactions. Conversely, the resonant excitation of QMOs or other large binding-energy electronic states in relativistic correlated materials on a timescale faster than the coupling to the magnetic degrees of freedom can be used to trigger novel emergent excitations that can interact with a cold magnetic background and can be directly accessed by ultrafast techniques.
We thank M. Capone, I. Elfimov, G. Jackeli, G. Khaliullin, I. Mazin for fruitful discussions. C.G., F.B. and G.F. acknowledge support from Università Cattolica del Sacro Cuore through D1, D.2.2 and D.3.1 grants.F.B. acknowledges financial support from the MIUR Futuro in ricerca 2013 Grant in the frame of the ULTRANANO Project (project number: RBFR13NEA4) and from Fondazione E.U.L.O. The work at Augsburg University is supported by the German Science Foundation through projects TRR-80 and SPP 1666. The work at UBC was supported by the Killam, A. P. Sloan, A. von Humboldt, and NSERC’s Steacie Memorial Fellowships (A.D.), the Canada Research Chairs Program (A.D.), NSERC, CFI and CIFAR Quantum Materials. Y.S. acknowledges DST, India for support.
References
- Balents (2010) L. Balents, Nature 464, 199 (2010).
- Pesin and Balents (2010) D. Pesin and L. Balents, Nature Physics 6, 376 (2010).
- Tokiwa et al. (2014) Y. Tokiwa, J. J. Ishikawa, S. Nakatsuji, and P. Gegenwart, Nature Materials 13, 8 (2014).
- Hwan Chun et al. (2015) S. Hwan Chun, J.-W. Kim, J. Kim, H. Zheng, C. C. Stoumpos, C. D. Malliakas, J. F. Mitchell, K. Mehlawat, Y. Singh, Y. Choi, T. Gog, A. Al-Zein, M. M. Sala, M. Krisch, J. Chaloupka, G. Jackeli, G. Khaliullin, and B. J. Kim, Nat. Phys. 11, 462 (2015).
- Dean et al. (2016) M. P. M. Dean, Y. Cao, X. Liu, S. Wall, D. Zhu, R. Mankowsky, V. Thampy, X. M. Chen, J. G. Vale, D. Casa, J. Kim, A. H. Said, P. Juhas, R. Alonso-Mori, J. M. Glownia, A. Robert, J. Robinson, M. Sikorski, S. Song, M. Kozina, H. Lemke, L. Patthey, S. Owada, T. Katayama, M. Yabashi, Y. Tanaka, T. Togashi, J. Liu, C. Rayan Serrao, B. J. Kim, L. Huber, C.-L. Chang, D. F. McMorrow, M. Forst, and J. P. Hill, Nat. Mater. 15, 601 (2016).
- Kirilyuk et al. (2010) A. Kirilyuk, A. Kimel, and T. Rasing, Reviews of Modern Physics 82, 2731 (2010).
- (7) Kubacka, T. et al., Science 343, 1333 (2014).
- Giannetti et al. (2016) C. Giannetti, M. Capone, D. Fausti, M. Fabrizio, F. Parmigiani, and M. Mihailovic, Advances in Physics 65, 58 (2016).
- Kim et al. (2008) B. J. Kim, H. Jin, S. J. Moon, J.-Y. Kim, B.-G. Park, C. S. Leem, J. Yu, T. W. Noh, C. Kim, S.-J. Oh, J.-H. Park, V. Durairaj, G. Cao, and E. Rotenberg, Phys. Rev. Lett. 101, 076402 (2008).
- Jackeli and Khaliullin (2009) G. Jackeli and G. Khaliullin, Phys. Rev. Lett. 102, 017205 (2009).
- Shitade et al. (2009) A. Shitade, H. Katsura, J. Kuneš, X.-L. Qi, S.-C. Zhang, and N. Nagaosa, Phys. Rev. Lett. 102, 256403 (2009).
- Comin et al. (2012) R. Comin, G. Levy, B. Ludbrook, Z.-H. Zhu, C. N. Veenstra, J. A. Rosen, Y. Singh, P. Gegenwart, D. Stricker, J. N. Hancock, D. van der Marel, I. S. Elfimov, and A. Damascelli, Phys. Rev. Lett. 109, 266406 (2012).
- Alpichshev et al. (2015) Z. Alpichshev, F. Mahmood, G. Cao, and N. Gedik, Phys. Rev. Lett. 114, 017203 (2015).
- Hinton et al. (2015) J. P. Hinton, S. Patankar, E. Thewalt, A. Ruiz, G. Lopez, N. Breznay, A. Vishwanath, J. Analytis, J. Orenstein, J. D. Koralek, and I. Kimchi, Phys. Rev. B 92, 115154 (2015).
- Felner and Bradaric (2002) I. Felner and I. Bradaric, Physica B: Condensed Matter 311, 195 (2002).
- Kobayashi et al. (2003) H. Kobayashi, M. Tabuchi, M. Shikano, H. Kageyama, and R. Kanno, J. Mater. Chem. 13, 957 (2003).
- Singh and Gegenwart (2010) Y. Singh and P. Gegenwart, Phys. Rev. B 82, 064412 (2010).
- Chaloupka et al. (2010) J. Chaloupka, G. Jackeli, and G. Khaliullin, Phys. Rev. Lett. 105, 027204 (2010).
- Chaloupka et al. (2013) J. Chaloupka, G. Jackeli, and G. Khaliullin, Phys. Rev. Lett. 110, 097204 (2013).
- Ye et al. (2012) F. Ye, S. Chi, H. Cao, B. C. Chakoumakos, J. A. Fernandez-Baca, R. Custelcean, T. F. Qi, O. B. Korneta, and G. Cao, Phys. Rev. B 85, 180403 (2012).
- Choi et al. (2012) S. K. Choi, R. Coldea, A. N. Kolmogorov, T. Lancaster, I. I. Mazin, S. J. Blundell, P. G. Radaelli, Y. Singh, P. Gegenwart, K. R. Choi, S.-W. Cheong, P. J. Baker, C. Stock, and J. Taylor, Phys. Rev. Lett. 108, 127204 (2012).
- Mazin et al. (2012) I. I. Mazin, H. O. Jeschke, K. Foyevtsova, R. Valentí, and D. I. Khomskii, Phys. Rev. Lett. 109, 197201 (2012).
- Foyevtsova et al. (2013) K. Foyevtsova, H. O. Jeschke, I. I. Mazin, D. I. Khomskii, and R. Valentí, Phys. Rev. B 88, 035107 (2013).
- Li et al. (2015) Y. Li, K. Foyevtsova, H. O. Jeschke, and R. Valentí, Phys. Rev. B 91, 161101 (2015).
- Giannetti et al. (2011) C. Giannetti, F. Cilento, S. D. Conte, G. Coslovich, G. Ferrini, H. Molegraaf, M. Raichle, R. Liang, H. Eisaki, M. Greven, A. Damascelli, D. van der Marel, and F. Parmigiani, Nat. Commun. 2, 353 (2011).
- Cilento et al. (2010) F. Cilento, C. Giannetti, G. Ferrini, S. Dal Conte, T. Sala, G. Coslovich, M. Rini, A. Cavalleri, and F. Parmigiani, Applied Physics Letters 96, 021102 (2010).
- (27) See Supplemental Material at [] for technical details on the DFT calculations, including the relation between the optical conductivity and the calculated band-structure, as well as additional details on the differential fitting and on the experiment, including the effect of local heating and the sub-ps dynamics.
- Sun et al. (1994) C.-K. Sun, F. Vallée, L. H. Acioli, E. P. Ippen, and J. G. Fujimoto, Phys. Rev. B 50, 15337 (1994).
- Mazin et al. (2013) I. I. Mazin, S. Manni, K. Foyevtsova, H. O. Jeschke, P. Gegenwart, and R. Valentí, Phys. Rev. B 88, 035115 (2013).
Supplementary Materials
 |
 |
 |
 |
 |
 |
 |
 |
I DFT calculations
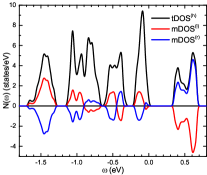
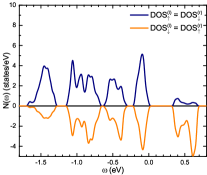
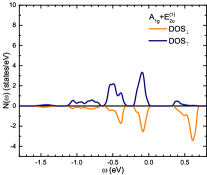
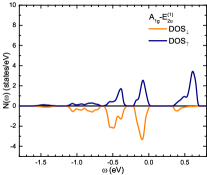
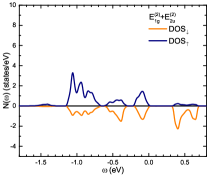
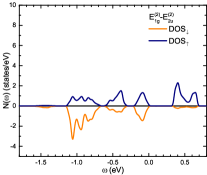
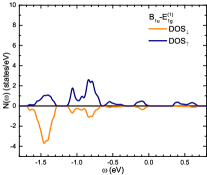
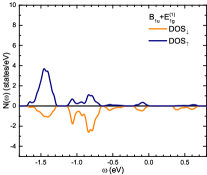
In Fig. S1, we report the details of the density of states (DOS) calculated by DFT+U+SO. Panel (a) reports the total (t) DOS per spin on one hexagon (h) [tDOS(h) = (DOS-DOS)] together with the net polarization (m) in the left (l) and right (r) half of the hexagon [mDOS(l,r) = DOS-DOS]. In the tDOS(h), the five structures (one quite large centered at coming from the overlap of two smaller structures) are reminiscent of the six original QMOs. It is also evident the full polarization of the empty states and the more diffused (in energy) polarization of the occupied states per half of the hexagon suggesting a spatial arrangement of the magnetic moments fully compatible with the zig-zag order. For the sake of completeness, in panel (b), we also report the spin-up and spin-down components of the DOS on the left and right half of the same hexagon [DOS] that lead to the net polarizations in panel (a). In panels (c-h), we report the spin-up and spin-down components of the DOS of the six combinations of QMOs defined in the main text in order to better estimate the regions in energy where they overlap, independently of the value of their net polarizations (reported in Fig. 1 of the main text).
By matching the DOS reported in Fig. S1 to the polarization shown in Figure 3 of the main text, it is possible to link the ground state zig-zag pattern to the combinations of QMOS described above. The modes are mostly confined to binding energies of the order of , with a resulting very small overlap with the states at the Fermi level (Fig. S1), and feature a quite small overall net polarization (DOS-DOS shown in Fig. 3 of the main text). Instead, the modes, which are mainly located at binding energy, are almost fully polarized according to the zig-zag pattern (dark red curves in Fig. 3). Furthermore, they are characterized by a non-zero overlap with both the occupied states right below the Fermi level and the empty states at (Fig. S1), thus constituting a possible bridge between high-energy QMOs and the local magnetic dynamics that involve the low-energy degrees of freedom. However, when we move closer to the Fermi level, the full DOS is recovered only by considering also the contribution of the modes, which are fully polarized (dark green curves in Fig. 3) and extend in energy from to (see Fig. S1). The necessity of including more than one QMO combination ( and ) to describe the valence (LHB, in the Hubbard description) and the conduction (UHB) bands, suggests that the QMO picture, which captures the main features of the deep electronic states, is less efficient to describe the physics of the low-energy electronic excitations.
II dielectric function and differential fitting
Figure S2b reports the 300 K optical conductivity (grey line, from Ref. 12) of Na2IrO3. The function is reproduced (black line) by a multi-Lorentzian fit. The number of oscillators that optimizes the fit is five, labeled with capital letters from A to E. The output parameters of the fitting procedure are reported in Table I. The five oscillators correspond to the possible optical transitions involving the DFT-calculated QMOs (see top panel of Fig. S2). For sake of comparison, Fig. S2b) reports the optical conductivity calculated within DFT in Ref. 24. We stress the one-to-one correspondence of the four structures (labeled 1-4) present in the calculated optical conductivity and the Lorentz oscillators used in the dielectric function model shown in Fig. S2a. The intensity of the transitions (1-4 in the calculated , A-E in the experimental ) can be rationalized on the basis of symmetry arguments involving the parities of the initial and final QMOs involved in the optical transitions Li et al. (2015). The asymmetric peak 3 in the calculated optical conductivity (Fig. S2c) is accounted for by two different Lorentz oscillators (C and D, Fig. S2b). These structures are reminiscent of the spin-orbit induced lift of degeneracy of the QMOs and can be microscopically explained by projecting the total density of states onto the and combinations, as showed in Fig. 3 of the main text. While the C transition involves initial states of symmetry that are polarized oppositely to the zig-zag magnetic ground state, the D oscillator accounts for transitions involving the combination that is fully polarized according to the zig-zag pattern. As argued in the main text, the photo-induced perturbation of the zig-zag magnetic order is expected to particularly affect the QMO combination that exhibits the same spatial pattern and spin-polarization of the magnetic ground state. As a natural consequence, the differential reflectivity shown in Fig. 3 of the main text can be very well reproduced by simply assuming a photo-induced modification of the strength and position of the oscillator D.
| Na2IrO3 static optical parameters T K | |||
|---|---|---|---|
| Position (eV) | Plasma Frequency (eV) | Width (eV) | |
| A | 0.75 | 0.46 | 0.14 |
| B | 1.08 | 0.36 | 0.17 |
| C | 1.39 | 2.88 | 0.99 |
| D | 1.65 | 1.097 | 0.32 |
| E | 1.97 | 0.77 | 0.46 |
III impulsive heating
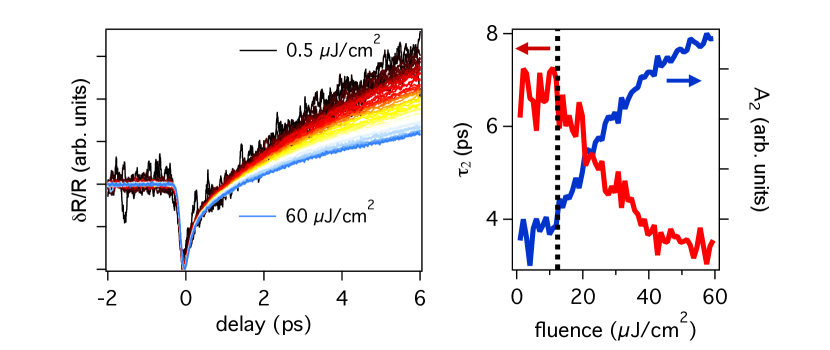
The laser induced local heating of the sample is an important issue that should be addressed to properly interpret the low-temperature dynamics. While the average heating was controlled by tuning the repetition rate of the Ti:sapphire cavity, the impulsive heating induced by the single pulse was empirically addressed by performing single-color (=1.55 eV) pump-probe measurements in a very broad excitation range. In the left panel of Fig. S3, we report the (t) signal, normalized to the amplitude of the fast component, at different excitation fluences (0.5-60 J/cm2). For each pump fluence, the amplitude (A2) and decay dynamics () of the slow component is obtained by performing the two-exponential fitting described in the main text. The values of and A2 are constant up to a threshold fluence of about 12 J/cm2. Above this value, the A2 signal reduces suggesting a progressive onset of impulsive thermal effects.
The temperature-dependence of the A2 and values reported in Fig. 2 of the main text, has been obtained by fitting single-color pump-probe measurements at a pump fluence of 1 J/cm2. Considering a penetration depth of 100 nm and a heat capacity of 74 mJ/cm3K Singh and Gegenwart (2010), we estimate a negligible impulsive heating of the order of 1 K at a base temperature of 20 K. The estimated impulsive heating increases up to about 3 K at temperatures as low as 10 K. Interestingly, the experimental finding that the A2 and values are constant up to fluences as large as 12 J/cm2, where the impulsive heating is of the order of 10 K, further supports the main claim of the manuscript, i.e., that the A2 component is related to the energy exchange with short-range zig-zag correlations on a length scale of 2 nm, that are more robust than the long-range 3D order.
IV sub-ps dynamics
Figure S4 reports the temperature-dependent value of the time constant, as determined from the multi-exponential time-domain fitting described in the main text. The fast relaxation dynamics has an average value of fs and it does not display any significant variation when the magnetic transition at is approached.