IGR J18293–1213 is an eclipsing Cataclysmic Variable
Abstract
Studying the population of faint hard X-ray sources along the plane of the Galaxy is challenging because of high-extinction and crowding, which make the identification of individual sources more difficult. IGR J18293–1213 is part of the population of persistent sources which have been discovered by the INTEGRAL satellite. We report on NuSTAR and Swift/XRT observations of this source, performed on 2015 September 11. We detected three eclipsing intervals in the NuSTAR light curve, allowing us to constrain the duration of these eclipses, min, and the orbital period of the system, hr. Even though we only report an upper limit on the amplitude of a putative spin modulation, the orbital period and the hard thermal Bremsstrahlung spectrum of IGR J18293–1213 provide strong evidence that this source is a magnetic Cataclysmic Variable (CV). Our NuSTAR and Swift/XRT joint spectral analysis places strong constraints on the white dwarf mass M⊙. Assuming that the mass to radius ratio of the companion star (solar units) and using , and , we derived the mass of the companion star M⊙, the orbital separation of the binary system R⊙, and its orbital inclination compared to the line of sight °.
keywords:
stars: individual (IGR J18293–1213), white dwarfs, X-rays: stars1 Introduction
The INTEGRAL mission (Winkler et al., 2003) has been surveying the hard X-ray sky for more than a decade, detecting close to a thousand sources (see Bird et al., 2016, for the most recent catalog). About half of these detections are in the direction of the Galactic plane (°, Krivonos et al., 2012) and among those, two dozen sources are reported as unidentified persistent sources, with a 17–60 keV flux below the 0.7 mCrab limit of the INTEGRAL survey (e.g. Lutovinov et al., 2013). The goal of the ‘Unidentified INTEGRAL sources’ legacy program conducted by the Nuclear Spectroscopic Telescope Array (NuSTAR) is to take full advantage of the better sensitivity and the higher spatial resolution of this instrument to investigate these faint persistent sources using detailed spectral and variability analyses. These individual identifications will help to characterize the population of faint hard X-ray sources in the Galaxy by improving the completeness of the current sample.
Faint Galactic sources with hard X-ray spectra are likely to be either Cataclysmic Variables (CVs), Low Mass X-ray Binaries (LMXBs) or High Mass X-ray Binaries (HMXBs). These three types of sources are accreting compact binaries. However, the nature of the accretion onto the compact object, a white dwarf for CVs and a neutron star or a black hole for LMXBs and HMXBs, is responsible for different orbital parameters and different emission processes. These differences can be used to discriminate between these three categories of hard X-ray sources (see Kuulkers et al., 2006; Tauris & van den Heuvel, 2006, for detailed reviews on their properties).
IGR J18293–1213 has been reported in successive INTEGRAL/IBIS catalogs (Krivonos et al., 2010; Krivonos et al., 2012; Bird et al., 2016). A Swift/XRT position and spectrum were also obtained for this source (Landi et al., 2010) and its Chandra and near-infrared counterparts have been identified (Karasev et al., 2012). However, these observations did not allow for a conclusive identification of the nature of this source. IGR J18293–1213 was therefore part of the list proposed for the ‘Unidentified INTEGRAL sources’ NuSTAR legacy survey and was the first one to be observed with NuSTAR and Swift/XRT as part of this program. In the present paper, we describe the corresponding observations and data reductions (Sec. 2). The new constraints we obtained using both the light curve (Sec. 3.1) and the spectra (Sec. 3.2) of IGR J18293–1213 are sufficient to identify this source as an Intermediate Polar (IP, a subcategory of CVs), and to constrain the orbital parameters of this system (Sec. 4). These results are discussed in Sec. 5.
2 Observations and data reduction
The NuSTAR legacy program observations of IGR J18293–1213 were performed on 2015 September 11, and are summarized in Table 1.
| Mission/Instrument | Obs. ID | Start Time (UT) | End Time (UT) | Clean exposure (ks) |
|---|---|---|---|---|
| NuSTAR/FPMA&B | 30161002 | 2015-09-11 10:56:08 | 2015-09-12 04:06:08 | 25.71∗ |
| Swift/XRT | 00081763001 | 2015-09-11 16:32:55 | 2015-09-11 18:20:54 | 1.89 |
∗ The NuSTAR effective exposure used for the spectral analysis (excluding the eclipse intervals) is 23.07 ks.
Our data set is composed of two observations made with the two co-aligned X-ray telescopes on board the NuSTAR mission, both of which cover the 3–79 keV energy range (Harrison et al., 2013). We also obtained a short observation with the Swift (Gehrels et al., 2004) X-ray telescope (XRT; Burrows et al., 2005) covering the 0.5–10 keV energy range.
2.1 NuSTAR
We reduced the NuSTAR data using NuSTARDAS v.1.5.1 which is part of HEASOFT 6.17, setting saamode=strict and tentacle=yes in order to better remove the time intervals having an enhanced count rate due to the contamination created by the South Atlantic Anomaly (SAA).
2.1.1 Further cleaning of the SAA contamination
The SAA contamination was not fully removed by the automated procedure and could be seen as multiple periods with increased count rates. In order to remove the corresponding periods from the Good Time Intervals (GTI), we extracted the light curve of the whole detector for both NuSTAR focal plane modules (FPMA & FPMB), using a binning of 10 s. We then removed from the GTI all bins which had an exposure fraction lower than 0.8 and all continuous bins which were at least 1.5 above the average count rate, simultaneously in both FPMA and FPMB. This last step was iterated twice in order to correct for any artificial increase of the average count rate created by the SAA contamination.
2.1.2 Light curve and spectral extraction
We extracted the source light curves and spectra from a circular region having a 60′′ radius and centered on the Chandra position of IGR J18293–1213 (, , J2000)111The NuSTAR detection is in agreement with the Chandra position, within the systematic uncertainties of a few arcseconds.. The background light curves and spectra were extracted from a circular region having a 100′′ radius and located at the other end of the source detector chip.
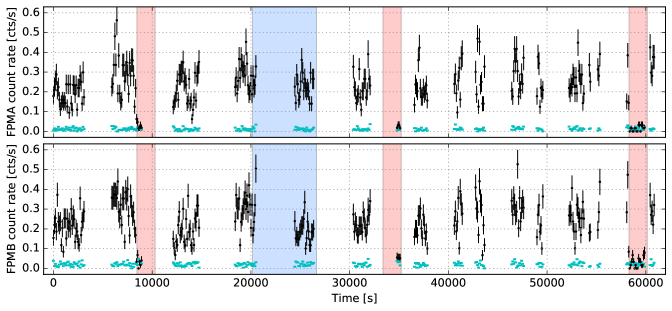
We applied the barycenter correction to the photon arrival times by setting barycorr=yes, to create both the event files used to constrain the variability of the source, and the light curves. Unless stated otherwise, the source light curves are not background subtracted, but are presented along with the background light curves scaled to the area covered by the source region. The source lightcurves are shown with the gaussian 1 error bars which lead to an underestimation of the corresponding uncertainties for small bins at low count rates (e.g. during the eclipse periods, Fig. 1, bottom panel). However, these error bars are only used for display purposes, while variability studies are mainly based on the event files (Sec. 3.1).
The spectra were extracted after removing the eclipse time intervals (Sec. 3.1) from the GTI to improve the signal-to-noise ratio. Then, each spectrum was grouped to reach at least a 5 significance in each energy bin, except for the highest energy ones for which we have a significance of 3.3 (31.72–79 keV) and 3.2 (25.96–79 keV), for FPMA and FPMB, respectively.
2.2 Swift
The Swift/XRT was operated in Photon Counting (PC) mode and the corresponding data were reduced using HEASOFT v6.17. For the source, we extracted a spectrum from a 30′′ radius centered on IGR J18293–1213. We also made a background spectrum using an annulus with inner and outer radii of 60′′ and 300′′, respectively. We obtained a source count rate of cts s-1 (0.5–10 keV). We used the most recent response matrix for a spectrum in PC mode (swxpc0to12s6_20130101v014.rmf), and we used xrtmkarf with an exposure map to make the ancillary response file. Finally, we grouped the spectrum by requiring bins in which the source is detected at the 3.4 level or higher except for the highest energy bin (6.3–10 keV) which has a significance of 1.9 .
3 New constraints on IGR J18293–1213
Using the NuSTAR light curve of IGR J18293–1213 we are able to put strong constraints on the eclipse parameters (Sec. 3.1). This is the first time eclipses have been reported for this system. The Swift and NuSTAR joint spectral analysis give additional constraints on the nature and the parameters of this binary system (Sec. 3.2).
3.1 Light curve including eclipses
The source and background light curves are presented in Fig. 1 (top panels). Within each NuSTAR module, the source count rate is compatible with a constant emission ( cts s-1), apart from three intervals during which its flux drops to the background emission level ( cts s-1).
3.1.1 Bayesian block analysis
In order to get precise start and stop times of the eclipsing periods (i.e. independent of the light curve binning) we used the source event file including all events detected in FPMA or FPMB during their common GTI, and relied on the Bayesian block analysis described by Scargle et al. (2013) and provided by P. K. G. Williams222https://github.com/pkgw/pwkit/blob/master/pwkit/bblocks.py. This method models the continuous light curve (i.e. ignoring the numerous gaps present in our data set) with a succession of blocks having constant count rates, and it finds the optimal location for the transition times. The overall description of the light curve depends on the probability of detecting a fake extraneous block. The parameter is an estimation of this probability and it was set to 0.05 for our analysis. Among the ten blocks we detected, only three are compatible with the background level. The corresponding time intervals are given in Table 2, and they match the three low count-rate periods seen in the light curves (Fig. 1).
| Eclipse block | (s) | (s) |
|---|---|---|
| 1 | 8449 | 9048∗ |
| 2 | 34824∗ | 35220 |
| 3 | 58300 | 59954∗ |
∗ These transitions are associated with large exposure gaps (see Fig. 1): they cannot be used to derive the eclipse parameters.
3.1.2 Eclipse parameters
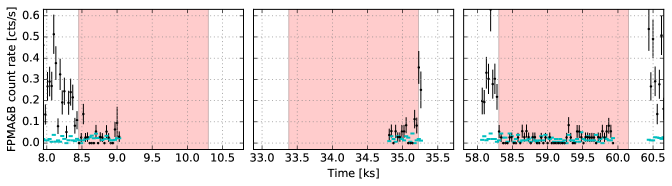
The Bayesian block description ignores the observation gaps, so only the transitions detected within a continuous observation interval can be used to derive the parameters of the eclipsing signal. In particular, the three eclipses we detected are only partially covered by the NuSTAR effective exposure (Fig. 1, bottom panels, and Table 2). Therefore, assuming that the eclipsing signal is periodic, we used the starting times of the first and third eclipse and the ending time of the second eclipse in order to derive the eclipse properties.
The Bayesian block analysis does not provide any uncertainty for these transition times. However, in the present work these uncertainties are dominated by the systematic error linked to the shape chosen to fit the eclipse (Fig. 1, bottom panels). Using the unweighted light curve with 30 s bins, we tested models including a linear transition between the detection and the non detection periods. A slow transition of about 500 s seems to be relevant to fit the shape of the first eclipse we detected, leading to a starting time shift of about 90 s. For the others, the transition seems to be faster (less than 100 s) and the transition time is better constrained. However, the second eclipse may not have sufficient coverage to properly fit a linear transition, and, adding information from the third eclipse, we constrained the stopping time shift to be less than 290 s. Therefore, we fix the systematic errors to be and s, where and are the Bayesian block values listed in Table 2.
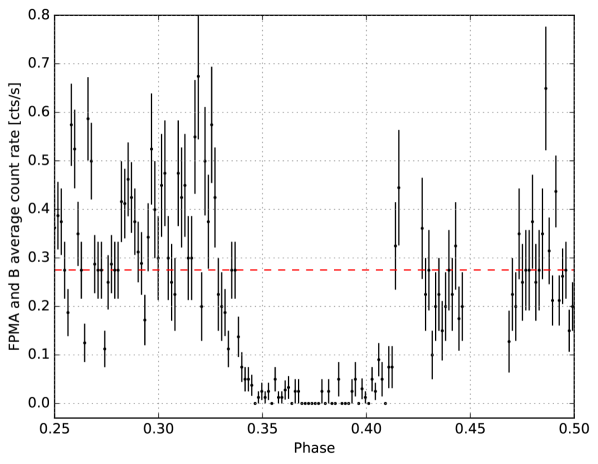
Using these values and their systematic errors, we obtained the duration of the eclipse, min, and the signal period, hr. The eclipse profile obtained by folding the light curve on IGR J18293–1213’s orbital period is shown in Fig. 2. A shorter period is excluded by the detection of the source within at least one of the putative additional eclipse intervals, e.g. the detection in the 46300–47700 s interval excludes the possibility that the period is twice as short (Fig. 1, top panels).
The short orbital period we detected for IGR J18293–1213 is a strong indication that this system is either a CV or an LMXB. Indeed, the majority of known CVs have orbital periods of a few hours and LMXBs of the order of a day or less, while HMXBs are generally observed with orbital periods of a few days or more (e.g. Kuulkers et al., 2006; Tauris & van den Heuvel, 2006).
3.1.3 Upper limit on spin modulation
Modulations at the spin period, caused by the variation of photoelectric absorption and/or self-occultation, have been observed in several CVs. In order to search for such a short periodic signal, we made NuSTAR light curves in the 3–24 keV energy range using 0.05 s time bins and combining the counts from FPMA and FPMB. We extracted counts from the same source and background regions used for spectral analysis. We also used the same GTI as for the spectral analysis; thus, the eclipse times were removed.
We used the (Rayleigh) test (Buccheri et al., 1983) to search for signals, making a periodogram extending from 0.0001 Hz (10,000 s) to the Nyquist frequency (10 Hz). From 0.1 to about 750 s, there are no signals that reach the 3 significance threshold (after accounting for trials). Although there is a 3 peak at 769 s, it is the first of a series of peaks that increase in significance with increasing period, and we suspect that we are simply seeing evidence for aperiodic variability (Fig. 3).
To determine the upper limit on the strength of a periodic signal, we folded the background subtracted light curve on 10,000 frequencies between 0.0001 Hz (10,000 s) and 1 Hz (1 s) using ten phase bins. For each trial frequency, we recorded the value obtained when fitting a constant and also the amplitude of the folded light curve in terms of the maximum count rate minus the minimum count rate divided by the sum of these two quantities. From 1 s to 1000 s, 95% of the trials have amplitudes below 9.2%, indicating that this is the 2 upper limit on periodic signals in the 3–24 keV band. From 1000 s to 10,000 s, the highest amplitude is 194% (1 error), indicating a 2 upper limit of 27%. The implication of this upper limit will be discussed in Sec. 5.

3.2 Spectrum compatible with a CV
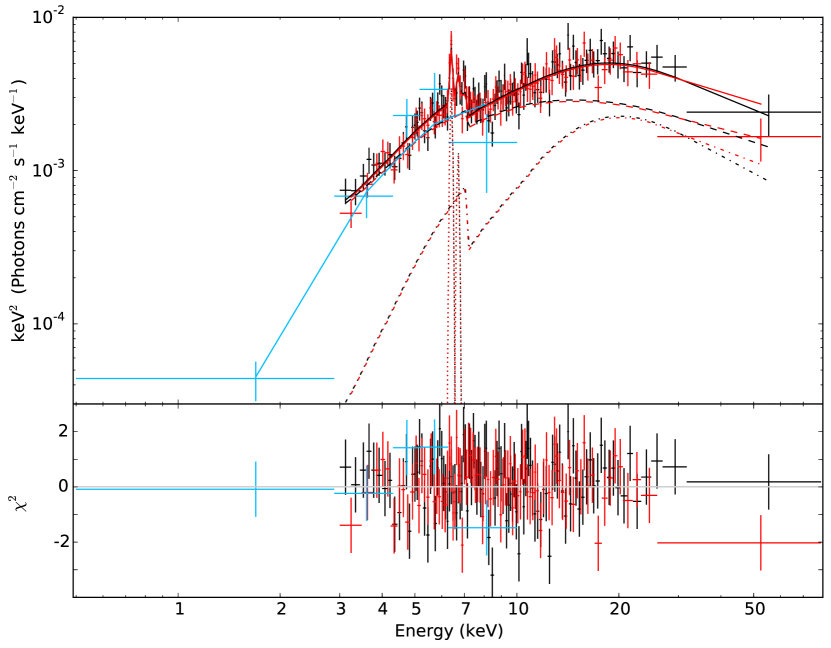
The NuSTAR and Swift/XRT joint spectrum of IGR J18293–1213 is presented in Fig. 4. All the model fits were performed using XSPEC v.12.9.0. A simple absorbed power-law poorly fits the data (/d.o.f. = 277.7/193), and the residuals highlight the presence of a high-energy cutoff and of a Gaussian emission line around 6.5 keV. Including these two additional components to the model leads to a good fit (/d.o.f. = 185.1/190) with a photon index . With such a hard spectrum, this source cannot be an LMXB and IGR J18293–1213 is therefore likely to be a CV (see Sec. 3.1.2 and Tauris & van den Heuvel, 2006).
The spectrum of this category of sources is generally fitted with an absorbed Bremsstrahlung model, a Gaussian line to account for the iron-line complex around 6.5 keV and sometimes an additional partial covering absorption component (e.g. Suleimanov et al., 2005; Mukai et al., 2015). For IGR J18293–1213, a partial covering component is needed (/d.o.f. = 298.4/191 down to 180.9/189 when pcfabs is added), and the Bremsstrahlung temperature given by the best fit is keV. Such a high temperature is a strong indication that this source is a magnetic CV (non-magnetic CV are characterized by lower temperatures, – keV, Kuulkers et al., 2006).
Among magnetic CVs, there are two subcategories: Polars and Intermediate Polars (IPs), based on the strength of the white dwarf magnetic field, strong and intermediate, respectively (Kuulkers et al., 2006). The hardness of IGR J18293–1213’s spectrum, the relatively high luminosity of this source, its rather long orbital period and the absence of visible variability in its light curve are strong indications that IGR J18293–1213 is an IP (see Sec. 5 for more details).
3.2.1 IP spectral model
In IPs, accreted material, coming from the truncated accretion disk, follows the magnetic field of the white dwarf towards its magnetic poles. It experiences a strong shock before reaching the compact object and then cools on its way down. This column of cooling material produces the main source of X-ray radiation, and we used the spectral model IPM to account for its continuum component (Suleimanov et al., 2005). Part of this emission is reflected onto the surface of the white dwarf, and we used the XSPEC model reflect to represent the continuum emission created by this second process (Magdziarz & Zdziarski, 1995). To account for the iron fluorescence lines which are not included in the previous models, we also added two Gaussian lines to our model. Therefore, the spectral model we used is the following:
| (1) |
where pcfabs takes into account the partial absorption which can be created by the accretion flow itself, and where tbabs models the column density towards the source. The constant const accounts for imprecision in the instruments cross-calibration.
| Model | Param. | Unit | Best Fit |
| tbabs | cm-2 | (fixed) | |
| pcfabs | ,pc | cm-2 | |
| fraction | — | ||
| reflect | — | (fixed) | |
| A | — | ||
| AFe | — | (fixed) | |
| cos | — | ||
| IPM | M⊙ | ||
| F1-79keV | ph cm-2 s-1 | ||
| gauss | E | keV | (fixed) |
| eV | (fixed) | ||
| N | ph cm-2 s-1 | ||
| gauss | E | keV | (fixed) |
| eV | (fixed) | ||
| N | ph cm-2 s-1 |
3.2.2 Constraints on the parameters
After setting the abundances to the values provided by Wilms et al. (2000), the column density towards the source was fixed to cm-2. This is the sum of the hydrogen contribution ( cm-2, average value given by the HEASOFT tool – Leiden/Argentine/Bonn Survey of Galactic HI) and of the molecular contribution ( cm-2, converted from the CO map333The antenna temperature of CO at the position of IGR J18293–1213 is K km s-1. We used this value and the conversion factors, cm-2 K-1 km-1 s and = 2, to obtain the molecular contribution to the total column density, . provided by Dame et al. 2001) estimated in the direction of IGR J18293–1213. When free to vary, this parameter is poorly constrained: cm-2, but the value obtained is consistent with the above estimation.
The intensity of the reflection component depends on the fraction of the X-ray flux intercepted by the white dwarf, which is represented by a solid angle scaled to unity for an isotropic source above a disk extending to infinity. When left free, this parameter reaches , which is not physical for the source we consider. Therefore, we fixed this parameter to 1, i.e. to the highest meaningful value. In addition, the abundance of iron, AFe, was set to 1 compared to the abundance of elements heavier than helium, A, so the global abundance of the reflecting material can be directly compared to that of the sun.
The Gaussian line energies were fixed to 6.4 and 6.7 keV to account for the fluorescent lines Fe K and Fe xxv, respectively. In CVs these emission lines are observed to be relatively narrow (e.g. Hellier & Mukai, 2004; Hayashi et al., 2011), so we fixed their widths to 50 eV.
The other parameters are free to vary within the default range allowed by the corresponding XSPEC models. The fit is satisfactory (/d.o.f. = 177.6/188) and, except for the 6.7 keV emission line, all components listed in the model are statistically required (removing the partial covering absorption or the reflection component lead to fits having /d.o.f. = 315.8/190 and /d.o.f. = 213.7/190, respectively). The results are shown in Fig. 4 and in Table 3. The parameters of the IPM model are well constrained by the fit and the white dwarf mass we obtain, M⊙, is consistent with the typical mass generally observed for white dwarfs in IPs (e.g. Suleimanov et al., 2005; Yuasa et al., 2010; Hailey et al., 2016). In our system, the free parameter of the reflect model is the inclination of the white dwarf magnetic field compared to the line of sight. The fit only gives an upper limit ° for this parameter. Finally, of the two emission lines added to our model, only the 6.4 keV line is significantly detected. Its equivalent width is eV, which is in the range of values typically reported for this type of source (e.g. Hellier & Mukai, 2004). The 6.7 keV emission line is only marginally detected in our data set, so we report an upper limit on its normalization. Removing this component from our model does not change the continuum model parameters, except for the abundance of the reflection model which is then constrained to values less than solar.
4 Parameters of the binary system
Using the duration and the period of the eclipse, as well as the white dwarf mass constraints obtained in Sec. 3, we are able to derive precise orbital parameters for the corresponding binary system.
4.1 Binary system equations
The binary system is composed of a white dwarf of mass and a companion star of mass and of radius . In IPs, there is evidence that the companion star is filling its Roche lobe, which means that its orbit should circularize on a short time scale (e.g. Hurley et al., 2002). Therefore, we assume that our system has a circular orbit with an orbital separation and an inclination compared to our line of sight (with ° corresponding to an edge-on system).
From Kepler’s equations, we derive the following two relations,
| (2) |
| (3) |
where and refer to the duration and the period of the eclipse, respectively (Sec. 3.1) and is the gravitational constant.
As already stated, the companion star is filling its Roche lobe, so we also use the approximation of Eggleton (1983) to describe its radius,
| (4) |
Finally, the donor mass and radius follow an empirical relation derived by Patterson (1984). The corresponding relation is discontinuous at M⊙ but can be approximated by,
| (5) |
4.2 IGR J18293–1213 system parameters
Using the parameters of the eclipse, and , derived in Sec. 3.1, we numerically solved the system of equations introduced in Sec. 4.1. The results are presented as functions of the system inclination (Fig. 5). We restricted the parameter space to the standard white dwarf mass range, – M⊙, which corresponds to an orbital inclination –°, an orbital separation – R⊙, and a mass – M⊙ for the companion star.
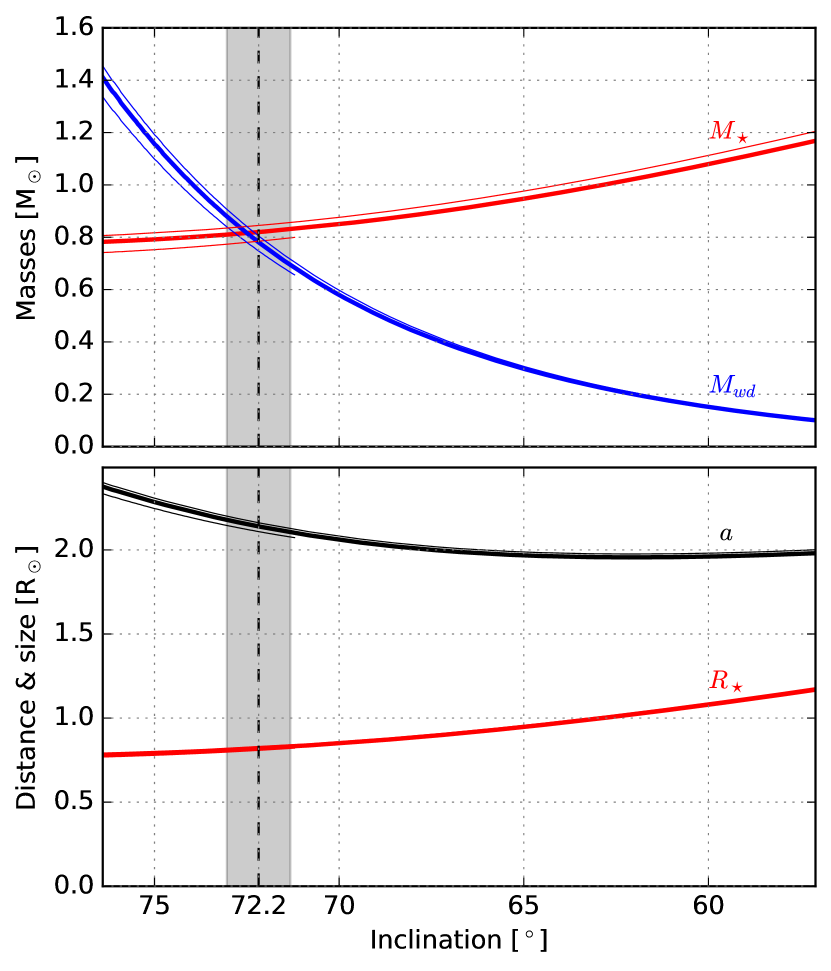
The parameters of the IGR J18293–1213 binary system can then be fully constrained by using the mass of the white dwarf obtained from our spectral analysis (see Table 3 and Fig. 5). Thus, their precise values are: M⊙, M⊙, R⊙, R⊙, and °. The uncertainties listed here only account for the propagation of the errors on the white dwarf mass through the system of equations presented in Sec. 4.1.
The systematic errors derived for the orbital period and the eclipse duration do not significantly change the constraints we obtain on the system parameters, except for the orbital inclination. As the eclipse duration increases, the curves presented in Fig. 5 shift towards higher inclination angles, leading to an inclination ° when the eclipse duration reaches its upper limit min.
We also tested the approximation we made by using eq. (5) instead of the empirical mass-radius relations given by Patterson (1984, eq. 3). We solved our system of equations (2, 3, and 4) using both parts of his relation: (i) M⊙ and (ii) M⊙, and the results are plotted in Fig. 5. As the relation of Patterson (1984) is discontinuous, both regimes (i) and (ii) can be verified for IGR J18293–1213. The parameters derived for the best fit white dwarf mass are within the error bars listed previously, except for . The mass of the donor would be 0.78 or 0.85 M⊙ in regime (i) and (ii), respectively.
5 Discussion and Conclusions
Based on the orbital and spectral parameters we derived using the NuSTAR legacy program observations, we identified IGR J18293–1213 as an eclipsing Intermediate Polar. The inclination we derived for this source, °, is consistent with the expectation that the system is close to being edge-on, based on the eclipses we detected. In this case, any strong misalignment between the orbital inclination and the magnetic field inclination would produce a self-occultation of the X-ray source at the white dwarf spin period444The X-ray emission is mainly created close to the magnetic poles of the white dwarf (see Sec. 3.2.1).. Therefore, the non-detection of spin modulation might be an indication that the orbit and the magnetic field inclinations are not far apart (i.e. the inclination of the magnetic field could be close to the upper limit derived from the spectral analysis, °).
The white dwarf mass M⊙ of this system is close to the average values published for the brightest known IPs (e.g. Suleimanov et al., 2005; Yuasa et al., 2010; Hailey et al., 2016). The average X-ray luminosity of this bright population is erg s-1 and IGR J18293–1213 would reach this luminosity if located at a distance kpc. The high Galactic absorption anticipated from the source spectrum is compatible with such a large distance and this is therefore strong evidence that IGR J18293–1213 is not a Polar, since Polars tend to have lower accretion rates and therefore lower luminosities ( erg s-1, Sazonov et al., 2006). Furthermore, a distance of several kiloparsecs explains the relative faintness of IGR J18293–1213 compared to the previously identified IPs for which kpc (Suleimanov et al., 2005, and references therein). In addition, the sample of known IPs is probably not representative of the whole population. Indeed, the properties of the faint population of magnetic CVs can be investigated through their putative contribution to the Galactic Ridge X-ray emission: an average mass of about 0.5 M⊙ is anticipated for these unresolved sources in order to explain the level of emission measured in the hard X-rays (Krivonos et al., 2007, and references therein). In this case, IGR J18293–1213 would be on the higher end of the IPs’ mass distribution, even if populations with masses larger than 0.9 M⊙ have also been anticipated in the Galactic center region (Perez et al., 2015; Hong et al., 2016) and if systems with masses close to the Chandrasekhar limit have been reported (e.g. Tomsick et al., 2016).
The donor star mass and radius, M⊙ and R⊙, are compatible with the star being of type K, similar to those observed in other CVs having similar orbital periods (e.g. Knigge, 2006). The near-IR counterpart reported by Karasev et al. (2012)555From the UKIDSS-DR6 Galactic plane survey catalog, the near-IR counterpart of IGR J18293–1213 is observed in three bands (, , ) and is located at , (J2000). cannot be used to confirm this stellar type because, in IPs, this energy range is likely to be dominated by the accretion disk (Knigge, 2006). However, it can provide an independent estimation of the column density towards this source. Assuming a flat intrinsic spectrum and using the conversion factor provided by Cox (2000), we derived the column density cm-2. Such a high extinction is expected for a distant source close to the Galactic plane (Galactic latitude °), and is therefore consistent with what has been inferred from the X-ray observations.
By improving the completeness of the hard X-ray Galactic faint sources, the NuSTAR legacy program ‘Unidentified INTEGRAL sources’ also aims at improving our knowledge of the luminosity functions of the different categories of sources and in particular to address whether there is a faint HMXB population. In this context, IGR J18293–1213 was successfully excluded from this putative population, and several similar observations are being made in order to help the identification of additional faint persistent sources. They will be the subject of future publications.
Acknowledgments
This work was supported under NASA Contract No. NNG08FD60C, and made use of data from the NuSTAR mission, a project led by the California Institute of Technology, managed by the Jet Propulsion Laboratory, and funded by the National Aeronautics and Space Administration. We thank the NuSTAR Operations, Software and Calibration teams for support with the execution and analysis of these observations. This research has made use of the NuSTAR Data Analysis Software (NuSTARDAS) jointly developed by the ASI Science Data Center (ASDC, Italy) and the California Institute of Technology (USA). RK acknowledges support from Russian Science Foundation (grant 14-22-00271). GP acknowledges the Bundesministerium für Wirtschaft und Technologie/Deutsches Zentrum für Luftund Raumfahrt (BMWI/DLR, FKZ 50 OR 1408).
References
- Bird et al. (2016) Bird A. J., Bazzano A., Malizia A., Fiocchi M., Sguera V., Bassani L., Hill A. B., Ubertini P., Winkler C., 2016, The Astrophysical Journal Supplement Series, 223, 15
- Buccheri et al. (1983) Buccheri R., Bennett K., Bignami G. F., Bloemen J. B. G. M., Boriakoff V., Caraveo P. A., Hermsen W., Kanbach G., Manchester R. N., Masnou J. L., Mayer-Hasselwander H. A., Ozel M. E., Paul J. A., Sacco B., Scarsi L., Strong A. W., 1983, Astronomy and Astrophysics, 128, 245
- Burrows et al. (2005) Burrows D. N., Hill J. E., Nousek J. A., Kennea J. A., Wells A., Osborne J. P., Abbey A. F., Beardmore A., et al. 2005, Space Science Reviews, 120, 165
- Cox (2000) Cox A. N., 2000, Allen’s astrophysical quantities
- Dame et al. (2001) Dame T. M., Hartmann D., Thaddeus P., 2001, The Astrophysical Journal, 547, 792
- Eggleton (1983) Eggleton P. P., 1983, The Astrophysical Journal, 268, 368
- Gehrels et al. (2004) Gehrels N., Chincarini G., Giommi P., Mason K. O., Nousek J. A., Wells A. A., White N. E., Barthelmy S. D., et al. 2004, The Astrophysical Journal, 611, 1005
- Hailey et al. (2016) Hailey C. J., Mori K., Perez K., Canipe A. M., Hong J., Tomsick J. A., Boggs S. E., Christensen F. E., et al. 2016, The Astrophysical Journal, in press (arXiv:1605.06066)
- Harrison et al. (2013) Harrison F. A., Craig W. W., Christensen F. E., Hailey C. J., Zhang W. W., Boggs S. E., Stern D., et al. 2013, The Astrophysical Journal, 770, 103
- Hayashi et al. (2011) Hayashi T., Ishida M., Terada Y., Bamba A., Shionome T., 2011, PASJ, 63, S739
- Hellier & Mukai (2004) Hellier C., Mukai K., 2004, MNRAS, 352, 1037
- Hong et al. (2016) Hong J., Mori K., Hailey C. J., Nynka M., Zhang S., Gotthelf E., Fornasini F. M., Krivonos R., et al. 2016, The Astrophysical Journal, in press (arXiv:1605.03882)
- Hurley et al. (2002) Hurley J. R., Tout C. A., Pols O. R., 2002, MNRAS, 329, 897
- Karasev et al. (2012) Karasev D. I., Lutovinov A. A., Revnivtsev M. G., Krivonos R. A., 2012, Astronomy Letters, 38, 629
- Knigge (2006) Knigge C., 2006, MNRAS, 373, 484
- Krivonos et al. (2007) Krivonos R., Revnivtsev M., Churazov E., Sazonov S., Grebenev S., Sunyaev R., 2007, Astronomy and Astrophysics, 463, 957
- Krivonos et al. (2012) Krivonos R., Tsygankov S., Lutovinov A., Revnivtsev M., Churazov E., Sunyaev R., 2012, Astronomy and Astrophysics, 545, A27
- Krivonos et al. (2010) Krivonos R., Tsygankov S., Revnivtsev M., Grebenev S., Churazov E., Sunyaev R., 2010, Astronomy and Astrophysics, 523, A61
- Kuulkers et al. (2006) Kuulkers E., Norton A., Schwope A., Warner B., 2006, X-rays from cataclysmic variables. pp 421–460
- Landi et al. (2010) Landi R., Bassani L., Parisi P., Masetti N., Bazzano A., Fiocchi M., Bird A. J., Gehrels N., Kennea J. A., 2010, The Astronomer’s Telegram, 2853
- Lutovinov et al. (2013) Lutovinov A. A., Revnivtsev M. G., Tsygankov S. S., Krivonos R. A., 2013, MNRAS, 431, 327
- Magdziarz & Zdziarski (1995) Magdziarz P., Zdziarski A. A., 1995, MNRAS, 273, 837
- Mukai et al. (2015) Mukai K., Rana V., Bernardini F., de Martino D., 2015, The Astrophysical Journal Letters, 807, L30
- Patterson (1984) Patterson J., 1984, The Astrophysical Journal Supplement Series, 54, 443
- Perez et al. (2015) Perez K., Hailey C. J., Bauer F. E., Krivonos R. A., Mori K., Baganoff F. K., Barrière N. M., et al. 2015, Nature, 520, 646
- Sazonov et al. (2006) Sazonov S., Revnivtsev M., Gilfanov M., Churazov E., Sunyaev R., 2006, Astronomy and Astrophysics, 450, 117
- Scargle et al. (2013) Scargle J. D., Norris J. P., Jackson B., Chiang J., 2013, The Astrophysical Journal, 764, 167
- Suleimanov et al. (2005) Suleimanov V., Revnivtsev M., Ritter H., 2005, Astronomy and Astrophysics, 435, 191
- Tauris & van den Heuvel (2006) Tauris T. M., van den Heuvel E. P. J., 2006, Formation and evolution of compact stellar X-ray sources. pp 623–665
- Tomsick et al. (2016) Tomsick J. A., Rahoui F., Krivonos R., Clavel M., Strader J., Chomiuk L., 2016, MNRAS, in press (arxiv:1604.03562)
- Wilms et al. (2000) Wilms J., Allen A., McCray R., 2000, The Astrophysical Journal, 542, 914
- Winkler et al. (2003) Winkler C., Courvoisier T. J.-L., Di Cocco G., Gehrels N., Giménez A., Grebenev S., Hermsen W., et al. 2003, Astronomy and Astrophysics, 411, L1
- Yuasa et al. (2010) Yuasa T., Nakazawa K., Makishima K., Saitou K., Ishida M., Ebisawa K., Mori H., Yamada S., 2010, Astronomy and Astrophysics, 520, A25