Forming first-ranked early-type galaxies through hierarchical dissipationless merging
Abstract
We have developed a computationally competitive -body model of a previrialized aggregation of galaxies in a flat CDM universe to assess the role of the multiple mergers that take place during the formation stage of such systems in the configuration of the remnants assembled at their centres. An analysis of a suite of 48 simulations of low-mass forming groups () demonstrates that the gravitational dynamics involved in their hierarchical collapse is capable of creating realistic first-ranked galaxies without the aid of dissipative processes. Our simulations indicate that the brightest group galaxies (BGGs) constitute a distinct population from other group members, sketching a scenario in which the assembly path of these objects is dictated largely by the formation of their host system. We detect significant differences in the distribution of Sérsic indices and total magnitudes, as well as a luminosity gap between BGGs and the next brightest galaxy that is positively correlated with the total luminosity of the parent group. Such gaps arise from both the grow of BGGs at the expense of lesser companions and the decrease in the relevance of second-ranked objects in equal measure. This results in a dearth of intermediate-mass galaxies which explains the characteristic central dip detected in their luminosity functions in dynamically young galaxy aggregations. The fact that the basic global properties of our BGGs define a thin mass fundamental plane strikingly similar to that followed giant early-type galaxies in the local universe reinforces confidence in the results obtained.
keywords:
galaxies: elliptical and lenticular, cD – galaxies: formation – galaxies: fundamental parameters – galaxies: interactions – galaxies: luminosity function, mass function – methods: numerical1 Introduction
The brightest group galaxies (BGGs), as well as their cluster counterparts (BCGs; throughout the paper, we use both terms interchangeably), are among the largest known single structures in the universe. They are mostly central passive giant elliptical (gE) galaxies more luminous (and massive) than the average, with NIR luminosities up to 111 is the characteristic luminosity marking the ’knee’ of any NIR-band Schechter (1976) luminosity function (LF) representative of the old stellar population., typical 1D central velocity dispersions –350 km s-1, and very little rotational support. As with prototypical early-type galaxies (ETGs), their light profile is well described by a de Vaucouleurs law over a large range in radii. Some BGGs/BCGs are classified as D (gE possessing a large, diffuse envelope) or cD (extra-large D) galaxies. The latter are extremely large elliptical galaxies sitting near the centres of some rich galaxy clusters which are surrounded by a distinct dynamical stellar subsystem in the form of a very extended low-surface brightness envelope of excess light over and above the profile defined by the inner regions made of old stars (Kormendy, 1989). cDs are purely a rich cluster phenomenon, unlike fossil groups (Ponman et al., 1994), which are isolated and likely relaxed early-formed galaxy aggregations dominated by a central object, sometimes as bright as a rich-cluster cD, surrounded by substantial numbers of lower-luminosity satellites (at least 2 or more magnitudes fainter by definition), all embedded in a common extended halo of X-ray emitting gas the size of a galaxy group. They are thought to result from the extensive merging of all the galaxies contained within a small group, with the extended X-ray halo providing strong evidence for the group origin. This has lead some to theorize that cD clusters may result from the creation first of a fossil group and then the accumulation via secondary infall of new galaxies around the fossil remnant (e.g. Jones et al., 2003).
The observed differences in the total luminosity and luminosity profiles with respect to standard ETGs (e.g. Schombert, 1986; Bernstein & Bhavsar, 2001) suggest that the formation histories of first-ranked galaxies follow a pattern similar to that of their fainter peers only at high redshift (e.g. De Lucia & Blaizot, 2007). At early times, cooling flows are probably the main fuel for the mass-growth of the bulk of the galaxy population. But for galaxies residing in dense environments this source of growth is removed as soon as they are incorporated into a bigger structure. In a cosmological hierarchy, small groups of galaxies tend to form prior to more massive structures. The gravitational collapse that precedes the virialization of these precursor subunits leads to frequent, multiple encounters among their member galaxies at relatively speeds comparable to their internal stellar motions. When two or more galaxies collide under such conditions, dynamical friction combined with strong time-dependent mutual tidal forces redistribute the ordered orbital kinetic energy into internal random energy, allowing the galaxies to merge, in the absence of important energy dissipation, into a velocity-dispersion-supported, ellipsoidal-looking system (e.g. Barnes, 1988; Hernquist, 1992; Barnes & Hernquist, 1992). If this galaxy merging is not accompanied by significant star formation, it should propitiate the creation of massive and red early-type remnants in regions that later may become part of a bigger structure.
It is critical for the substantial growth of BGGs that merging develops in a local environment dynamically more mature than its surroundings. The effectiveness of galaxy assembly in group-sized units is largely reduced as soon as the latter start to coalesce into a larger structure, deepening the overall gravitational potential and increasing the relative velocity of galaxy encounters to values ( km s-1) well above the typical orbital speeds of their stars (Kuntschner et al., 2002). In addition, the truncation of the radii of non-central galaxies (satellites) surviving the virialization of a protostructure may lead to time-scales for dynamical friction longer than a Hubble time, so that any subsequent growth of the first-ranked object through the cannibalization of its smaller companions will likely be very modest, as the analytical accretion rate model by Merritt (1985) predicts. Indeed, once a galaxy aggregation relaxes, any ensuing secondary infall will act to reduce the magnitude gap between the highest ranked galaxy and the other system members that survive the virialization stage (Loh & Strauss, 2006; von Benda-Beckmann et al., 2008). This self-regulated growth scenario in which the dominance of first-ranked galaxies depends on the specific way cosmological infall develops around them allows to reconcile the dependence of the observed properties of these objects on the local environment with their standard candle nature Sandage 1972; Postman & Lauer 1995; see also De Lucia & Blaizot 2007.
A BGG formation framework driven mainly by merging has to overcome an important difficulty that is extensive to the general elliptical population. The root of the problem lies in the combination of the expectation that gas-rich late-type galaxies (LTGs) should account for a large proportion of ETG progenitors with the fact that the relations between the three major physical parameters informing about the size, internal velocity, and scale of a galaxy, i.e. its mass – usually substituted by NIR luminosity, a directly measurable proxy, defining what we hereafter refer as the or space –, differ significantly222For a concise description of a galaxy’s overall physical state, the scale should be complemented at least by a second independent property, such as colour or luminosity-weighted stellar age, providing condensed information on the star formation history. In this paper we work directly in space and thus avoid possible biases arising from luminosity weighting of stellar populations.. As stated in Hopkins, Cox & Hernquist (2008), the observed differences in the properties of early- and late-type objects can be summed up in the different behaviour of the ratio of total (dynamical) mass to stellar mass, , calculated within a fiducial radius (usually the radius at which half of the total light of the system is emitted). Thus, while the most massive discs and ellipticals have similar ratios, discs with masses below that of the Milky Way (MW) are substantially more dark matter dominated (see, e.g. Fig. 1 in Courteau & Dutton, 2015). This means that the central phase space density of stars in intermediate and low-mass LTGs is systematically lower than in the cores of their elliptical counterparts. Since purely dissipationless merging cannot increase the density of the phase space (Carlberg, 1986), this difference is a major challenge for models that posit that ellipticals form through the merger of disc galaxies. The proposed solutions include merging progenitors that either are denser than local discs (Aceves & Velázquez, 2005), or harbour a compact central stellar region such as a bulge; Hernquist 1993, or alternatively, contain a non-conservative component able to raise the inner stellar concentration of the remnants as in Robertson et al. (2006). These latter authors used simulated wet (i.e. gas-rich) binary mergers of disc galaxies with varying gas fractions to show that merger-induced starbursts allow for an increase in central stellar density and therefore a decrease in central , thereby demonstrating that gas dissipation can offer a viable explanation for the observed tilt of the fundamental plane FP; Djorgovski & Davis 1987; Dressler et al. 1987 of ETGs. However, as shown by Novak (2008), while binary mergers of substantially gas-rich disc galaxies can result in remnants with properties similar to those observed in the low-mass, fast rotating ellipticals that comprise of the galaxies detected in detailed ETG surveys such as SAURON (Emsellem et al., 2007), they have difficulties in producing objects comparable to the massive, nearly spherical, non-rotating systems that make up the remaining of the elliptical population (see also Mo, van den Bosch & White, 2010). For this latter type of galaxies Novak finds that in order to get remnants with the right structural and dynamical properties the key lies largely in dealing with realistic assembly histories, which essentially means a non-regular sequence of mergers with progressively decreasing mass ratios (see also Oser et al., 2012; Moody et al., 2014). What is more, by using the zoom-in technique for re-simulating haloes extracted from a full cosmological simulation, he finds that in runs where the galaxies’ gas supply is continuously replenished the massive remnants that form tend to be fast rotators. This suggests that the presence of a dissipational component in a merger helps to maintain some coherent rotational motion in the tightly bound region of the remnant by reducing the efficiency of dynamical friction in transferring the progenitors’ orbital spin to the extended outer dark halo (Cox et al., 2006)333Interestingly, Ceverino et al. (2015) have recently shown that high-redshift massive galaxies subject to intense gas in-streaming are prone to suffer violent disc instabilities that contribute to the growth of compact central bulges with classical profiles by continuous transfer of gas-rich material from the disc to the spheroid.. All these findings are specially relevant for the most luminous ETGs which are known to possess smaller velocity dispersions, larger sizes and fainter surface brightnesses than expected if they have followed the same formation histories of their less-massive counterparts (Hyde & Bernardi, 2009; Méndez-Abreu et al., 2012). It appears therefore that a realistic hierarchy of multiple, essentially dry, mergers is key in the assembly and evolution of these objects (Shen et al., 2003; Naab, Khochfar & Burkert, 2006; Desroches et al., 2007; Bernardi et al., 2007; Liu et al., 2008; Méndez-Abreu et al., 2012). The contribution of dissipation to the growth of first-ranked galaxies (by cooling flows and/or wet mergers) must be then necessarily limited to early epochs when galaxies were on average more gas-rich, the current large sizes of BGGs being mostly the result of the non-dissipative capture of numerous neighbouring objects facilitated by the physical conditions of the environment in which they reside. For the same reasons, dry hierarchical merging should also play an important role in explaining the origin of the FP and related 2D scaling laws displayed by these extreme ETGs.
A recent work by Taranu, Dubinski & Yee (2013, 2015) constitutes the last, and probably, also the most elaborate investigation to date of the gravitational effects associated with extensive merging on the internal structure and kinematics of central remnants in galaxy associations. As stated by these authors, pure cosmological simulations, which incorporate hierarchical merging in a self-consistent manner, have been hitherto a resource scarcely used in studies of the physical origin of the basic properties of first-ranked objects in group/cluster-sized galaxy aggregations and the tight scaling relations connecting them (e.g. Sáiz, Domínguez-Tenreiro & Serna, 2004; Naab, Johansson & Ostriker, 2009; Ruszkowski & Springel, 2009; Oser et al., 2012). The most likely reason is the high computational cost demanded by the large simulation sets that this sort of statistical investigations require. Instead, merger hierarchies, in both dry and wet simulations, are systematically recreated through two or three non-overlapping steps of binary major collisions of homologous systems that use the remnants of the previous stage to realize the initial conditions of the next (Dantas et al., 2003; Robertson et al., 2006; Novak, 2008; Nipoti et al., 2009; Moody et al., 2014). These idealizations of multiple merging, however, can hardly capture the diversity of galaxy interactions, especially when it comes to the distribution of orbits, frequencies and mass ratios, that take place in the course of cosmic evolution. Another important drawback of this ’standard approach’ to hierarchical merging is that it does not allow as much orbital energy transfer into the remnants as when the colliding galaxies are part of a larger bound system. By contrast, Taranu et al. follow the assembly of BGGs from the outcome of over a hundred simulations of groups of three to thirty gas-free spirals collapsing from turnaround. Their progenitor galaxies, which have luminosities randomly sampled from a wide range of a Schechter LF, are all re-scaled versions of a large-bulge-fraction model of M31. Taranu et al. (2013) place the most luminous object of each run at the group centre and assign random locations to the remaining group members up to a maximum radius equal to twice the virial radius the group would have at the initial redshift of the simulation (). The spatial distribution of galaxies is such that their extended NFW (Navarro, Frenk & White, 1997) dark haloes form an essentially continuous background of dark matter. The satellite galaxies are also given random peculiar velocities biased both inward and radially to ensure collapse. With this substantially more realistic pathway to account for the importance of hierarchical merging in galaxy formation, Taranu et al. (2015) are able to show that multiple dry mergers of spiral galaxies produce central dominant remnants lying along a tight FP that is tilted, albeit somewhat less than suggested by observations. Therefore, their findings lend credence to the idea that in high-density environments gravitational processes on their own can be largely responsible for the formation of first-ranked ETGs, thus obviating the need for the intervention of progenitors with abundant () gas fractions, as suggested for instance by Robertson et al. (2006) and Hopkins et al. (2008).
The present work, which follows the line initiated by the numerical experiments of e.g. Dubinski (1998), Athanassoula, Garijo & García-Gómez (2001), Dantas et al. (2003), Gao et al. (2004), De Lucia & Blaizot (2007), von Benda-Beckmann et al. (2008) or Ruszkowski & Springel (2009), represents further progress in the investigation of the role of pure collisionless dynamics in the assembly of the largest spheroids in the universe. Specifically, we carry out a study of the optical properties of our simulated groups and BGGs that complements the work done by some of us assessing the impact of dissipationless hierarchical merging on the mass FP Perea & Solanes 2015; hereafter Paper II. The findings of both investigations provide conclusive evidence in favour of the fundamental contribution of dry multiple merging in small collapsing galaxy aggregations to the formation of realistic first-ranked galaxies. As in Taranu et al.’s papers, we will use for this purpose controlled high-resolution -body simulations of the virialization phase of small galaxy groups, but with a set-up yet somewhat further elaborated in certain aspects. The main differences in our approach are the simultaneous use of late- and early-type galaxy models intended to account for the expected mix of progenitors’ populations, the non-homologous scaling of the progenitors’ properties, the inclusion of a common dark matter background not associated with any particular galaxy, and the scaling of the mass of the progenitors’ dark haloes to values appropriate for the initial redshift of the simulation, , which is also significantly larger. The focus is to build controlled simulations of group formation that approximate as closely as possible to pure cosmological experiments. By contrast, we are more restrictive than Taranu et al. in terms of the range of galaxy numbers and total masses of the simulated groups, which we have fixed to specific typical values (see next Section), without this undermining the conclusions of the present investigation. Analysis of simulations of galaxy aggregations of higher mass and broader membership is currently underway (Perea & Solanes 2016, in preparation). The new simulations will allow us to investigate possible correlations between these two factors and the main properties of BGGs.
The paper begins by explaining in detail the approach followed to create the simulated BGGs (Sec. 2), as well as the methodology used to analyse them (Sec. 3). Section 4 focuses on the imprint left by group formation on the optical properties of their central remnants. Next, we examine in Section 5 the joint distribution of global properties in the 3-space of virial-related variables and check its consistency with real data. Finally, in Section 6 we discuss the results of this work and comment on its implications on theories of ETG formation. We also include three appendixes: Appendix A evaluates the effects of numerical heating in our galaxy models; Appendix B, describes the model adopted to account for the secular growth of galaxy dark haloes; and Appendix C, which provides details about the procedure used to elaborate our surface density maps. Both the forming group and the galaxy models are build according to the predictions of the standard concordance flat cold dark matter (CDM) cosmology that we use throughout the paper. Specifically, we adopt a matter density parameter , and a reduced Hubble constant from the WMAP 5-year results (Komatsu et al., 2008).
2 Galaxy group simulations
Our group simulations are designed to study galaxy aggregations that are in the act of formation. It is in this type of environment in which it is expected that the contribution of gravitational dynamics have the greatest impact on the evolution of galaxies and intergalactic medium. More specifically, we aim to reproduce the properties of relatively compact low-mass () galaxy associations, with typically a few bright () members, small line-of-sight (l.o.s.) velocity dispersions ( km s-1), and low X-ray luminosities (), that have not yet virialized. According to the results of the CDM Millennium Simulation (Springel et al., 2005), the mean formation redshift444Defined as the first redshift slice in which the largest progenitor of a dark halo has half the mass of the final halo. of overdensities this size is McBride et al. 2009; Harker et al. 2006; see also Giocoli et al. 2007. Thus, in the local universe, the groups at the centre of our focus would be among the dynamically youngest systems of their class, reaching turnaround at cosmic times () not too different from the typical virialization epoch of these structures.
2.1 Group model
Our groups are created as isolated overdensities that first expand linearly, then turnaround, and finally undergo a completely non-linear collapse, as done in the pioneering works by Diaferio, Geller & Ramella (1994) and Governato, Tozzi & Cavaliere (1996). Each simulated group starts being a (nearly) uniform spherical primordial fluctuation at redshift (about one-eighth of the present time ). At this cosmic time, galaxy-sized haloes have already acquired most of its mass (Li et al., 2007; Stewart et al., 2008), but their cold baryonic cores need not necessarily be as developed. The star formation rate of a non-negligible fraction at least according to Saracco et al. 2006 of the brightest galaxies may begin to shut down abruptly at (e.g. Cattaneo et al., 2006), indicating that these objects are nearly fully grown at the chosen . The smaller representatives of the galaxy population, however, may endure most of their stellar mass growth at lower redshifts – the well known ’downsizing’ effect –, a fact that we have decided to ignore (we justify this choice in Section 2.2.2).
The value of the initial overdensity of our mock groups, , in which only the growing mode is present, i.e. , is chosen so that a perfectly homogeneous top-hat perturbation would collapse at , which is also the approximate redshift at which we end our simulations. The initial positions of the background particles (including the centre of mass of the galactic haloes of member galaxies) are randomly distributed inside the group volume, while their initial velocities are purely radial, following the inner perturbed Hubble flow (Bertschinger, 1985)
| (1) |
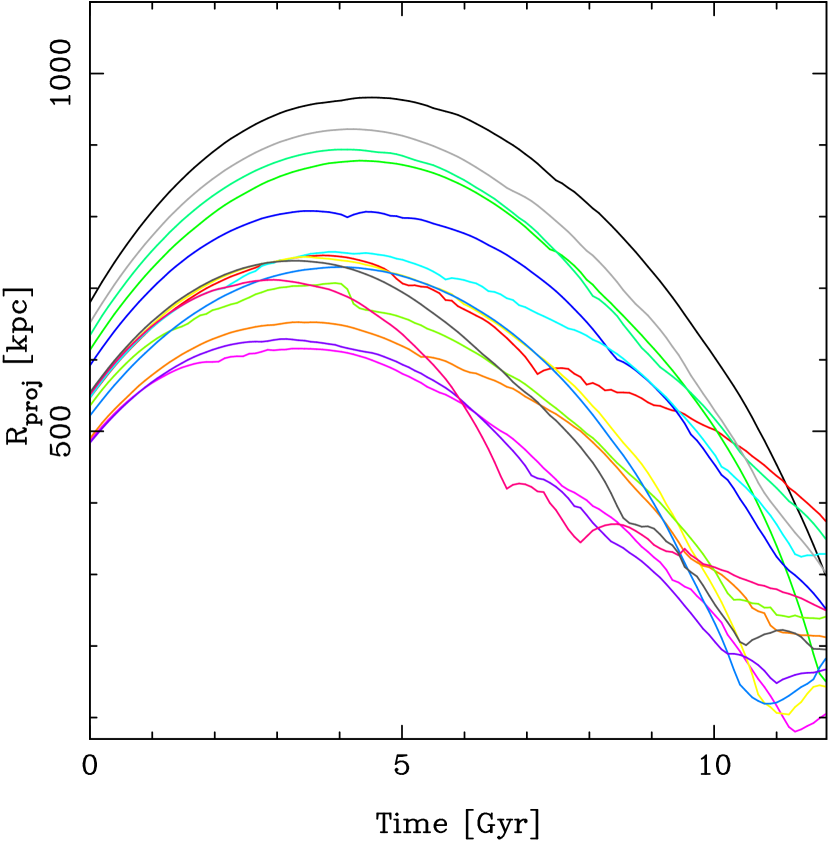
where is the radial expansion velocity at a distance from the group centre, and is the unperturbed Hubble parameter of the universe at . In our experiments, the time elapsed before turnaround, about 1/3 of the total simulation time (see Fig. 1), which marks the onset of the non-linear phase, serves for gravitational interactions between group members to build up peculiar velocities and -point correlations among their positions, thus guaranteeing a reasonable approximation to a conventional galaxy group before merging becomes widespread. Nevertheless, it must be noted that this early (mild) clustering is only relevant for the (very) few mergers that take place before or around the turnaround epoch. Since the initial state of our groups is far from equilibrium, in the remaining 2/3 of the total simulation time, which follows the gravitational collapse of the system, galaxies move in a mean gravitational field that becomes widely fluctuating and increasingly erratic as the violent relaxation of the system they inhabit starts to unfold. As a result, the outcome of the mergers that take place in this highly non-linear phase gets largely detached from the initial orbital anisotropy of progenitor galaxies.
The initial radius of each simulated group is estimated from the dissipationless spherical collapse model. Assuming that pressure gradients are negligible, a top-hat perturbation of amplitude at evolves like a Friedmann universe whose initial density parameter is given by (cf. Coles & Lucchin, 2002, Eq. (14.1.2))
| (2) |
where the suffix ’p’ identifies quantities associated with the perturbation, while , , and refer to the unperturbed background cosmology. Since dark energy starts to dominate the dynamics of the universe near the present time () and the condition for the collapse of the perturbation is , it is safe to neglect the contribution of to its evolution. Under this approximation the expansion of the perturbation is described by the equation
| (3) |
with the cosmic scale factor.
When the perturbation turns around at a time , , so
| (4) |
where, because of the symmetric evolution of the perturbation (even when ), is equal to one half the adopted collapse time .
Once has been determined, the initial overdensity of the perturbation representing the group can be calculated from the implicit equation
| (5) |
and then, with the aid of equation (2), one finally obtains the initial radius of the group
| (6) |
where for the present work we have fixed the total mass (dark and luminous) of the perturbations associated with all our simulated groups to the value .
2.2 Galaxy models
Each group region initially contains non-overlapping extended galaxy haloes whose structural and dynamical properties (total mass, spin, concentration, and density profile of the dark component) set the scalings of their central baryonic (stellar) cores. The different galactic components are in dynamical equilibrium, representing a stationary solution of the relevant dynamical equations for collisionless matter. As shown below, our galaxy models, which by-pass all the issues of ab-initio galaxy formation, produce objects with properties that are both consistent with the hierarchical build-up of these systems and well-motivated observationally.
2.2.1 Dark matter haloes
The total masses of individual galaxy haloes, , are randomly drawn from a Schechter-like function of asymptotic slope and characteristic mass . We set a lower limit in mass of , as we do not expect smaller haloes to play a significant role in the results. We note that, at this point, the values represent the virial masses of the progenitor galaxies at the redshift () of observation. The total galaxy masses and taper radius of the dark haloes will be scaled down later in Sec. 2.3 to values consistent with the initial redshift () of the simulations.
For a given , the remaining global parameters of the haloes are fully determined by the background cosmology (i.e., are independent of the assumed halo structure) given a time of observation. Cosmological -body simulations show that the virial radius of a CDM halo of mass observed at a redshift can be defined as the radius at which the mean halo mass density is the mean density of the universe times the virial overdensity of a collapsed object in the top-hat collapse model at that redshift. Thus, we have:
| (7) |
where for the family of flat () cosmologies (cf. Bryan & Norman, 1998)
| (8) |
with
| (9) |
which results in at for the adopted cosmological parameters.
Similarly, the halo circular velocity (i.e. the circular velocity at ) is:
| (10) |
while the dynamical time for all haloes, a quantity that depends only on the world model and redshift chosen, is defined as
| (11) |
The above relationships are useful to compare our simulations with real galaxies as long as we fix the equivalence between simulation and physical units. We do this by taking the unit mass in our simulations equal to the characteristic mass adopted for the mass function (MF) of galaxies, so . This is also the total halo mass commonly associated with a MW-sized galaxy in the local universe see, e.g., Klypin, Zhao & Somerville 2002; Boylan-Kolchin et al. 2009, and references therein. The corresponding scalings for length, velocity and time for are , and , respectively.
We model the inner structure of the galactic dark matter haloes using a NFW density profile of virial radius . This latter parameter is inferred from equation (7), taking into account that the selected values of correspond to the redshift of observation . The halo concentration, , used to determine the scale radius of the NFW profile, is inferred from the median – relation for the standard concordant CDM cosmology found in high-resolution -body simulations, which over the range of masses we are interested, , is well approximated by the equation
| (12) |
where the adopted redshift dependence corresponds to the scaling of the median concentration of haloes of fixed mass found in Bullock et al. (2001) and Wechsler et al. (2002) simulations see also Macciò et al. 2008.
A neat rotation consistent with the adoption of a non-null value for the dimensionless internal spin parameter (see § 2.2.2) is imparted to the dark matter haloes to account for the contribution of the gravitational tidal torques that may have arisen in the course of the growth of the initial perturbations. Inspired by Springel & White (1999), the net fraction of halo particles required to produce a given is taken to be proportional to the ratio between the streaming velocity of the galactic halo and the local azimuthal circular velocity. Since it is reasonable to expect that the dark haloes of ETGs have generally a lower spin than those hosting late-type objects (Huang et al., 2012), we reduce by half the value of for the haloes hosting pure spheroidal stellar distributions. The orientations of the galactic spins within the group are selected at random.
2.2.2 Baryon cores
A of the total mass of each galaxy is placed in a stellar core following either a disc-bulge or a pure spheroidal distribution. For galaxies with masses equal to or larger than morphologies are established using a Monte Carlo technique that assumes a mass-independent LTG fraction of 0.7, typical of the field (see, e.g. Fig. 9 in Postman et al., 2005). Galaxies below this mass threshold, which in our simulations contribute around of the total stellar mass, are assumed to host only spheroidal stellar distributions. This setup, which does not reproduce results on the morphological mix of local galaxies with masses similar to those of the two Magellanic Clouds (Kelvin et al., 2014), is actually a matter of simplicity since such small galaxies are marginally resolved in our simulations and therefore highly sensitive to numerical heating (see App. A). Besides, as we will show in Section 4.3, objects of this size survive practically unscathed the collapse of their host groups thanks to their reduced internal velocities. Changing the inner structure of the smallest galaxies included in our simulations would not alter the main results of the present study.
At this point, it is important to stress that our LTG and ETG models do not pretend to accurately reproduce the structural and dynamical characteristics of the different kinds of galaxies that can be present in a group. Instead, we aim to provide a sensible representation of the two basic shapes of the stellar distributions expected to populate the universe at all epochs. Namely, relatively extended and fragile discy objects with a substantial rotational component, and dynamically-hot spheroids, i.e. stellar systems that are stabilized essentially by internal random motions and have centrally concentrated ellipsoidal profiles.
To realize the late-type stellar distributions we adopt the usual 3D exponential-sech-squared profile (Spitzer’s isothermal sheet), which in cylindrical coordinates is given by
| (13) |
where we assume a disc scale-height , as it is typical in high surface brightness galaxies in the local universe (e.g. Bizyaev & Kajsin, 2004).
Disc scale-lengths, , are initialized according to the adaptation by Darriba & Solanes (2010) of the analytic formalism for disc formation from Mo, Mao & White (1998), which relies on specific angular momentum conservation during gas cooling and adiabatic halo response to gas inflow, and that reproduces the (slopes and zero-offsets of the) main observed 2D scaling relations for nearby discs. According to this model , with factor being a function, for a given halo profile, of , set by the total halo mass (Eq. 12), and the adopted and stellar mass fraction values. For our model LTGs we take , the median value of this parameter found in cosmological simulations (Shaw et al., 2006), which when combined with for galaxies embedded in NFW haloes, produces discs obeying the observed local relation between the average specific angular momentum, , and the peak rotation velocity, , inferred from the width of the global H I profile. More details can be found in Darriba & Solanes (2010).
| Description | Value |
| Total group mass | |
| Initial redshift | |
| Observation epoch | |
| Look-back time since the beginning of simulation | Gyr |
| Initial overdensity of the group | |
| Initial radius of the group | Mpc |
| Initial number of group member galaxies | 25 |
| Asymptotic slope of the Schechter galaxy mass function | |
| Low-mass cutoff of the Schechter galaxy mass function | |
| Fraction of large () LTGs | 0.7 |
| Bulge-to-disc mass fraction for LTGs | 0.25 |
| Total number of particles in a galactic halo | |
| Initial fraction of stellar particles in a galactic halo | 0.6 |
| Stellar particle mass | |
| DM particle mass | |
| DM-to-stellar particle mass fraction | 28.5 |
| Background-to-galactic halo DM particle mass fraction | 1.0 |
| Plummer-equivalent softening length for stellar particles | pc |
| Plummer-equivalent softening length for DM particles | pc |
Both bulges and ETGs are represented by zero-angular momentum stellar spheroids supported by velocity anisotropy and obeying a spherical Hernquist (1990) mass density profile
| (14) |
where is the profile scale length. Given that the applicability to merger-made galaxies of the adiabatic-gas-inflow model for disc formation is very questionable but see Padmanabhan et al. 2004; Dutton et al. 2011, we have decided to create initial conditions for ETGs using instead simple empirical laws adjusted to match the mean scalings observed for this population in the local universe. Thus, we relate the size measure of our elliptical galaxy models represented by the effective radius of their projected luminosity profiles, , to their total mass via the empirical formula
| (15) |
which matches the observed size-luminosity scaling for Sloan Digital Sky Survey (SDSS) ETGs reported by Bernardi et al. (2003b) in the -band (Table 1 of this paper) if one assumes , a fixed rest-frame mass-to-light ratio of solar units555This value is in reasonable agreement with the expectation for a typical nearby galaxy inferred from the vs correlation derived by the SAURON project (Cappellari et al., 2006)., and a colour equation mag (Fukugita, Shimasaku & Ichikawa, 1995). We note that Equation (15) is also consistent with the – relation for massive galaxies inferred by Shen et al. (2003) likewise from SDSS data. For LTGs, we simply add a bulge with a constant bulge-to-disc mass fraction of , typical of Sb galaxies (Graham, 2001), and a bulge-to-disc size ratio .
Both spheroidal and exponential distributions are extended into the radial direction up to a radius encompassing of the total stellar mass. We have verified that in this manner we generate galaxies with comparable minimum local stellar density at the outer radius. We also note that a circular aperture of two Petrosian radii, used to define the Petrosian magnitude of a galaxy, encloses about the same fraction of the stellar light for the corresponding typical Sérsic profiles of indexes (exponential) and (de Vaucouleurs), in the presence of seeing (Blanton et al., 2001). For LTGs, the stellar disc distribution is also truncated in the vertical direction at .666This and the truncation in refer exclusively to the fact that we are tapering the stellar distributions at finite distances; in no case they imply the truncation of the adopted initial stellar masses.
2.3 N-body realizations of galaxy groups
We have run a total of 48 -particle simulations of galaxy groups containing initially galaxies. With this initialization, the average number of independent galactic haloes that remain at the end of our runs is consistent with the statistics of sub-halo abundance in typical group-sized CDM haloes (Gao et al., 2011; Taranu et al., 2013), while facilitating the generation of a sufficient number of large () discy progenitors from the adopted galaxy MF.
Our initial galaxy models have been built with the aid of a much-expanded version of the computationally efficient MaGaLie open-source code (Boily, Kroupa & Peñarrubia-Garrido, 2001) included in the NEMO Stellar Dynamics Toolbox (http://bima.astro.umd.edu/nemo/). The backbone of MaGaLie is the program BUILDGAL (Hernquist, 1993), which allows one to create either two-component (spheroid-halo) or three-component (disc-bulge-halo) galaxies in near equilibrium using different halo density profiles. Among other improvements, the upgraded code is now fully portable and includes the possibility of adding extra components to the galaxies, such as a second co-planar disc or a central supermassive black hole, as well as scaling the output to arbitrary units. More importantly, the refurbished program includes a more accurate treatment of rotation in the centre of discs that eliminates the annular disturbances generated by the original algorithm, enabling the production of galaxies that can remain fully stable when evolving in isolation for more than a Hubble time (see App. A).
The total number of bodies per galaxy scales with its total mass. We assign particles per in galactic haloes at , 60 per cent of which are used to represent the central luminous core (with this arrangement at least of the total number of particles in our simulated groups are luminous). Taking into account that we are modelling galaxies with a current baryon content of , the DM to stellar particle mass ratio is then 28.5. The stellar Plummer equivalent softening length has been set to 30 pc. For the dark component the softening length is scaled with the square root of the body mass ratio, resulting in a value of pc. Thus, both body types (light and dark) experience the same maximum force. We have also taken the precaution of running in Appendix A long-term stability tests to quantify the breadth of the changes suffered by the internal structure of the galaxies simulated with these initial conditions, finding that the effects of numerical heating are maintained within acceptable limits for the duration of our experiments. Total energy conservation, which serves to evaluate the accuracy of time integration, is better than in all cases.
As stated earlier, we have used the virial masses of the progenitor galaxies selected at the observation epoch to set the structural parameters of their central stellar cores. Now, we need to scale down the masses and radii of the dark haloes to values consistent with the initial redshift of the simulation . This is done by applying Equation 20 of the halo growth model described in Appendix B. The luminous components, however, are left unchanged because in our simulations most mergers take place at , an epoch in which galaxies are relatively similar to those in the local volume. As shown by a large number of studies (La Barbera et al., 2003; Trujillo & Pohlen, 2005; Trujillo et al., 2006; Kassin et al., 2012; Huertas-Company et al., 2013, to name a few), the relative abundances, as well as the luminosity- and stellar mass-size relations of galaxies with both early- and late-type characteristics have not evolved significantly since these moderate redshifts, at least for galaxies as large as the MW, which are the main drivers of the interactions in our simulations. Once all the galaxies of a group have been generated, we fill evenly the empty space of the common volume with DM particles (identical to those that make the galactic haloes) until a total group mass (dark and luminous) of is reached. This homogeneous background is intended to represent the matter that exists in scales below the smallest of our mock galaxies, which is expected to be composed by a myriad of smaller-scale systems (with ), many of whom have likely collapsed prior to the epoch at which our simulations begin, and for which we do not resolve neither their inner structure nor their spatial distribution within the group volume. The common dark haloes account at for 32 to 88 per cent of the total group mass, with a median value of per cent. This measure, its complementary initial fraction of mass in bound subhaloes, and, especially, the associated and invariant total amount of stellar mass in the system, are the quantities best suited to characterize our groups, given that all of them have identical total mass and initial richness.
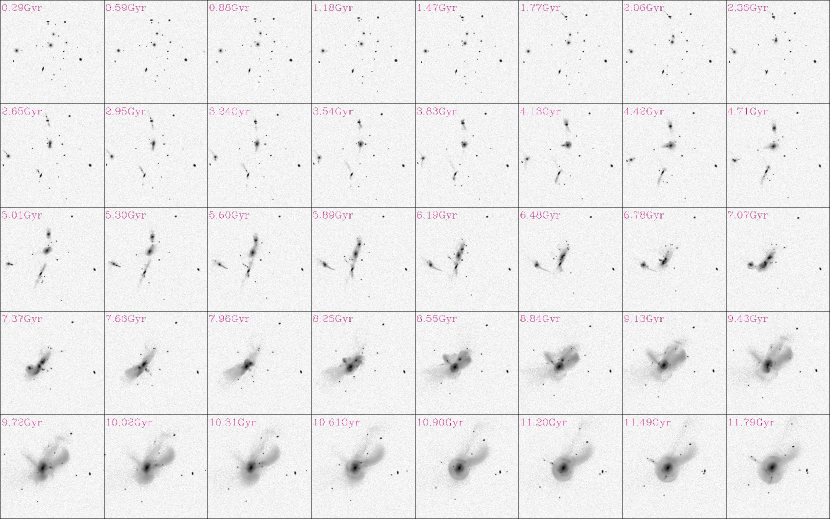
Our groups are evolved for about 11.5 Gyr from to – from to in the adopted simulation units – using the collisionless part of the public parallel code GADGET2 (Springel, 2005), which employs a hybrid TreePM method to compute gravitational forces. The runs require about hours of CPU each to complete. We use adaptive time stepping, which for our simulations leads to maximum time resolutions of the order of simulation units, and save snapshots each . In Fig. 2 we provide a composite of selected snapshots equally spaced in time showing the evolution of one of our galaxy groups.
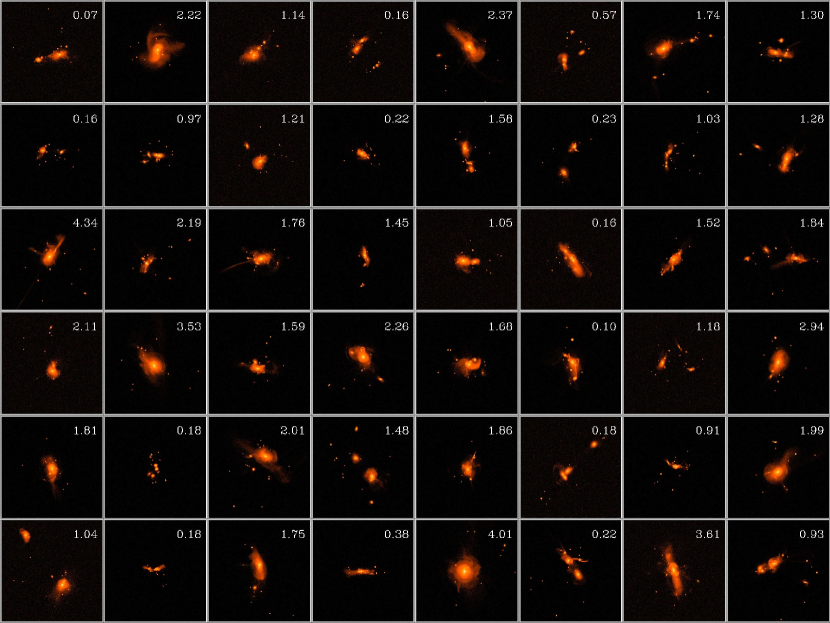
Table 1 lists the most important parameters that all of our runs have in common, while Fig. 3 shows the final snapshot of all our 48 simulated groups (unless stated otherwise depicted group images correspond to orthographic projections on to the plane). This plot serves to illustrate the large variety of collapsing group configurations that are produced in our experiments. Although it is a subject that we expect to analyse in a forthcoming publication, note the richly varied intergalactic light structures that form too. In Appendix C, we provide the details of the kernel density estimation technique used for generating the density maps presented in this paper.
3 Analysis methodology
The extraction of BGGs properties has followed a two-stage approach.
In the first place, we identify all the galaxies present in each of the evenly spaced 120 snapshots stored from each group simulation and derive both their total luminous masses and mean positions. Galaxy identification is based on the projected distribution of the visible particles, thus mimicking classical observational methods dealing with the density of projected light. We rely on the SExtractor software (Bertin & Arnouts, 1996) to perform this task. In a second stage, the information on the number and positions of the galaxies is used to assign galaxy membership to the luminous particles in the final snapshots and, after ranking those belonging to the largest central galaxy in each of the groups according to their galactocentric distance, to infer the effective radius , surface mass density, , and projected internal velocity dispersion, , of our collection of mock BGGs.
Simulated groups are imaged along three independent l.o.s. corresponding to the three Cartesian axes. At present, it has not been deemed necessary to create additional projections since (1) any other randomly oriented map can be obtained by a linear combination of the principal images, and (2) in this paper we deal mostly with global galaxy properties which, in general, change little with orientation. Mock sky-images of the groups are created after putting each group at a fiducial redshift representative of the typical mean depth of BCG spectroscopic samples (e.g. Liu et al., 2008). We then apply a pixel scale of arcsec/pixel, comparable to the SDSS scale ( arcsec/pixel). In the concordant CDM cosmology, the conversion between intrinsic and angular sizes is well approximated by the equation
| (16) |
so for the adopted the angular pixel scale corresponds to a physical scale of kpc.
The procedure followed to infer the projected density in each pixel of the images is described in Appendix C. As explained there, to build the continuous group images we have applied a fixed kernel smoothing scale equal to ten times the softening length adopted for the luminous bodies. A zero mean white sky noise component, with a 1-sigma deviation equivalent to a surface brightness of about mag arcsec-2, has been added to the images to allow SExtractor to perform the photometry777The very small noise level in our mock images, well below the typical SDSS -band sky, is intended to facilitate the detection of intragroup light (see Sec. 4.1).. The maps have been also smoothed by a Gaussian point spread function (PSF) with a full-width at half-maximum of arcsec ( kpc at the adopted ), a value equal to the median PSF characterizing the SDSS-II -band photometric observations. After some trial and error, we found that for our mock images the FLUX_ISOCOR SExtractor method provides the best and most accurate estimates for the total mass of the BGGs, as demonstrated by the fact that the total initial stellar masses of our 48 simulated groups recovered from the groups’ projected image show a r.m.s. deviation from the corresponding actual values of only per cent.
Once the positions and masses of the galaxies are inferred from the density maps, each stellar particle is assigned to the galaxy that maximizes the ratio , being the projected distance between galaxy and particle . It is from the sets of luminous particles belonging to the BGGs that we calculate the global properties of these objects. The is calculated as the median of the ranked distribution of radial distances of the particles to the centre of the galaxy, represented by its density peak, is then just the luminous mass contained inside divided by , while is inferred888The conclusions of this work are not affected if we replace the effective velocity dispersion, as measured in integral field spectroscopic surveys, by a central estimate, say within . by averaging the perpendicular component of the velocities of the particles within . We have also included a selection bias towards km s-1 to guarantee that we deal only with truly massive central remnants (Mutabazi et al., 2014; Bezanson et al., 2015). Then we proceeded to calculate the three principal axes (within one ) of the central galaxies, which have been used to estimate the ellipticities that provide the corrections necessary to circularize the galactocentric distances of all the luminous particles. The new particle distances have been then sorted to extract the integrated stellar mass profiles of the BGGs by adding the masses of the luminous bodies contained inside a given radius. Due to the high number of particles that accumulate near the centre of the galaxies, we find that it is more efficient to build these profiles applying a logarithmic binning in and accounting for the error estimates for the mass in each bin. Finally, we have obtained a first estimate of the global shape of the stellar mass distributions of our mock BGGs using the median value of the Sérsic indices that result from applying non linear least-squares fits of an integrated Sérsic profile to the projections of their luminous component onto the three Cartesian planes. In this latter calculation, the most stable results are obtained when we exclude from the fits the central kpc and extend the profiles until a density equal to three times the minimum density associated with a single particle is reached.
To compare our central merger remnants with observations mass is converted to luminosity by considering that there are no population effects, meaning that we assume a fixed stellar mass-to-light ratio for all galaxies. Since the Two-Micron All-Sky Survey (2MASS) -band luminosity – a "short" filter with a superior suppression of thermal terrestrial emission than the original – is known for being a faithful tracer of the old stellar mass content of galaxies and rather insensitive to both extinction and star formation effects (e.g. Kauffmann & Charlot, 1998), we take, after dropping the subscript ’s’, , in line with values reported in the literature (e.g. Ellis, 2008; Longhetti & Saracco, 2009; La Barbera et al., 2010; McGaugh & Schombert, 2014). The absolute -band magnitude measure of our remnants is then inferred from the ratio between the total stellar mass within the model image and after taking into account that (Bell et al., 2003).
4 Optical properties of our simulated groups and BGGs
In this section we aim at characterizing the importance of collisionless gravitational dynamics during group formation by looking in detail at the imprint it has left in the optical properties of our systems at . As stated in the previous section, throughout the remaining of the paper stellar mass can be considered a proxy for -band luminosity.
4.1 Relationship between BGG and host group properties
It is evident from Fig. 4 that the fraction of stars assigned by SExtractor to individual galaxies at the end of our simulations anti-correlates with the total stellar mass fraction of the groups. The difference, which increases with increasing stellar mass, barely exceeds in the 48 experiments analysed. Certainly, the absence of low-mass disc galaxies in our experiments suggests that we could be obtaining a lower limit of the amount of diffuse intragroup light (IGL) generated during the gravitational collapse of small galaxy groups. Besides, our measurement hardly qualifies as slightly more than a very crude estimate of this quantity. Physically meaningful measurements of the amount of IGL require discussing in detail the systematics of galaxy masking and the methodology used in the identification of this component, which is beyond the scope of this study. In any case, let us stress the fact that obtaining such a relatively small amount of diffuse light in such an aggressive environment for galaxies is not new, but is a good match with the predictions inferred from exploratory studies on the origin of the IGL done earlier by one of us using more adequate estimators of this component on a smaller set of simulated poor groups (Darriba, 2013). These results suggest that explaining the abnormally large diffuse light fractions of up to per cent of the total light observed in a few of the compact groups catalogued by Hickson (White et al., 2003; Da Rocha & Mendes de Oliveira, 2005) would prove problematic for pure dry merging, and thus establish a link with the need to take into account intragroup star formation when studying the IGL (see, e.g. Puchwein et al., 2010), if not always, at least for these extraordinary cases.
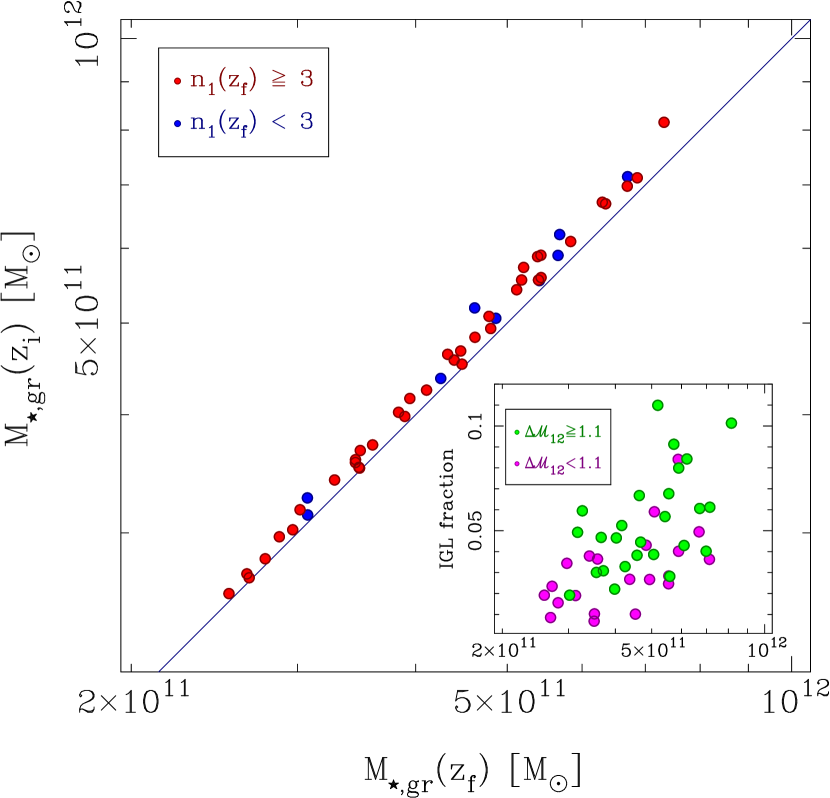
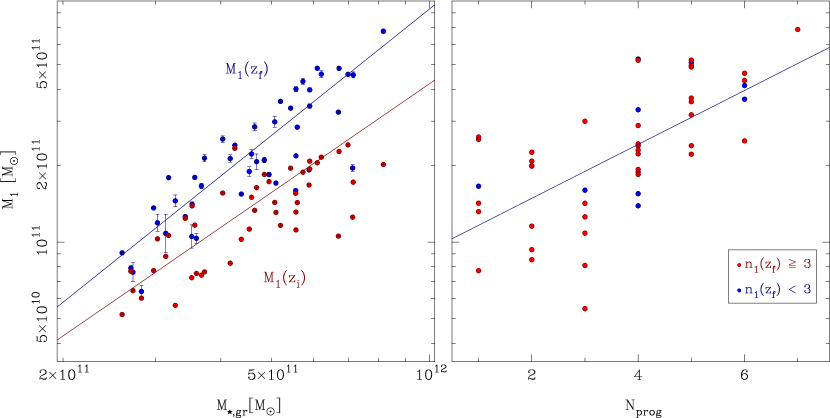
The stellar mass (NIR luminosity) of the biggest galaxy that forms during this process, , also shows a tight positive correlation with the total stellar light in the group, , albeit with a somewhat less marked dependence. The measured logarithmic slope of of the mean trend (upper curve in Fig. 5, left panel) suggests that in isolated forming groups, of similar richness and/or total mass, BGGs are not only brighter but tend to become more important in the overall light as the total stellar mass content of the groups increases. This last relationship is not merely a reflection of the initial conditions of the simulations – the fact that all our groups have the same total mass and initial richness tends to link the magnitude of their largest members at with the total luminous mass – since, as the comparison of the upper and lower curves in the left panel of Fig. 5 reveals, group formation accentuates the dependence between both variables and their correlation strength. Indeed, as shown in the right panel of Fig 5), , much like the final magnitude gap between the first- and second-ranked galaxies, (see next Section), displays a significant and strong positive correlation with the number of progenitors.
Correlations between the luminosity of the first-ranked galaxy and the global properties of its host system have been previously noted in observational studies (e.g. Hansen et al., 2009), and are a natural consequence of the hierarchical evolution of structure. The difference with respect to the results reported here is that in real galaxy systems, first-ranked galaxies are observed to contribute a smaller fraction of the total light with increasing mass/richness of the hosts. This opposite behaviour, however, can be easily reconciled with our findings considering that we are dealing with fully isolated small forming groups. In non-isolated virialized galaxy systems any early growth experimented by their central objects becomes later more than compensated by the acquisition of new galaxy light from secondary infall, and the comparatively low rate of galaxy mergers with the BGG as groups are merged hierarchically into larger structures (Lin & Mohr, 2004).
| Acronym | Reference(s) | |||
|---|---|---|---|---|
| 2MCG | 78 | Díaz-Giménez et al. (2012) | ||
| HCG | 67 | Hickson et al. (1992) (see also Díaz-Giménez et al., 2012) | ||
| UZCCG | 49 | Focardi & Kelm (2002) (see also Díaz-Giménez et al., 2012) | ||
| LCCG | 17 | Allam & Tucker (2000) (see also Díaz-Giménez et al., 2012) | ||
| mG11CG | 326 | Díaz-Giménez et al. (2012) | ||
| SLRG | 210 | Loh & Strauss (2006) | ||
| SLRG-cl | 60 | |||
| SLRG-gr | 40 | |||
| SC4 | 494 | Lin et al. (2010) | ||
| SC4-hL | 124 | |||
| SC4-lL | 370 | |||
| SRXFG | 10 | Proctor et al. (2011) | ||
| SMr18 | 743 | Berlind et al. (2006) | ||
| mLMG | 48 | This work |
-
•
Notes. Errors for and are standard deviations computed from bootstrap. Descriptions. 2MCG: Complete and well-defined full-sky sample of CGs selected by stellar mass from the 2MASS extended source catalogue with radial velocity larger than 3000 km s-1 and 4 or more concordant members; HCG: Hickson et al.’s CGs with radial velocity larger than 3000 km s-1 and 4 or more concordant members; UZCCG: CGs in the 3D UZC galaxy catalogue with radial velocity larger than 3000 km s-1 and 4 or more concordant members; LCCG: CGs in the Las Campanas Redshift Survey with radial velocity larger than 3000 km s-1 and 4 or more concordant members; mG11CG: Mock CGs with 4 or more concordant members extracted from the galaxy outputs of the Guo et al. (2011) semi-analytical model run on top of the Millennium-II cosmological simulation; SLRG: Fields with luminous () red galaxies (LRGs) at selected from the SDSS-DR1; SLRG-cl: Cluster-sized SDSS LRG fields with richness in the upper 75th percentile; SLRG-gr: Group-sized SDSS LRG fields with richness in the 25th-50th percentile; SC4: Updated version of the C4 cluster catalogue extracted from the SDSS-DR5 restricted to systems with km s-1 at –; SC4-hL: High-luminosity subsample () of the SC4 clusters; SC4-lL: Low-luminosity subsample () of the SC4 clusters; SRXFG: High X-ray luminosity fossil groups () with a greater than 2-mag -band gap within half the virial radius selected from the SDSS and RJX samples; SMr18: Volume-limited spectroscopic sample of galaxy groups and clusters with complete down to mag identified from the SDSS-DR3; mLMG: Low-mass () collapsing groups created in this work from cosmologically-consistent controlled simulations.
4.2 The nature of the highest ranked galaxies
After detecting the relationship between the properties of BGGs and of their host groups, it is natural to ask if this connection extends to other luminous (massive) group members.
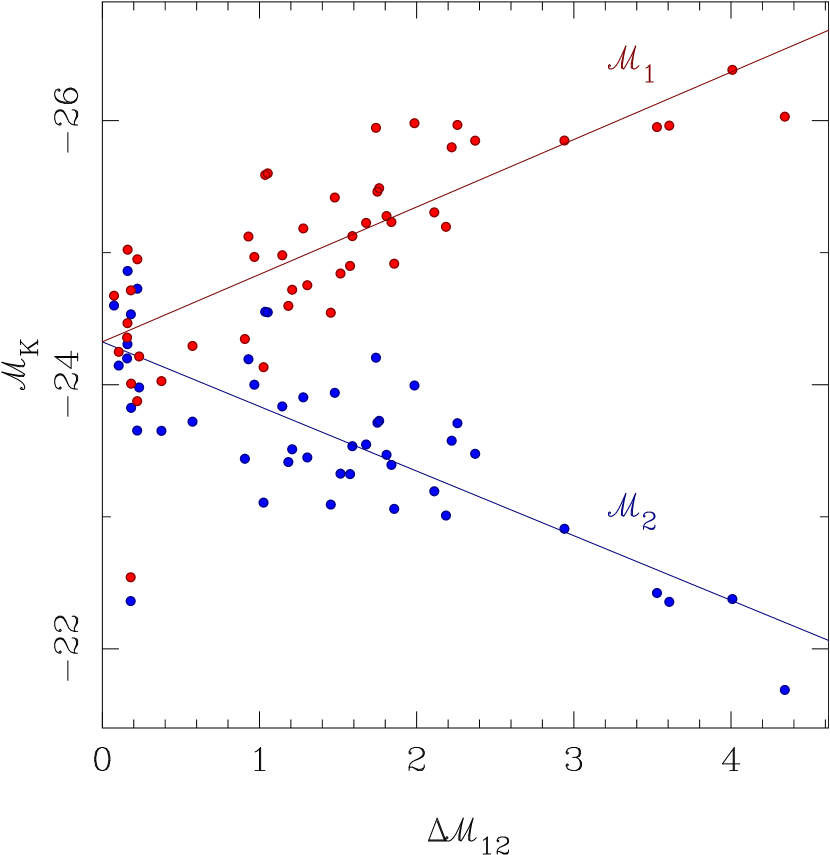
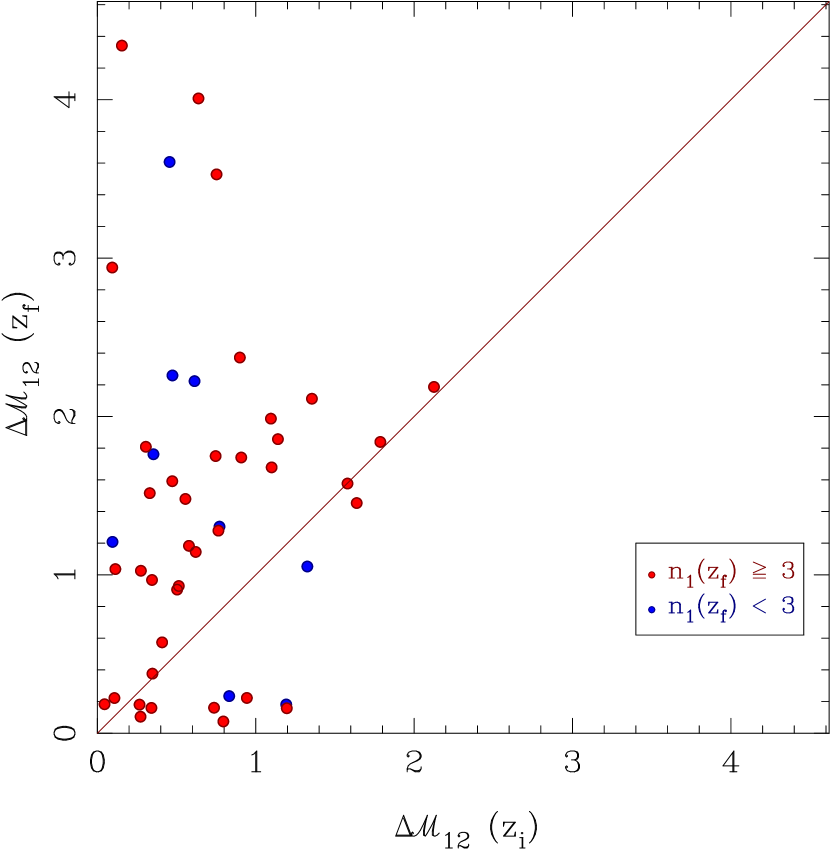
We address this question in Fig. 6, where we plot the stellar masses, expressed in (-band) magnitude units, of the first- and second-ranked galaxies identified at in each one of our groups, and , respectively, as a function of their difference . Examination of the plot reveals in the first place that our simulated groups encompass quite a broad range of values, from nearly zero up to more than 4 mag. This result shows that, even though our groups contain a fixed number of initial members drawn from the same mass function and start at the same evolutionary stage, the randomness of the initial positions of their member galaxies in phase space, and of the sampling of morphologies and masses, combine with their highly non-linear evolution to guarantee that each particular realization of the initial conditions leads to a unique and varied assembly path. The most striking result shown by this plot is, however, the fact that and follow scalings with of very similar strength but of opposite sign: positive for the former and negative for the latter.999Incidentally, note that the current set of axes of Fig. 6 means that we are effectively plotting vs . Given that the slope of the red line is nearly , the expected slope of the blue line should be around as observed. We thank the referee for pointing this out in his report. Such an outcome indicates that first-ranked group objects tend generally to grow in brightness at the expense of their lesser companions during the build-up of their host galaxy aggregations, so that most of the magnitude gaps detected at the end of our simulations arise from the brightening of the BGGs and the dimming of the second brightest galaxies in about equal measure. However, as illustrated in Figure 7, this scenario cannot be fully extrapolated to all the groups for, among those with a final mag), in nearly half of cases actually grows faster than , leading to a reduction in the magnitude gap size. This last Figure also shows that in our simulations the initial breadth of the gaps does not predispose them to achieve a particular final size owing to the total lack of correlation between the initial positions of the galaxies and their luminosities. To all this it must be added the fact that the tight links between the stellar mass of the first-ranked object and both and (see Sec. 4.1), suggest that a similarly strong relationship should exist between the magnitude gap and the global stellar mass fraction of the parent halo, as it can be inferred from the spatial segregation shown by the data points in the inset of Figure 4 when we use different colours to divide according to gap size.
Let us now be a bit more specific regarding the merger history of the highest-ranked galaxies. Within our mock forming groups, first-ranked galaxies experience between 0 and 6 minimally relevant mergers (i.e. involving galaxies which contribute at least to the final mass of ), the mean number of mergers being 2.64 and the mode (most likely value) three, meaning that our BGGs have typically at least 4 progenitors above a certain size (even so, we find 6 BGGs with a single main progenitor). In 47 out of our 48 groups the first-ranked member at the beginning of the simulations is also a progenitor of the final BGG, while in 45 groups all the relevant progenitors of the BGG are among the ten biggest input galaxies of each system, which explains why the final stellar mass of the BGGs shows a strong positive linear relationship with the number of relevant progenitors. In contrast, we find that final second-ranked galaxies experience between 0 and 4 minimally relevant mergers, with a mean of 1.08, and a modal value of zero, i.e. a single main progenitor, sampled in 18 groups (in half of these, the progenitor was a third- or lower-ranked input galaxy). Besides, only in half of our groups (24) the final second-brightest galaxy contains its counterpart at the beginning of the simulations, while in other 23 cases the two brightest input galaxies eventually end up as part of the final BGG. Our simulations therefore suggest that the properties of central objects in dynamically evolved galaxy systems are determined mainly by the assembly of the parent structure (Vulcani et al., 2014), a process that we also find is unique to this class of galaxies and does not appear to significantly affect lesser system members. This implies, in good agreement with the findings by Lin et al. (2010), Díaz-Giménez et al. (2012), and Shen et al. (2014) among others, that BGGs, unlike their second-ranked companions, cannot be in general the statistical extreme, in terms of their luminosity, of the group/cluster galaxy population.
The information provided by Fig. 6 is completed with Fig. 8, which shows the magnitude gap in our simulated groups against the magnitude of their first-ranked galaxy measured in units of the observed characteristic scale of the Schechter LF of -band galaxies (open yellow diamonds). This plot contains four panels, each showing the expected joint distribution of values of and for groups of a given richness, , whose galaxies obey a Schechter LF with shape parameters close to those used to sample the masses of our simulated galaxies. An examination of Fig. 8 reveals that our first-ranked galaxies tend to be abnormally bright, mag, for groups of richness , even in systems with a moderate bright-end gap, mag. At the other end of the gap spectrum, we find that groups with mag, are characterized by a small spread in , with typical values around mag, and second-ranked galaxies quite faint, with 6 out of 10 fossil-like groups having mag. These results altogether confirm that, in a substantial number of cases, the luminosities of our BGGs deviate significantly from the statistical expectations, implying that these galaxies, and just them, are a completely different population from other group members. Also note the broad dynamic ranges covered by the two variables: magnitudes for and, especially, magnitudes for . They show quantitatively that, as discussed above (Sec. 2.3), the narrow ranges of group masses and memberships explored by our simulations have not proven to be an obstacle in producing a wide variety of final group configurations (see also the discussion regarding the statistics and below).
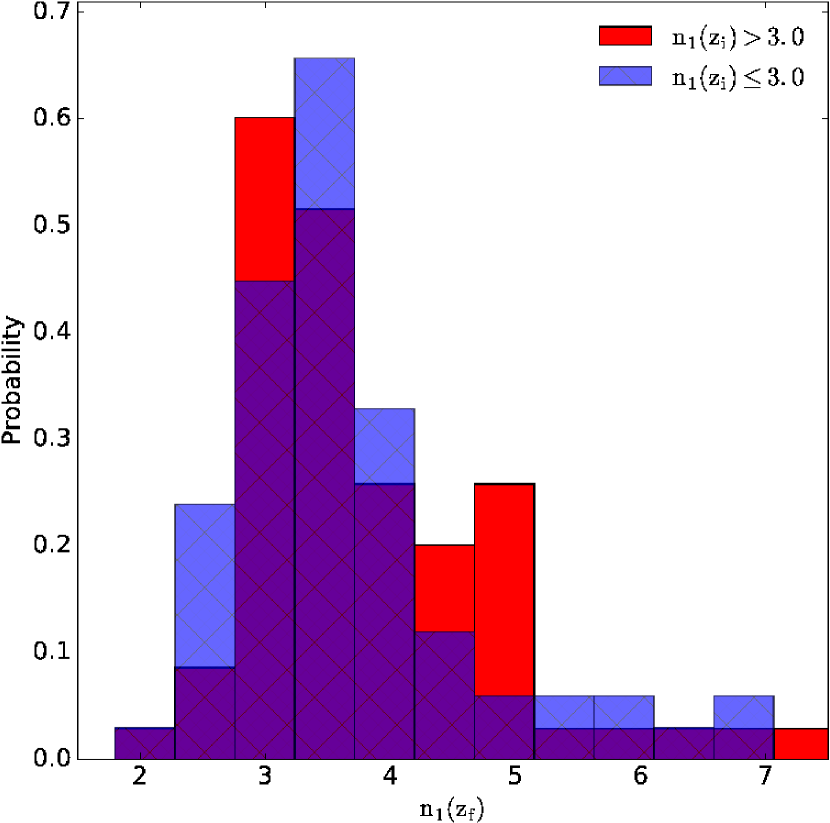
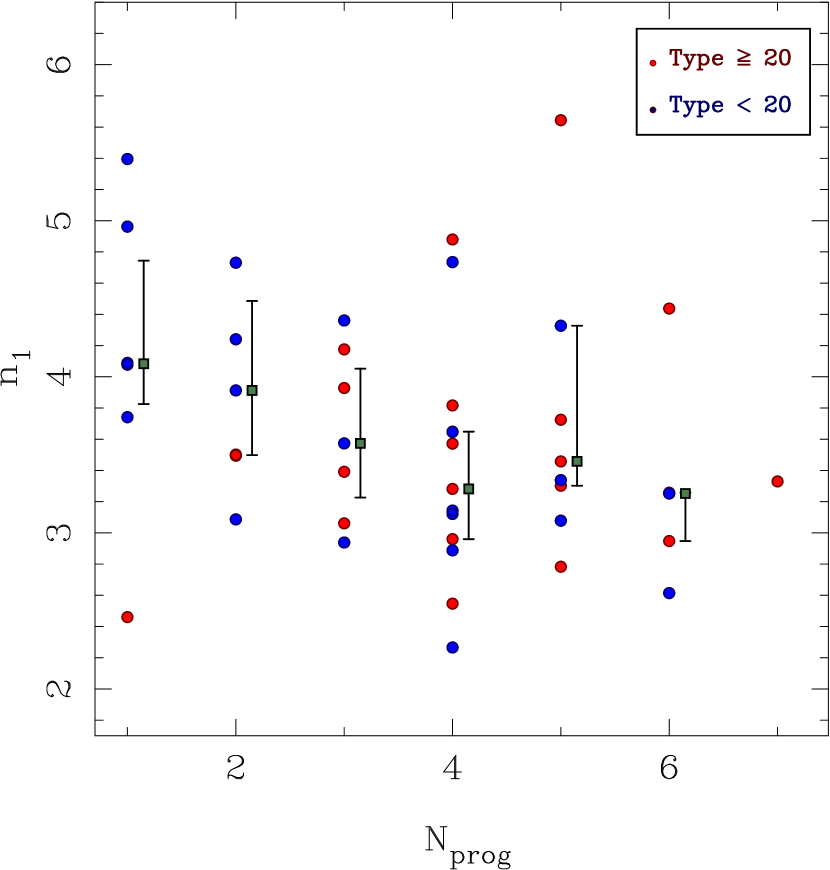
First- and second-ranked objects are also at variance regarding their radial distribution of starlight, which we have parameterized using the Sérsic shape index, , derived from fits to the integrated light profile. The differences, however, are to be found below , as the cumulative distribution functions of for both galaxy subtypes look pretty much the same above this limit, which accounts for of all the measurements. First-ranked galaxies show a relatively narrow distribution of values of , with about of them having light profiles reasonably well described by the de Vaucouleurs’ 1948 surface-density law, a special case of the Sérsic’s law with index . In contrast, of the second-ranked galaxies have . On the other hand, as we show in Figure 9, the structure of the precursor galaxies does not seem to make an appreciable impact on the light distribution of the central remnants (but see e.g. Fig. 6 in Taranu et al., 2013). This Figure depicts the fractional distribution of final Sérsic indices for our BGGs, , split into objects having a most massive input progenitor with Sérsic index (spheroid) and those in which (disc). The high degree of similarity shown by the blue and red histograms (corroborated by a two-sample Kolmogorov–Smirnov test) indicates that the final shapes of central galaxies do not correlate with the initial morphologies of their main progenitors. Another factor that might possibly be closely related to the structure of the central remnants is the number of mergers they experience during their assembly. In Figure 10 we depict against the number of relevant progenitors, . This plot shows that, notwithstanding the large dispersion in the final values of (also plain in Fig. 9), the central galaxies emerging from our simulations have typical inner structures characterized by Sérsic indices –4 whatever the number of merged progenitors, even in those cases in which is reduced to the minimum101010Note that the absence of mergers does not preclude galaxies for becoming dynamically hot through, e.g., recurrent collisions with small satellites or strong tidal interactions with neighbours.. It is worth noticing that both the spread of Sérsic index values and its cumulative distribution above match very closely the data from the BGGs present in the fossil groups studied by Méndez-Abreu et al. (2012).
Regarding the lack of correlation between and other variables, such as , it must be noted that the evolution of a dense system with about two dozens of galaxies that is collapsing under its own gravity is necessarily very complex. On this stage, group members not only may experience multiple mergers, but also, and independently, frequent collisions with neighbours that will produce all kinds of tidal disturbances. Besides, the design of our runs does not guarantee that all the resultant mock BGGs end up in a similar dynamical state. All this makes the behaviour of the final Sérsic index of our BGGs not as predictable as it might seem at first glance, as perfectly illustrates Figure 10. This plot shows that the precursors of the single-progenitor BGGs with the five highest values of , all above , are all actually disc galaxies, while the BGG with arises from a spheroid. The review of the fitting procedure, the random behaviour of the residuals, and the consistency of fit and SExtractor magnitudes, have convinced us that this is not a spurious result due to a bug in our fitting code, or to the small noise level assumed in our mock images, or to incorrect masking. At the same time, the study of the evolution of these objects shows that they are all relatively isolated large galaxies surrounded by multi-generation shell systems formed via recurrent collisions with a sizable number (–) of small satellites – it is precisely the low mass of the satellites that prevents them from merging with the central object for the duration of the runs. The absence of relevant mergers, however, has not prevented the main galaxies from becoming dynamically hot. In the case of the low- BGG, we have noted that the multiple passages of the satellites across the body of the main galaxy take place mostly along the same plane, which could favour phase mixing in the central regions and, therefore, the formation of a remnant with a less concentrated surface brightness distribution. Even so, the possibility that fits by a single Sérsic profile may not be the best method to characterize the stellar structure of such strongly perturbed galaxies should not be ruled out either. Either way, one would expect to be a reliable indicator of the overall structure for the well-mixed multi-merger systems.
In line with the last results, nor we have found in our simulations clear signs that the light distribution of first-ranked galaxies is in any way related to their stellar mass, the luminous mass of the host group or the sampling of the masses of the progenitors (see Figs. 4 (main), 5 (right) and 7). Also note that in Figure 10 data points have been coloured according to the mass-weighted morphology of all the relevant input progenitors, represented by the variable , which accounts for the percentage of the stellar mass of the BGG originated from spheroidal galaxies. We use a value of to separate those BGGs made mostly from discs from the rest. The absence of a clear segregation in the distribution of colours indicates that the morphological mix of progenitors has a negligible effect on the final shapes of central galaxies. This has been confirmed by applying a two-sample K-S test to the resulting probability distribution functions (PDFs) of final Sérsic indices.
We have seen that the effects of dynamical friction are specially noticeable in the brightest (more massive) members of a group. Therefore, the relative brightening of first-ranked galaxies holds important clues about the dynamical history of their local environment and can be used to compare different samples of galaxy associations. Tremaine & Richstone (1977) devised a couple of statistics related to the gap suitable for this task. These authors realized that within the statistical scenario the average magnitude difference between the first- and second-ranked members of a galaxy system must be of the same order as the size of the spread of both this magnitude difference, , and the brightest galaxy magnitude, , provided only that the numbers of galaxies in non-overlapping magnitude intervals behave as independent random variables (Scott, 1957). More specifically, Tremaine & Richstone demonstrated that under the hypothesis of independent luminosity sampling any set of galaxy aggregations built from ordinary LFs111111The LF does not have to be universal or continuous. must verify the following two inequalities:121212Note that and deal with magnitude differences of companion galaxies of the same (early) type. This eliminates first-order uncertainties associated with colour conversions, as well as redshift- and direction-dependent corrections, facilitating the comparison of data from heterogeneous sources.
| (17) |
Galaxy merging within isolated groups should reduce the values of and well below unity, making them inconsistent with random sampling of luminosity functions, as indicated by the results from both observations and cosmological simulations see Díaz-Giménez et al. 2012 and references therein.
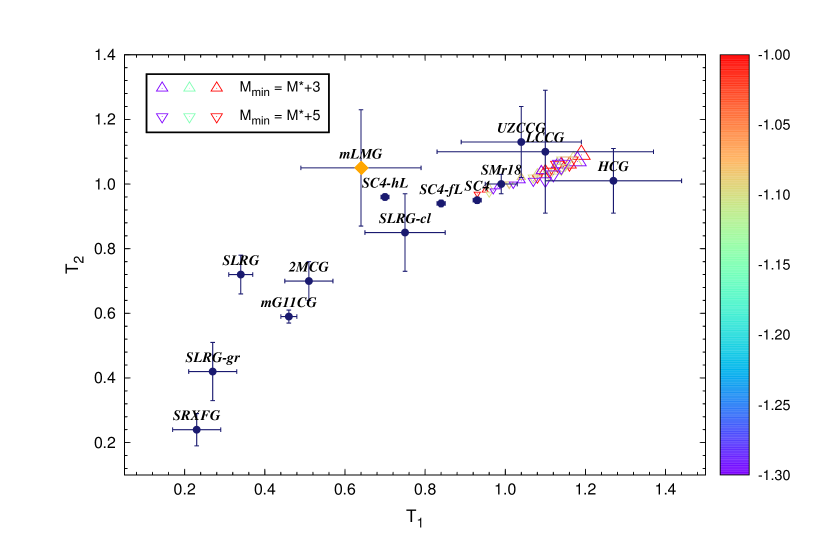
The two statistics defined in eqs. (17) are used in Fig. 11 to place our collection of simulated groups in relation to existing observed and mock catalogues of galaxy associations for which the values of and are either known or easily calculable from published data. Selected data sets include several compilations of compact groups (CGs), but also X-ray fossil groups, clusters, and fields with luminous red galaxies. For clarity, the main specifications of the catalogues, the number of galaxy systems included, , and their estimated values of and are summarized in Table 2. Note that in some cases, we also present results for subsets of these catalogues arising from partitions based on richness or luminosity.
Since the theoretical lower limits of eqs. (17) are derived under very general conditions about the form of the LF and considering galaxy aggregations with a large number of members, we have also included in Fig. 11 the expectation values for and that result from the statistical scenario under more realistic conditions. Specifically, we assume that the underlying LF can be reasonably approximated by a Schechter-type functional truncated at either mag or mag, with steepness ranging from to and normalization (richness) varying from 5 to 500 members. The averages and that we calculate from Monte Carlo realizations of each possible combination of the above constraints (coloured empty triangles in Fig. 11) are mainly sensitive to richness, moving from and , respectively, when both estimators are inferred for the largest galaxy associations (), to values marginally below the estimated thresholds when they are calculated for the poorest groups ().
As shown by Fig. 11 and Table 2, the estimates of the Tremaine & Richstone statistics for our groups at taken together are incompatible with the predictions from the statistical scenario. Still, the discrepancy essentially arises from the fact that our simulated groups show quite a broad first-second magnitude gap compared to the dispersion in (see also Fig. 6), which leads to a value of significantly smaller than the predictions of the statistical scenario within the quoted uncertainties inferred from bootstraps. In contrast, the estimator is consistent with random sampling conditions because of the large dispersion in the values of that characterizes our groups. This difference in the behaviour of the Tremaine & Richstone statistics, in which the first one points to the non-statistical origin of the data set but not the second, has been observed in complete and well-defined samples of groups/clusters of galaxies by Lin et al. (2010) and Shen et al. (2014, see their Fig. 13), suggesting that is perhaps a more sensitive estimator of the true nature of BGGs than . Taken together, our collection of mock isolated forming galaxy aggregations represents an intermediate situation between several non-BGG dominated compact group and cluster catalogues, including the spectroscopic followup by Hickson et al. (1992) of the well-known Hickson’s compact groups (Hickson, 1982, hereafter, HCGs) – whose full compatibility with the statistical hypothesis likely emanates from the use of selection algorithms biased against the inclusion of very dominant galaxies –, and the extremely merger-driven fossil groups selected by Proctor et al. (2011), which are characterized by significantly small values of (see Fig. 11). In very good agreement with these latter observations, our 10 groups verifying the condition mag yield and .
4.3 Evolution of the galaxy mass/luminosity function
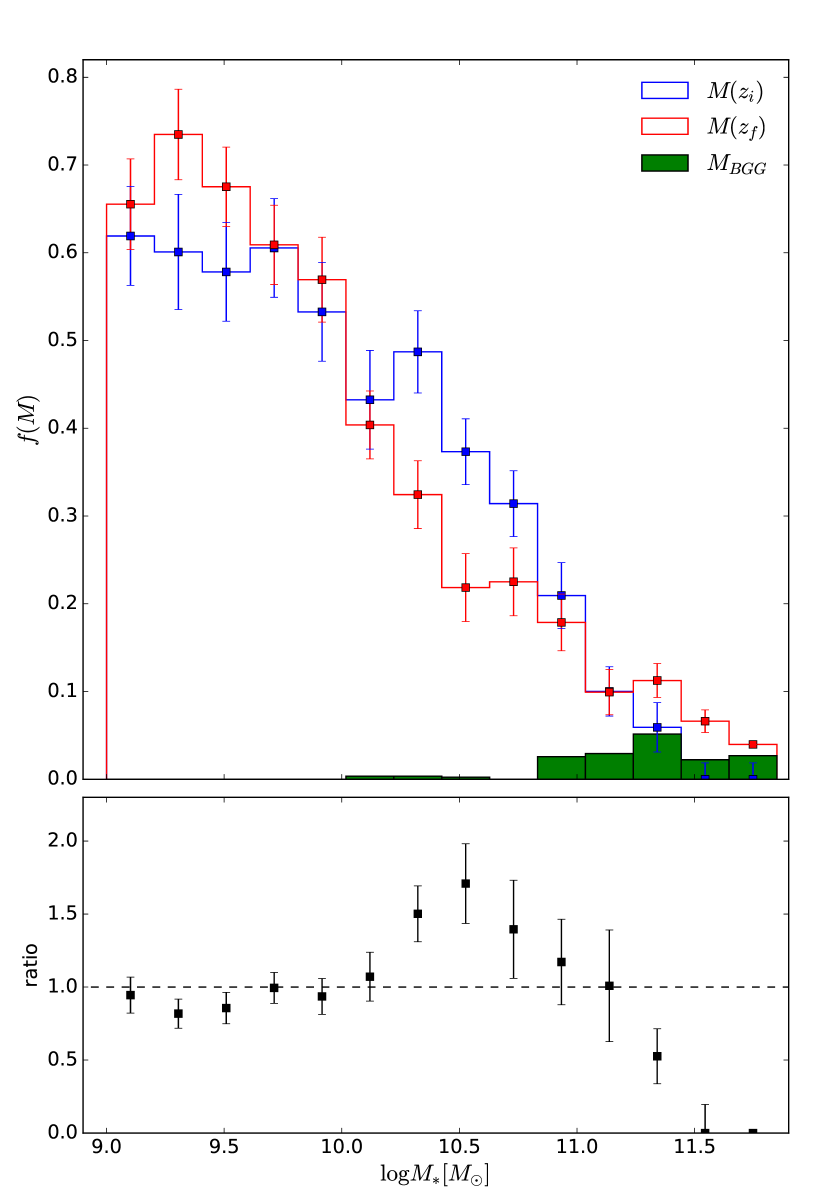
It is also instructive to examine the impact of the dynamics of group formation on the long-term evolution of the stellar mass function, or equivalently, the NIR LF of member galaxies. We do this in Fig. 12 where, in order to compensate for the small number of objects in each individual simulated group, we have co-added galaxies of similar stellar mass in our set of 48 collapsing groups to create a single PDF. This plot reveals that towards the end of the simulations, the composite luminous MF of galaxies develops a statistically significant hump at the high-mass end driven by the formation of first-ranked galaxies (most having , as shown by Fig. 6), which is accompanied by an also statistically significant dearth in the number of objects with intermediate mass. This dip in the moderate-mass regime () is reminiscent of the deficit of intermediate luminosity galaxies found in the class of small and very compact HCGs revealed in deep photometric surveys (e.g. Hunsberger, Charlton & Zaritsky, 1998), and has also been observed in the - and -band LFs of X-ray dim GEMS (Group Evolution Multiwavelength Study) groups reported by Miles et al. (2004), as well as in a very recent study of the study of the shape of the LF using data obtained by the fossil group origins (FOGO) project (Zarattini et al., 2015). As shown by Miles et al., the composite LF of the low- GEMS groups shows a bimodal shape with a bright-end hunch, a wide central depression of –3 magnitudes, and an upturn at the faint end, whereas that of the X-ray bright counterparts ( erg s-1) can be fitted with a single Schechter function over the entire range of the data. Both because of the location of the dip, which starts near the position of the ’knee’ of the original distribution, and because of its breadth, mag, and strength, the maximum deficit we measure is close to , we conclude that our simulated luminous MF of galaxies at is analogous to the bimodal LFs found in the small galaxy systems of the local universe suspected of undergoing rapid dynamical evolution.
5 Joint distribution of basic global properties: mock vs. real data
In this section we provide additional evidence favourable to the hierarchical dry merging formation scenario for first-ranked galaxies by comparing the joint distribution in 3D space of the most fundamental properties of mock central remnants with real data.
5.1 Selection of global parameters and control samples
For each galaxy we considered estimators of the half-stellar mass (-NIR-light) or effective radius, , the mean stellar velocity dispersion within , , and the mean stellar mass surface density within , (for which we use the same symbols usually adopted to represent surface brightness; see Sec. 4). We replace mass by surface density not just because the latter is a distance-independent quantity usually preferred by observers, but also because it makes the FP independent of scale, as its three dimensions are proportional to . Note also that the exact definitions of all these parameters are arbitrary as long as they can be directly related to the values of the basic properties of size, internal velocity and mass involved in the virial theorem.
We also considered four control samples of nearby ETGs built using different selection criteria. On one hand, we have chosen the catalogue of ETGs in clusters Norma and Coma by Mutabazi et al. (2014). These authors report 2MASS -band data derived from ESO New Technology Telescope Son of ISAAC images on effective radii and surface brightnesses, as well as velocity dispersions from Anglo-Australian Telescope 2dF spectroscopy for 31 early-type galaxies in the Norma cluster. For the Coma cluster, they use 2MASS images and SDSS velocity dispersion measurements for 121 objects. Since the reported velocity dispersions are corrected to the standardized physical aperture size of h-1 kpc, we transform them to following von der Linden et al. (2007) to ensure consistency with the values measured from our simulations. Total magnitudes are determined from surface brightness profile fitting. A second data source is the 6dFGS Fundamental Plane (6dFGSv) catalogue of nearly 9000 early-type galaxies in the local () universe (Campbell et al., 2014). In this data set, velocity dispersions are derived from 6dF -band spectral data, whereas the photometric FP parameters are inferred from seeing-convolved two-dimensional surface brightness fitting of the 2MASS images. The published catalogue includes only spectral measurements with km s-1 and lists velocity dispersions taken within arcsec diameter fibre aperture, that we also correct to . Another data set of similar characteristics is the sample of 1430 ETGs defined in La Barbera et al. (2008). These are galaxies extracted from a complete volume-limited catalogue of the SDSS-DR5 database in the redshift range – which have ETG-like SDSS spectroscopic and photometric parameters, reliable central velocity dispersions between and km s-1, and available -band photometry from the second data release of the UKIRT Infrared Deep Sky Survey (UKIDSS). Finally, we have selected the homogeneous set of 85 BCGs with extracted from the C4 cluster catalogue with Sloan -band photometry reviewed by Liu et al. (2008). These authors list velocity dispersions taken within a 3 arcsec fibre aperture and total fluxes measured in terms of the -band absolute magnitude at 25 mag arcsec-2. As in the previous cases, we correct for aperture size, while their magnitudes are converted into -band values by using the colour equation
| (18) |
To derive eq. (18), we have first determined by best-fitting to the multiband Coma cluster photometry (Eisenhardt et al., 2007) a linear transformation between and colours, then used the relations by Fukugita et al. (1995) to transform from to and, finally, applied the conversion from to Sloan magnitudes given by (Windhorst et al., 1991). The magnitudes resulting from this equation, which adds an extra scatter of about 0.1 magnitudes, are fully consistent with the stellar masses determined by the prescription of Bell et al. (2003) from -band luminosities and colours. We do not attempt, however, to correct for differences in the derivation of the total flux (i.e. model fitting versus isophotal magnitudes).
| Data Set | |||
|---|---|---|---|
| Simulated BGGs | 0.04 | 0.03 | 0.14 |
| 2nd.-ranked mock galaxies | 0.05 | 0.03 | 0.18 |
| Observed BCGs | 0.08 | 0.05 | 0.25 |
| Cluster spheroids | 0.10 | 0.06 | 0.32 |
| General ETG population | 0.14 | 0.08 | 0.45 |
5.2 The mass Fundamental Plane
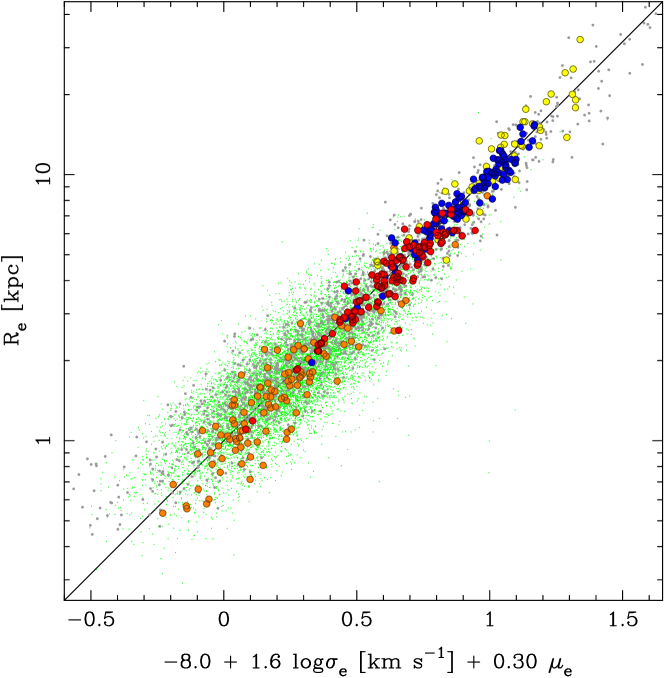
Fig. 13 shows an edge-on view of the mass FP defined by our mock first-ranked group galaxies (big dark-blue circles), fitted using orthogonal least squares, in the global parameter space :
| (19) |
where the quoted errors are median absolute deviations from bootstraps. We have also plotted in this figure the -band data points corresponding to the different classes of spheroidal systems included in the control data sets, as well as as to our second-ranked mock galaxies. The FP inferred from our simulations matches exceptionally well not just the mean tilt, but also the intercept of the relatively narrow flat 3-space surface delineated by the total set of observational data. The excellent visual agreement between data and simulations is quantitatively supported by the full consistency, within the statistical uncertainties, shown between equation (19) and the functional forms quoted in the three papers cited above dealing with control samples that use -band photometry. In the case of the Liu et al. (2008) BCGs’ sample, however, it is not possible to compare the fits directly. Finding the best-fitting model of a set of measurements is a complex problem that requires careful modelling of sample selection effects and a good determination of observational errors (see, e.g. Toribio et al., 2011). Since both are conditions difficult to fulfill with data coming from external sources, we have chosen to assess the level of agreement between the our FP and this fourth data set using only a qualitative approach. Thus, its is easy to convince ourselves that Fig. 13 also provides a reasonable edge-on view of Liu et al.’s observations based on the extreme narrowness exhibited by the BCGs point cloud perpendicularly to the direction delineated by our FP, which runs essentially through the data midsection with no noticeable signs of an offset.
Having established that equation (19) provides a reasonably good description of all the observed samples, we have grounds on which to estimate the r.m.s. deviations arising from the comparison of the response along each dimension, calculated from equation (19) using the other two dimensions as predictor variables, with the actual measurements. As Table 3 reveals, the scatter around the FP is connected to the ETG class, increasing as the typical stellar mass of the representatives of a class decreases. Our simulated massive central galaxies, as well as their second-ranked companions, have small residuals of typical size somewhat lower than those shown by the BCGs’ data. Overall, we find that these extreme galaxies are distributed more tightly around the FP than the bulk of spheroids in clusters, which in turn show a smaller scatter than that of the general ETG population. This is but another manifestation of the important regularity in the formation process of massive hot spheroids. The low dispersion of the measurements from our highest-ranked galaxy models demonstrate, in good harmony with other recent investigations of stochastic collisionless merging (Taranu et al., 2013), that this mechanism is capable of producing tight relations between fundamental parameters. It appears then that a realistic dissipationless merger hierarchy can naturally provide the conditions required to reproduce the small intrinsic scatter shown by the observed stellar-mass scaling laws (Nipoti et al., 2009). In view of the fact that such scalings not only quantify the behaviour and nature of first-ranked group galaxies, but are a primary tool for validating the formation path proposed for this class of objects, we have decided to pay to this particular issue the attention it deserves. For this reason, we do not to expand the present discussion any further and refer the interested reader to the more thorough analysis of the stellar-mass FP defined by our mock BGGs, its 2D projections in space, and their compatibility with the corresponding scalings observed in the local volume from different kinds of giant ETGs, that we present in a companion paper (Perea & Solanes, 2015).
6 Main results and conclusions
We have run a large suite of controlled multiple dry merger simulations of galaxies of various masses and morphologies in previrialized groups with twenty-five initial members. Our galaxy groups are evolved from an initial epoch, in which they behave essentially as a linearly expanding homogeneous perturbation, until the end of their first fully non-linear gravitational collapse, when the surviving galaxies adopt a compact configuration. These experiments aim to provide a large sample of cosmologically realistic hierarchical merger histories that allow for a fair assessment of the role played by gravity in the build-up of the most massive remnants of densely populated environments.
Under the hierarchical structure formation paradigm it is natural to expect that the observable properties of BGGs bear some relationship to the properties of the overdensity on which they have formed. We have found that in our previrialized groups both the magnitude of the first-ranked remnant and its degree of dominance, as measured by the magnitude difference between this and the next ranked galaxy, are positively correlated with the global stellar mass fraction of the parent halo, and hence with the initial total mass in bound subhaloes, the most determining property that controls the assembly histories in our simulations. The second of these relationships appears to be independent of the well-established covariance of the gap size with richness (e.g. Loh & Strauss, 2006), which suggests that these two later parameters are also dynamically connected. As pointed out by Hearin et al. (2013), Bayes’ Theorem implies that if BGG dominance were purely statistical, i.e. resulting from random draws from a given LF function, the magnitude gap between the two brightest galaxies would contain no information about mass that would not already be provided by the knowledge of richness. Actually, if one excludes the effect of sparse sampling of the LF, which biases high such dominance – and may partly explain the observed tendency of large-gap systems to have fewer members than their small-gap counterparts –, the results of the present work point to the fact that richness would act only as a secondary player in establishing the breadth of , which would be driven mainly by the initial mass distribution among the group members. As previously determined in the numerical modelling of massive clusters (e.g. Gao et al., 2004), we have found evidence that the dominance of the first-ranked members in dynamically evolved galaxy systems is essentially built up during the gravitational collapse that precedes their virialization. Our simulations show that the size and mass growth of a large fraction of central galaxies occurs at the expense, in a literal sense, of their lesser companions: many of our mock BGGs have been found to arise from the accretion into the largest precursor galaxy of mid-sized progenitors, the number of which is well correlated with the final luminosity achieved by the BGG. This implies that the brightening process of central remnants is for the most part special and therefore explains why their luminosities are generally inconsistent with a statistical extreme value population (Shen et al., 2014). Besides, we have observed that the preferential destruction of intermediate-mass objects produces a characteristic dip in the luminous MF of galaxies which bears many similarities with the central depression observed in the optical/NIR galaxy LF of X-ray dim groups by Miles et al. (2004) and other dynamically young systems. The connection between the presence of large gaps in the MF/LF of galaxy systems and the growth via dissipationless, dynamical friction-driven merging of their central galaxies has been recently confirmed by observational studies (Zarattini et al., 2015). In fact, the idea that the most massive galaxies in locally dense environments form at the expense of their moderately bright neighbours is already present in early theoretical treatments of merging, like the one developed by Cavaliere and co-workers as a complement of the canonical hierarchical clustering in galaxy aggregations (e.g. Cavaliere & Menci, 1997; Menci et al., 2002). Such a model shows that multiple binary collisions of satellite galaxies in low mass groups can effectively deplete the number of intermediate-mass objects (i.e. those having internal stellar velocities –200 km s-1 at the scales of interest), while barely affecting the abundance of the smallest satellites. This behaviour stems from the fact that the average merger rate, which is proportional to , with the relative velocity of galaxies within the parent halo, becomes gradually negligible for the galaxies having the lowest as the secular evolution of clustering makes the entire galaxy system progressively more massive. In addition, disrupted peripheral baryons coming from the destroyed galaxies may contribute to the generation of diffuse IGL which, in the case that includes new stars, can help to explain the presence of intragroup material bluer than the mean colour of the group galaxies, like in HCG79 (Da Rocha & Mendes de Oliveira, 2005).
The singular formation route of first-ranked objects also leaves its imprint on their internal configuration. Although this is an issue that we expect to address in more detail in future analyses, we have found some results regarding their light distribution that are worth commenting. Thus, our simulations show that, in contrast to the findings of similar former experiments (see, e.g. Taranu et al., 2013), the stellar structure of central galaxies assembled during the virialization of their parent haloes – quantified by the values of the Sérsic index of their integrated light profiles – bears no obvious relation to the morphologies and number of mergers/input progenitors, more numerous on average than for lesser group members. These results, and other checks done with our data, indicate that the final shapes of the BGGs, in most cases similar to those of classical ellipticals (Gonzalez, Zabludoff & Zaritsky, 2005; Bernardi et al., 2007), are not tied to the nature of the merging objects, nor to the characteristics of the parent galaxy system. This evidence suggests that the self-similarity in the profiles of our central galaxies comes primarily from the relatively large amount of orbital energy that our simulated mergers are expected to turn into random stellar motion during the formation of the host groups.
Finally, we have measured the most basic global properties of our mock central group remnants and compared their joint distribution in the global parameter space with real data from the local volume. We find that our BGGs define a thin mass FP relation which matches perfectly well both the slope and normalization of the distributions of different kinds of massive ETGs inferred at NIR wavelengths, thus providing a unifying relation uniting all kinds of giant ellipticals, from ordinary objects to the brightest members of groups and clusters. This successful reproduction of the observed tilted FP relation has not required the presence of gas in the progenitor galaxies. This is in sharp contrast with former dissipationless merger experiments of discs that, which with the exception of the early results by Aceves & Velázquez (2005) and the much more recent by Taranu et al. (2015), have systematically produced remnants that occupy a FP similar to that expected from the standard relation for virialized homologous systems: see also Perea & Solanes 2015.
Our dissipationless simulations of previrialized groups indicate that the formation of BGGs can be driven by the extensive (and intensive) merging accompanying the gravitational collapse of the parent structure. Therefore, the present experiments agree well with observational findings suggesting that massive ellipticals in the local universe have mostly grown from the inside out through dry mergers in the last 10 Gyr (see, e.g., van Dokkum et al., 2010, and references therein). They are also conceptually consistent with the "two-phase" scenario predicted in various studies on the formation histories and evolution of these objects in a cosmological context (e.g. De Lucia & Blaizot, 2007; Oser et al., 2010), in which most stars that end up in large galaxies are formed early within smaller structures, whereas the galaxies themselves are assembled at a later epoch (but see, however, Navarro-González et al., 2013). Specifically, Oser et al. propose that first-ranked galaxies grow considerably in mass and radius during an extended phase starting at of "ex situ" accretion and merging with smaller stellar systems (satellites) created in earlier times outside the virial radius of the forming central object. Their conclusions are based on the outcome of fully cosmological high-resolution re-simulations of 39 individual galaxies with present-day virial halo masses ranging from –. In these experiments galaxies accrete between about – of their present-day stellar mass (the upper limit corresponding to galaxies with ), with most of the assembly taking place towards lower redshift (). For the most massive systems this mass growth is not accompanied by significant star formation. On the other hand, the majority of their "in situ" created stars are formed quite early ; according to De Lucia & Blaizot (2007) up to of the stars are formed at , as observations suggest, fuelled mostly from cold gas flows. This scenario would also explain the seemingly anti-hierarchical behaviour that arises from the fact that the oldest stellar populations reside in most massive ETGs (e.g. De Lucia et al., 2006).
The results of the present controlled multiple merger simulations, together with those from former hydrodynamical experiments, suggest that dry hierarchical – increasingly minor (Hilz, Naab & Ostriker, 2013; Moody et al., 2014) – merging and dissipational merging should not be regarded as mutually exclusive pathways for the assembly of ETGs, but actually as supplementary scenarios. Our view is that both are essential to develop a complete physical understanding of the formation of the whole population of elliptical galaxies and the origin of the tight scaling relations that connect their global properties. The predominance of either formation route would be determined mostly by the local environment. In groups and proto-cluster regions, frequent collisions and a potential shortage of new cold gas would work together to assemble massive, slow-rotating red galaxies from a sequence of multiple and sometimes overlapping dry mergers of systems’ members – a process that certainly turns out to be particularly intense for the central remnants of groups and clusters, even compared to other similarly massive ETGs. On the other hand, fast-rotating, bluer ETGs of intermediate luminosity and discy isophotes would form via dissipational (essentially pairwise) merging, accompanied by a compact central starburst (Hopkins et al., 2008), mostly from gas-rich LTGs that abound in low-density environments. The scenario we are suggesting is, to some extent, reminiscent of the merging continuum idea that the importance of dissipation on the merger process must decline with increasing galaxy mass, proposed by Bender, Burstein & Faber (1992) (see also Kormendy, 1989) as a way to reconcile the CDM predictions on structure formation with data from the most luminous ellipticals in groups. Whatever the case, it is no less striking that such varied assembly routes for ETGs, as regards as to the nature of the progenitors and their expected impact on the evolution of the dark-matter-to-stellar ratio of the remnants, end up leading to a unique tight scaling of their most basic properties.
Acknowledgments
The authors wish to thank the referee, Dan Taranu, for his thorough revision of the manuscript and insightful comments and suggestions, which have helped to improve both the justification of the initial conditions of our simulations and the presentation of the results. This work was supported by the Program for Promotion of High-Level Scientific and Technical Research of Spain under contracts AYA2010-15169 and AYA2013-40609-P. The simulations of the present work have been performed with the Computer Service Infrastructure of the Spanish Instituto de Astrofísica de Andalucía (IAA).
This research is part of the IDILICO (Investigation of the DIffuse LIght COmponent in compact groups of galaxies) project, an international collaboration that runs simulations of the formation of groups of galaxies using high-performance computing resources (see our website at http://www.am.ub.edu/extragalactic/idilico/). Initially born to shed light on the origin of the unusually large fractions of diffuse intragroup light found in some compact groups of galaxies, IDILICO has now among its goals the creation of a comprehensive and unbiased sample of forming galaxy associations suited for investigating the aspects of galaxy evolution governed by gravitational dynamics, especially those driven by the multiple interactions and mergers that galaxies undergo in dense environments. Subsets of our numerical experiments are available upon request.
References
- Aceves & Velázquez (2005) Aceves H., Velázquez H., 2005, MNRAS, 360, L50
- Allam & Tucker (2000) Allam S. S., Tucker D. L., 2000, Astron. Nachr., 321, 101
- Athanassoula et al. (2001) Athanassoula E., Garijo A., García-Gómez C., 2001, MNRAS, 321, 353
- Barnes (1988) Barnes J. E., 1988, ApJ, 331, 699
- Barnes & Hernquist (1992) Barnes J. E., Hernquist L., 1992, ARA&A, 30, 705
- Bell et al. (2003) Bell E. F., McIntosh D. H., Katz N., Weinberg M. D. 2003, ApJS, 149, 289
- Bender et al. (1992) Bender R., Burstein D., Faber S. M., 1992, ApJ, 399, 462
- Berlind et al. (2006) Berlind A. A. et al., 2006, ApJS, 167, 1
- Bernardi et al. (2003a) Bernardi M. et al., 2003, AJ, 125, 1849
- Bernardi et al. (2003b) Bernardi M. et al., 2003, AJ, 125, 1866
- Bernardi et al. (2007) Bernardi M., Hyde J. B., Sheth R. K., Miller C. J., Nichol R. C., 2007, AJ, 133, 1741
- Bernstein & Bhavsar (2001) Bernstein J. P., Bhavsar S. P., 2001, MNRAS, 322, 625
- Bertin & Arnouts (1996) Bertin, E., Arnouts, S., 1996, A&A, 317, 393
- Bertschinger (1985) Bertschinger E., 1985, ApJS, 58, 39
- Bezanson et al. (2015) Bezanson R., Franx M., van Dokkum P. G., 2015, ApJ, 799, 148
- Bizyaev & Kajsin (2004) Bizyaev D., Kajsin S., 2004, ApJ, 613, 886
- Blanton et al. (2001) Blanton M. R. et al., 2001, AJ, 121, 2358
- Boily et al. (2001) Boily C. M., Kroupa P., Peñarrubia-Garrido J., 2001, New Astronomy, 6, 27
- Boylan-Kolchin et al. (2009) Boylan-Kolchin M., Springel V., White S. D. M., Jenkins A., 2009, MNRAS, 406, 896
- Bryan & Norman (1998) Bryan G., Norman M., 1998, ApJ, 495, 80
- Bullock et al. (2001) Bullock J. S., Kolatt T. S., Sigad Y., Somerville R. S., Kravtsov A. V., Klypin A. A., Primack J. R., Dekel A., 2001, MNRAS, 321, 559
- Campbell et al. (2014) Campbell L. A. et al., 2014, MNRAS, 443, 1231
- Cappellari et al. (2006) Cappellari M. et al., 2006, MNRAS, 366, 1126
- Carlberg (1986) Carlberg, R. G., 1986, ApJ, 310, 593
- Cattaneo et al. (2006) Cattaneo A., Dekel A., Devriendt J., Guiderdoni B., Blaizot J., 2006, MNRAS, 370, 1651
- Cavaliere & Menci (1997) Cavaliere A., Menci N., 1997, ApJ, 480, 132
- Ceverino et al. (2015) Ceverino D., Dekel A., Tweed D., Primack J., 2015, MNRAS, 447, 3291
- Coles & Lucchin (2002) Coles P., Lucchin F., 2002, Cosmology: The origin and Evolution of Cosmic Structure, John Wiley & Sons (2nd. ed.), England
- Courteau & Dutton (2015) Courteau S., Dutton A. A., 2015, ApJ, 801, L20
- Cox et al. (2006) Cox T. J., Dutta S. N., Di Matteo T., Hernquist L., Hopkins P. F., Robertson B., Springel V., 2006, ApJ, 650, 791
- Da Rocha & Mendes de Oliveira (2005) Da Rocha C., Mendes de Oliveira C., 2005, MNRAS, 364, 1069
- Dantas et al. (2003) Dantas C. C., Capelato H. V., Ribeiro A. L. B., de Carvalho R. R., 2003, MNRAS, 340, 398
- Darriba (2013) Darriba L., 2013, PhD thesis, Univ. of Barcelona, Barcelona
- Darriba & Solanes (2010) Darriba L., Solanes J. M., 2010, A&A, 516, A7
- De Lucia et al. (2006) De Lucia G., Springel V., White S. D. M., Croton D., Kauffmann G., 2006, MNRAS, 366, 499
- De Lucia & Blaizot (2007) De Lucia G., Blaizot J., 2007, MNRAS, 375, 2
- de Vaucouleurs (1948) de Vaucouleurs G., 1948, Annales d’Astrophysique, 11, 247
- Dehnen & Aly (2012) Dehnen W., Aly H., 2012, MNRAS, 425, 1068
- Desroches et al. (2007) Desroches L.-B., Quataert E., Ma C.-P., West A. A., 2007, MNRAS, 377, 402
- Diaferio et al. (1994) Diaferio A., Geller M. J., Ramella M., 1994, AJ, 107, 868
- Díaz-Giménez et al. (2012) Díaz-Giménez E., Mamon G. A., Pacheco M., Mendes de Oliveira C., Alonso M. V., 2012, MNRAS, 426, 296
- Djorgovski & Davis (1987) Djorgovski S., Davis M., 1987, ApJ, 313, 59
- Dressler et al. (1987) Dressler A., Lynden-Bell D., Burstein D., Davies R. L., Faber S. M., Terlevich R., Wegner G., 1987, ApJ, 313, 42
- Dubinski (1998) Dubinski J., 1998, ApJ, 502, 141
- Dutton et al. (2011) Dutton A. A. et al., 2011, MNRAS, 416, 322
- Eisenhardt et al. (2007) Eisenhardt P. R., De Propris R., Gonzalez A. H., Stanford S. A., Wang M., Dickinson M., 2007, ApJS, 169, 225
- Ellis (2008) Ellis R. S., 2008, in Loeb A., Ferrara A., Ellis R.S., eds., First Light in the Universe, Saas-Fee Advanced Course Num. 36. Springer-Verlag, Berlin, p. 259
- Emsellem et al. (2007) Emsellem E. et al., 2007, MNRAS, 379, 401
- Focardi & Kelm (2002) Focardi P., Kelm B., 2002, A&A, 391, 35
- Fukugita et al. (1995) Fukugita M., Shimasaku K., Ichikawa T., 1995, PASP, 107, 945
- Gao et al. (2004) Gao L., Loeb A., Peebles P. J. E., White S. D. M., Jenkins A., 2004, ApJ, 614, 17
- Gao et al. (2011) Gao L., Frenk C. S., Boylan-Kolchin M., Jenkins A., Springel V., White S. D. M., 2011, MNRAS, 410, 2309
- Giocoli et al. (2007) Giocoli C., Moreno J., Sheth R. K., Tormen G., 2007, MNRAS, 376, 977
- Gonzalez et al. (2005) Gonzalez A. H., Zabludoff A. I., Zaritsky D., 2005, ApJ, 618, 195
- Governato et al. (1996) Governato F., Cavaliere A., Tozzi P., 1996, ApJ, 458, 18
- Graham (2001) Graham A. W., 2001, AJ, 121, 820
- Guo et al. (2011) Guo Q. et al., 2011, MNRAS, 413, 101
- Hansen et al. (2009) Hansen S. M., Sheldon E. S., Wechsler R. H., Koester B. P., 2009, ApJ, 699, 1333
- Harker et al. (2006) Harker G., Cole S., Helly J., Frenk C., Jenkins A., 2006, MNRAS, 367, 1039
- Hearin et al. (2013) Hearin A. P., Zentner A. R., Newman J. A., Berlind A. A., 2013, MNRAS, 430, 1238
- Hernquist (1990) Hernquist L., 1990, ApJ, 356, 359
- Hernquist (1992) Hernquist L., 1992, ApJ, 400, 460
- Hernquist (1993) Hernquist L., 1993, ApJ, 409, 548
- Hickson (1982) Hickson P., 1982, ApJ, 255, 382
- Hickson et al. (1992) Hickson P., Mendes de Oliveira C., Huchra J. P., Palumbo G. G., 1992, ApJ, 399, 353
- Hilz et al. (2013) Hilz M., Naab T., Ostriker J. P., 2013, MNRAS, 429, 2924
- Hopkins et al. (2008) Hopkins P. F., Cox T. J., Hernquist L., 2008, ApJ, 689, 17
- Huang et al. (2012) Huang S., Haynes M. P., Giovanelli R., Brinchmann J., 2012, ApJ, 756, 113
- Huertas-Company et al. (2013) Huertas-Company M. et al., 2013, MNRAS, 428, 1715
- Hunsberger et al. (1998) Hunsberger S. D., Charlton J. C., Zaritsky D., 1998, ApJ, 505, 536
- Hyde & Bernardi (2009) Hyde J. B., Bernardi M., 2009, MNRAS, 394, 1978
- Jones et al. (2003) Jones L. R., Ponman T. J., Horton A., Babul A., Ebeling H., Burke D. J., 2003, MNRAS, 343, 627
- Kassin et al. (2012) Kassin S. A. et al., 2012, ApJ, 758, 106
- Kauffmann & Charlot (1998) Kauffmann G., Charlot S., 1998, MNRAS, 297, L23
- Kelvin et al. (2014) Kelvin L. S. et al., 2014, MNRAS, 444, 1647
- Klypin et al. (2002) Klypin A., Zhao H., Somerville R. S., 2002, ApJ, 573, 597
- Kochanek et al. (2001) Kochanek C. S. et al., 2001, ApJ, 560, 566
- Komatsu et al. (2008) Komatsu E. et al., 2009, ApJS, 180, 330
- Kormendy (1989) Kormendy J., 1989, ARA&A, 27, 235
- Kuntschner et al. (2002) Kuntschner H., Smith R. J., Colless M., Davies R. L., Kaldare R., Vazdekis A., 2002, MNRAS, 337, 172
- La Barbera et al. (2003) La Barbera F., Busarello G., Merluzzi P., Massarotti M., Capaccioli M., 2003, ApJ, 595, 127
- La Barbera et al. (2008) La Barbera F., Busarello G., Merluzzi P., de la Rosa I. G., Coppola G., Haines C. P., 2008, ApJ, 689, 913
- La Barbera et al. (2010) La Barbera F., Lopes P. A. A., de Carvalho R. R., de La Rosa I. G., Berlind A. A., 2010, MNRAS, 408, 1361
- Lacey & Ostriker (1985) Lacey C. G., Ostriker J. P., 1985, ApJ, 299, 633
- Li et al. (2006) Li G-L., Mao S., Jing Y. P., Kang X., Bartelmann M., 2006, ApJ, 652, 43
- Li et al. (2007) Li Y., Mo H. J., van den Bosch F. C., Lin W. P., 2007, MNRAS, 379, 689
- Lin & Mohr (2004) Lin Y.-T., Mohr J. J., 2004, ApJ, 617, 879
- Lin et al. (2010) Lin Y.-T., Ostriker J. P., Miller C. J., 2010, ApJ, 715, 1486
- Liu et al. (2008) Liu F. S., Xia X. Y., Mao S., Wu H., Deng Z. G., 2008, MNRAS, 385, 23
- Loeb & Peebles (2003) Loeb A., Peebles P. J. E., 2003, ApJ, 589, 29
- Loh & Strauss (2006) Loh Y.-S., Strauss M. A., 2006, MNRAS, 366, 373
- Longhetti & Saracco (2009) Longhetti, M., Saracco, P., 2009, MNRAS, 394, 774
- Macciò et al. (2008) Macciò A. V., Dutton A. A., van den Bosch F. C., 2008, MNRAS, 391, 1940
- Manrique et al. (2003) Manrique A., Raig A., Salvador-Solé E., Sanchis T., Solanes J. M., 2003, ApJ, 593, 26
- McBride et al. (2009) McBride J., Fakhouri O., Ma C.-P., 2009, MNRAS, 398, 1858
- McGaugh & Schombert (2014) McGaugh S. S., Schombert J. M., 2014, AJ, 148, 77
- Menci et al. (2002) Menci N., Cavaliere A., Fontana A., Giallongo E., Poli F., 2002, ApJ, 575, 18
- Méndez-Abreu et al. (2012) Méndez-Abreu J. et al., 2012, A&A, 537, A25
- Merritt (1985) Merritt D., 1985, ApJ, 289, 18
- Miles et al. (2004) Miles T. A., Raychaudhury S., Forbes D. A., Goudfrooij P., Ponman T. J., Kozhurina-Platais V., 2004, MNRAS, 355, 785
- Mo et al. (1998) Mo H. J., Mao S., White S. D. M., 1998, MNRAS, 295, 319
- Mo et al. (2010) Mo H., van den Bosch F. C., White S. D. M., 2010, Galaxy Formation and Evolution. Cambrige University Press, Cambridge
- Moody et al. (2014) Moody C. E., Romanowsky A. J., Cox T. J., Novak G. S., Primack J. R., 2014, MNRAS, 444, 1475
- Mutabazi et al. (2014) Mutabazi T., Blyth S. L., Woudt P. A., Lucey J. R., Jarrett T. H., Bilicki M., Schröder A. C., Moore S. A. W., 2014, MNRAS, 439, 3666
- Naab et al. (2006) Naab T., Khochfar S., Burkert A., 2006, ApJ, 636, L81
- Naab et al. (2009) Naab T., Johansson P. H., Ostriker J. P., 2009, ApJ, 699, L178
- Navarro et al. (1997) Navarro J. F., Frenk C. S., White S. D. M., 1997, ApJ, 490, 493 (NFW)
- Navarro-González et al. (2013) Navarro-González J., Ricciardelli E., Quilis V., Vazdekis A., 2013, MNRAS, 436, 3507
- Nipoti et al. (2009) Nipoti C., Treu T., Auger M. W., Bolton A. S., 2009, ApJ, 706, L86
- Novak (2008) Novak G. S., 2008, PhD thesis, Univ. of California, Santa Cruz
- Oser et al. (2010) Oser L., Ostriker J. P., Naab T., Johansson P. H., Burkert A., 2010, ApJ, 725, 2312
- Oser et al. (2012) Oser L., Naab T., Ostriker J. P., Johansson P. H., 2012, ApJ, 744, 63
- Padmanabhan et al. (2004) Padmanabhan N. et al., 2004, New Astronomy, 9, 329
- Perea & Solanes (2015) Perea J. D., Solanes J. M., 2016, MNRAS, submitted (Paper II)
- Ponman et al. (1994) Ponman T. J., Allan D. J., Jones L. R., Merrifield M., McHardy I. M., Lehto H. J., Luppino G. A., 1994, Nature, 369, 462
- Postman & Lauer (1995) Postman M., Lauer T. R., 1995, ApJ, 440, 28
- Postman et al. (2005) Postman, M. et al., 2005, ApJ, 623, 721
- Proctor et al. (2011) Proctor R. N. et al., 2011, MNRAS, 418, 2054
- Puchwein et al. (2010) Puchwein E., Springel V., Sijacki D., Dolag K., 2010, MNRAS, 406, 936
- Robertson et al. (2006) Robertson B., Cox T. J., Hernquist L., Franx M., Hopkins P. F, Martini P., Springel V., 2006, ApJ, 641, 21
- Ruszkowski & Springel (2009) Ruszkowski M., Springel V., 2009, ApJ, 696, 1094
- Sáiz et al. (2004) Sáiz A., Domínguez-Tenreiro R., Serna A., 2004, ApJ, 601, L131
- Salvador-Solé et al. (2005) Salvador-Solé E., Manrique A., Solanes J. M., 2005, MNRAS, 358, 901
- Sandage (1972) Sandage A., 1972, ApJ, 178, 1
- Saracco et al. (2006) Saracco P., Fiano A., Chincarini G., Vanzella E., Longhetti M., Cristiani S., Fontana A., Giallongo E., Nonino M., 2006, MNRAS, 367, 349
- Saslaw (1987) Saslaw W. C., 1987, Gravitational Physics of Stellar and Galactic Systems. Cambridge University Press, Cambridge, p., 9
- Schechter (1976) Schechter P., 1976, ApJ, 203, 297
- Schombert (1986) Schombert J., 1986, ApJS, 60, 603
- Scott (1957) Scott E., 1957, AJ, 62, 248
- Shaw et al. (2006) Shaw L. D., Weller J., Ostriker J. P., Bode P., 2006, ApJ, 646, 815
- Shen et al. (2003) Shen S., Mo H. J., White S. D. M., Blanton M. R., Kauffmann G., Voges W., Brinkmann J., Csabai I., 2003, MNRAS, 343, 978
- Shen et al. (2014) Shen S., Yang X., Mo H. J., van den Bosch F. C., More S., 2014, ApJ, 782, 23
- Smith et al. (2009) Smith A. J., Loveday J., Cross N. J. G., 2009, MNRAS, 397, 868
- Springel (2005) Springel V., 2005, MNRAS, 364, 1105
- Springel et al. (2005) Springel V. et al., 2005, Nature, 435, 629
- Springel & White (1999) Springel V., White S. D. M., 1999, MNRAS, 307, 162
- Stewart et al. (2008) Stewart K. R., Bullock J. S., Wechsler R. H., Maller A. H., Zentner A. R., 2008, ApJ, 683, 597
- Taranu et al. (2013) Taranu D. S., Dubinski J., Yee H. K. C., 2013, ApJ, 778, 61
- Taranu et al. (2015) Taranu D. S., Dubinski J., Yee H. K. C., 2015, ApJ, 803, 78
- Toribio et al. (2011) Toribio M. C., Solanes J. M., Giovanelli R., Haynes M. P., Martin A. M., 2011, ApJ, 732, 93
- Tremaine & Richstone (1977) Tremaine S. D., Richstone D. O., 1977, ApJ, 212, 311
- Trujillo et al. (2006) Trujillo I. et al., 2006, ApJ, 650, 18
- Trujillo & Pohlen (2005) Trujillo I., Pohlen M., 2005, ApJ, 630, L17
- van Dokkum et al. (2010) van Dokkum P. G. et al., 2010, ApJ, 709, 1018
- von Benda-Beckmann et al. (2008) von Benda-Beckmann A. M., D’Onghia E., Gottlöber S., Hoeft M., Khalatyan A., Klypin A., Müller V., 2008, MNRAS, 386, 2345
- von der Linden et al. (2007) von der Linden A., Best P. N., Kauffmann G., White S. D. M., 2007, MNRAS, 379, 867
- Vulcani et al. (2014) Vulcani B. et al, 2014, ApJ, 797, 62
- Wechsler et al. (2002) Wechsler R. H., Bullock J. S., Primack J. R., Kravtsov A. V., Dekel A., 2002, ApJ, 568, 52
- Wendland (1995) Wendland H., 1995, Advances Comput. Math., 4, 389
- Windhorst et al. (1991) Windhorst R. A. et al., 1991, ApJ, 380, 362
- White et al. (2003) White P. M., Bothun G., Guerrero M. A., West M. J., Barkhouse W. A., 2003, ApJ, 585, 739
- Zarattini et al. (2015) Zarattini S. et al., 2015, A&A, preprint (arXiv:1506.03076)
Appendix A Two-body heating in our galaxies
In this Appendix, we turn to an inspection of the effects of numerical heating in our mock galaxies. This is done by running in isolation two of our (elliptical and disc) galaxy models at different resolutions. Specifically, we have evolved one elliptical model and one disc model with about stellar particles each, aimed to represent galaxies with a total mass of in our simulations, as well as versions of both kinds of galaxies with a factor ten drop in resolution, in this case intended to portray Magellanic-cloud-sized objects with a total mass of . A fifth simulation that reproduces again the same elliptical galaxy model, but using this time only stellar particles, has been run to study the stability of the most extremal low-resolution objects included in our simulations. The settings of the different components in terms of mass-resolution, softening of the gravitational potential and timestep are the same used for the group simulations. Numerical stability is investigated by means of a simple test consisting in following for a total of six simulation time units (i.e., nearly 12 Gyr) the evolution of both the characteristic size of the luminous component of the galaxies, , directly measured from particle counts projected onto the main symmetry plane of the galaxies, and the average l.o.s. velocity dispersion within this radius, .
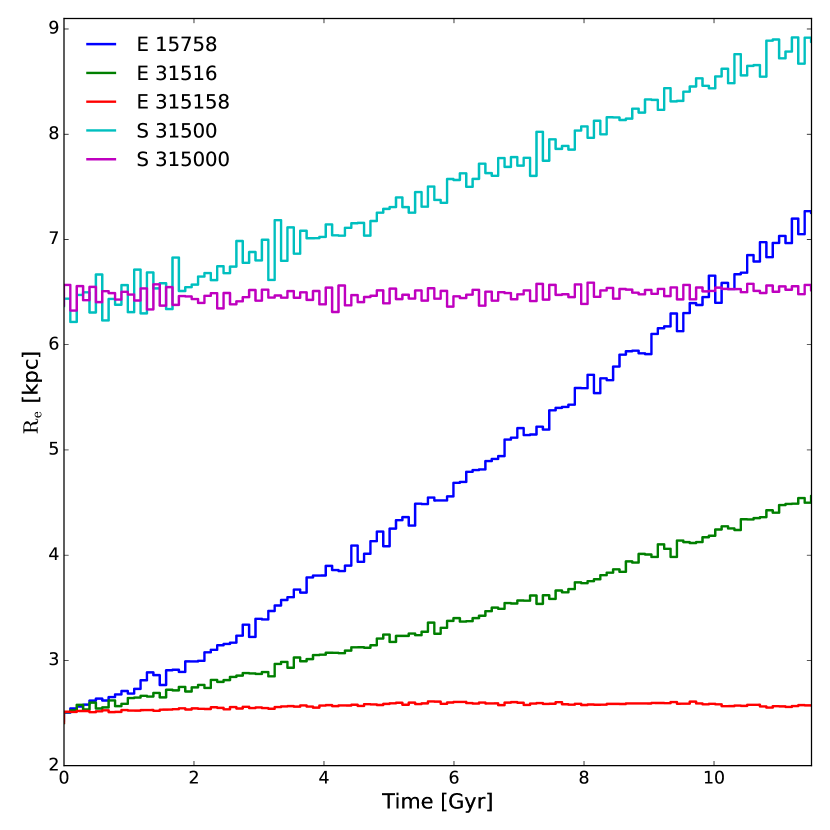
As shown in Fig. 14, the secular variation of parameter is basically linear throughout most of the whole testing process and, as expected, strongly resolution dependent. We find that the size of our highest resolution models changes very little, with average fractional growths at the level per Gyr for the spheroid, while the of the exponential disc remains essentially constant even after 12 Gyr, with oscillations between consecutive values that in no case exceed . On the other hand, the size of our moderately resolved galaxies made with ten times less particles experiences only a variation in the first 2 Gyr for the disc model, followed by an steeper increase at an average rate of about per Gyr. This last figure approximately doubles for its elliptical counterpart, leading to a cumulative deviation of about ( for the disc model) after 6 Gyr, the typical time after which the merger rate in our groups becomes significant. These values can be compared with the intrinsic dispersion in the (logarithm) of the distribution of early-type galaxy sizes at fixed absolute magnitude, (Bernardi et al., 2003a), which is near for the typical value of .
As regards the variations in , they behave similarly to those of , but with elliptical and discs exchanging roles regarding the amplitude of the variations. Thus, this parameter remains essentially constant for our highest-resolution elliptical model after 12 Gyr, while for the disc model increases at a modest rate of around per Gyr. For the moderately resolved models we record increases of less than one per cent for the elliptical model and up to per Gyr for the disc one.
Finally, in the case of the centrally concentrated k-star particle model, we find that numerical heating becomes a more serious issue. The size parameter of such a low-resolution spheroid deteriorates at a rate about twice as fast on average than that of their k-star counterparts, approaching a 70 per cent variation in 6 Gyr. In contrast, their central velocity dispersion is much more stable, registering total increments that barely exceed in the same period of time131313Also note that this simple test provides an upper limit to the effects of two-body heating, as in our group simulations the concentration of the galaxies increases with decreasing mass.. In either case, we recall that these last numbers are not a real concern since, as has been already stressed on the main text, galaxies that small play a merely testimonial role in the formation process of the BGGs investigated in the present work.
Appendix B Evolution of halo properties with cosmic time
In this Appendix, we describe the model adopted for the growth of our galaxy dark haloes and comment on its implications on the time dependence of the fundamental shape parameters of this component.
A rough estimate of the mass aggregation rate to which our mock galaxies may be subject during the evolution of their parent groups can be inferred from the physical model by Salvador-Solé, Manrique & Solanes 2005; see also Manrique et al. 2003. This model is based on the premise that the universal spherically averaged density profile of relaxed dark matter haloes does not depend on the halo aggregation history. Such a property stems from the fact that the parameters used to characterize the dark haloes of galaxies, namely the scale radius and its directly related mass within it, are determined at any redshift by essentially the current total mass and energy of the haloes, as well as by their respective instantaneous accretion rates. This means that relaxed haloes emerging from major mergers, which lead to the structural rearrangement of their progenitors, should show radial profiles indistinguishable from those of haloes with identical global properties (in particular, identical virial mass) and boundary conditions, but having endured instead a more gentle growth. As Salvador-Solé et al. (2005) show, this is an approach fully consistent with the results of high-resolution cosmological -body simulations.
The preservation of the inner structure of dark haloes predicted by this inside-out growth scheme (see also Loeb & Peebles, 2003; Boylan-Kolchin et al., 2009), provides the means to estimate the typical fractional mass increase endured by a galactic halo along a given period of time. To do this in a manner independent of the exact form of the dark halo profile, we combine the assumed invariance of between the initial and final redshifts of our simulations, with the expression for the halo virial radius in Eq. (7), the definition of the concentration parameter and the mass concentration relation in Eq. (12). Then, it is straightforward to show that for haloes of any mass
| (20) |
where is the power-law index of the median – relation adopted (Eq. (12)).
According to Equation (20), the fractional increase of the mass of a relaxed galactic halo between and depends only on the cosmology under consideration (through the ratio of ’s and )141414This halo growth model preserves the ratio at all and, hence, the halo MF in reduced mass units. This is equivalent to state that there is no differential evolution in the MF of haloes.. When applied to our simulations, Equation (20) implies that the progenitors of galaxies are objects with virial masses typically a factor lower. The corresponding reduction in the virial radius can be calculated from Equation 7.
Appendix C Density evaluation
All density maps presented in this paper have been obtained calculating the mass surface density using a smoothed particle hydrodynamics kernel on the projected particle distributions, in the form (cf. Dehnen & Aly, 2012)
| (21) |
where is the density estimate at the coordinate of the particle/pixel, the smoothing kernel and the smoothing scale. Specifically, we use the Wendland isotropic C2 kernel with compact support
| (22) |
where for two dimensions ). We have fixed to ten times the Plummer-equivalent softening length of star particles ( pc), deliberately ignoring the recommended adaption of this parameter such that for dimensions (Li et al., 2006). We have done so motivated by the large number of bodies in our simulations, which is sufficient to warrant a low noise level, as well as by our desire to visually enhance the contrast of the lowest density substructures of intergalactic light that are created as a result of galaxy collisions (see Fig. 3). Adaptive smoothing will be used in future work when we study in detail the structure and kinematics of massive merger remnants.
For calculations done using single particle positions it becomes necessary to speed up density evaluation. In such cases, we first create a partition of the two-dimensional space by recursively subdividing it into four quadrants containing at most a prefixed number of bodies. In this manner, for each particle we only need to locate the adjacent cells containing particles that may enter in the sum (21). This dramatically reduces the number of inter-particle separations that must be computed.