Butterfly Diagram and Carrington Maps for Century-Long Ca ii K Spectroheliograms from Kodaikanal Observatory
Abstract
The century-long (1907-2007) Ca ii K spectroheliograms from Kodaikanal Solar Observatory (KSO) are calibrated, processed and analysed in the present study to follow the evolution of bright on disc structures called plages, the possible representatives of magnetic activity on the Sun. This has been the longest dataset studied in Ca ii K till date covering about 9.5 cycles of 11 year periods. Plages were segmented with area using global thresholds for individual full disc images and subsequent application of morphological closing operation. Plage index was calculated and seen to have close positive correlation with fractional disc area covered by plages. The newly generated plage area cycle (from KSO) was compared with the same from Mount Wilson observatory (Correlation ) for the overlapping years i.e. 1915-2000. Study illustrated time-latitude distribution of plage centroids rendering butterfly diagram (as observed for sunspots). The 3D visualisation of the diagram showed one to one mapping between plage location, time and area. This work further delineated positional correlation between magnetic patches and plage regions through comparison of synoptic maps derived from both Kodaikanal Ca ii K images and space based full disc LOS (line of sight) magnetograms. Regular synoptic magnetograms from ground based observatories are available only after 1970s. Thus the long term Ca ii K data from KSO can be used as a proxy for estimating magnetic activity locations and their strengths at earlier times.
1 Introduction
Astronomical objects like stars are embedded with self organising system behaviour which is expressed in different scales and modes over time. Multimodal long duration data may assist in gaining insight about such complex system dynamics. Being a part of the solar system it is of particular interest for us to study the evolution of spatially resolved features on the Sun. In this regard, long term data available from different ground based observatories provide valuable informations at different wavelengths. Ca ii K (3933.67 Å), line of singly ionised calcium, is one such study wavelength. This absorption line extends facts about solar chromosphere (Stix, 2004). Intensities observed through this line are dependent on magnetic field strength. Locations of higher magnetic fields are correlated with bright regions in Ca ii K solar intensity images (Sheeley et al., 2011; Harvey & Worden, 1998). Thus the Ca ii K line emission provides a good proxy for line of sight magnetic field fluxes, particularly for a historical period where regular direct magnetic field measurements are not available (Skumanich et al., 1975; Schrijver et al., 1989). The Kodaikanal Solar Observatory (KSO) has archived full disc Ca ii K spectroheliograms for more than a century (1906 to mid 2007), using photographic plates as recorded through a telescope having a 30 cm objective with f-ratio of f/21 (Priyal et al., 2014b). The effective spatial resolution was about 2 arcsec for majority of the documentation time. Recently, 16 bit digitisation has been performed on those plates through a CCD sensor (pixel size 15 micron cooled at C) to generate raw images. This data provides a significant temporal window (Foukal et al., 2009) to study the evolution of solar activity while studying the variation of disc structures, namely plages, filaments, sunspots (Zharkova et al., 2005). While comparing the quality of different Ca ii K images as recorded from Arcetri, Kodaikanal, and Mount Wilson observatories Ermolli et al. (2009) concluded that KSO provides a homogeneous and the longest series. Note that this comparison was made based on earlier low resolution scanned images (as obtained from KSO) and the need for higher resolution digitisation was pointed out by Ermolli et al. (2009). First results from the new digitisation process was reported in Priyal et al. (2014b) using KSO data on Ca ii K for the period 1955-1985. We have recalibrated the data for the full 100 years and are presenting the first results from the new time series. The extracted data through this study is also being made available to the scientific community for further processing. The digitised data is available through https://kso.iiap.res.in/data.
Few earlier studies have reported identification of chromospheric features, to generate time series for the understanding the long term variation of their sizes and location. But none of them used century-long data, which allows us to study several solar cycles and inter-cycle variation and this may help in our understanding of the the solar dynamo model (Jin & Wang, 2015). In the context of data processing, detection methods typically rely on intensity contrast and size of target features. However, contrast may differ between images causing mis-detection of structures. Also, such techniques suffer from fragmentation of segmented features resulting in centroid detection error (Zharkova et al., 2005). In the present work we used newly digitised higher resolution century-long KSO Ca ii K data for automated plage detection. This generated a number of time series (viz. area cycle, butterfly diagram and their combination) to facilitate the study of solar activity variation keeping in mind the limitations and constraints. Section 2 illustrates the image statistics, calibration, enhancement and processing techniques. The data was also exploited to generate synoptic Carrington Rotation (CR) maps. Section 3 depicts plage area cycle, butterfly diagrams and positional correlation of some Ca ii K CR maps with the same generated from line of sight magnetograms. The CR maps corresponding to the 100 years data are available online (supplementary material). We discuss the relevance of our results and present our conclusions in Section 4.
2 Methods
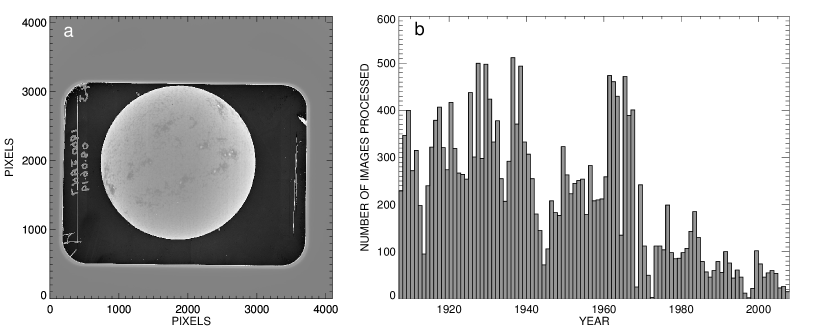
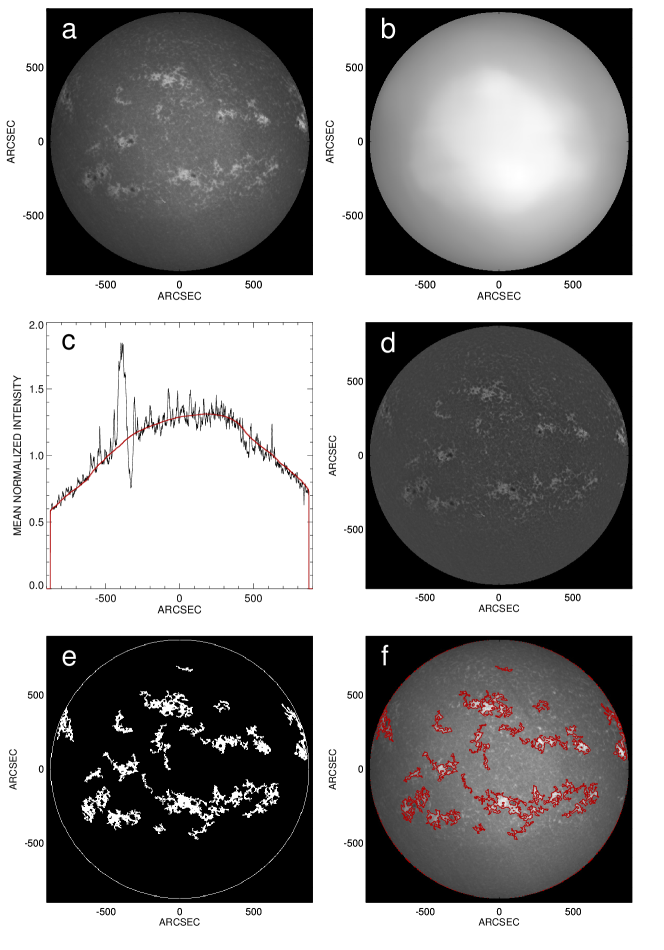
The digitised full disc century-long (1907 to mid 2007) 40964096 Ca ii K solar images ( arcsec/pixel) from KSO (Figures 1a-b) used in the study were recorded through a telescope having 30 cm objective with f-ratio of f/21 (Priyal et al., 2014b) and spatial resolution about 2 arcsec. We employed few calibration steps before the feature detection was performed. They were namely flat fielding, disc detection and centring, north-south rotation correction, intensity inversion and limb darkening correction. Hough circle transform (Sonka et al., 2014) was applied on edge detected raw images to efficiently identify the disc centre and radius in contrast to manual method described in earlier work by Priyal et al. (2014b). The radius varied by some number of pixels systematically over time due to change in sun-earth distance during each revolution. All the disc centred images were rescaled to one fixed size () having uniform disc radius () (Figure 2a).
2.1 Limb darkening correction
Limb darkening is a systematic large scale variation of solar intensity from its centre to limb due to line of sight effect. This should ideally be a radially symmetric function but due to atmospheric and instrumental effects it loses the symmetry. In contrast to the radially symmetric polynomial method of limb darkening estimation for KSO data as presented in Priyal et al. (2014b), current study captured the variation applying a 40 40 2D median filter (Zharkova et al., 2005; Bertello et al., 2010) on the resized 512 512 disc centred images. This essentially performed blurring to represent large scale intensity variation (Figures 2b-c). Subsequently, the filtered image was again resized to original 4096 4096 size and was used to correct for limb darkening in the original image (Figure 2d).
2.2 Plage detection
Histogram equalisation was applied on the limb darkening corrected images () to bring uniformity in intensity contrast throughout the study time and to enhance the target features with respect to background. There was no absolute intensity calibration or full disc flux measurement (Foukal & Lean, 1988) unlike Ermolli et al. (2009). The objective was only to detect plages. Global thresholds were then applied on the histogram equalised images to generate binary images () with segmented regions of interest. Enhanced limb darkening corrected images were characterised by disc region intensity median () and standard deviation (). The disc region was described by pixels () satisfying . The segmentation scheme was as follows-
After segmentation an area threshold of pixels was applied to discard unwanted regions. Subsequently, morph closing (a mathematical morphology operation consisting of dilation followed by erosion) (Sonka et al., 2014) was applied with a (cross) structuring function to get rid of fragmentation in structures of interest (Figures 2e-f).
2.3 Plage index calculation
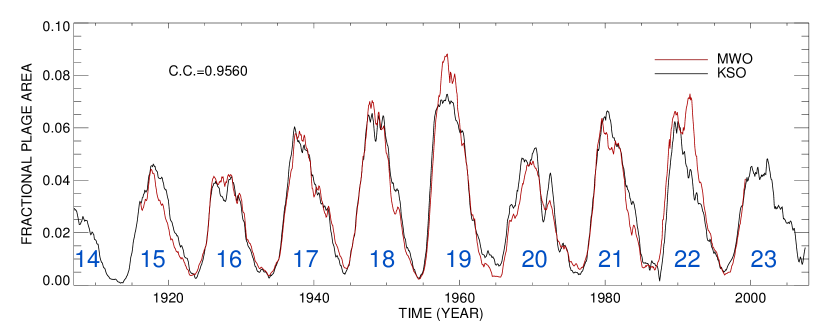
Plage index is an established metric, reflecting the occurrence of plage regions in Ca ii K image. Following the description about plage index calculation as in Bertello et al. (2010), from the mean normalised intensity histrogram of solar disc with a bin-width of 0.01, 35 bins were selected above and below the mode. Within this range a Gaussian was fitted to calculate mean () and variance (). Within and , 30 bins were selected and another Gaussian ( where ) was fitted to it (Figure 3a). The constant term () of the Gaussian is named as plage index indicating the asymmetry in the histogram wings due to occurrence of high intensity regions called plages. For further validation the correlation of plage index with fractional plage area acquired from plage detection is also presented (Figure 3b). Hereafter for solar cycle variation studies we will use the fractional plage area, the fraction of solar disc area covered by plages, as a most favoured proxy. The 12 month running average smoothing was performed on monthly averaged plage area cycle and compared with same for Mount Wilson Observatory (MWO) in Figure 4.

2.4 Plage centroid detection and butterfly diagram
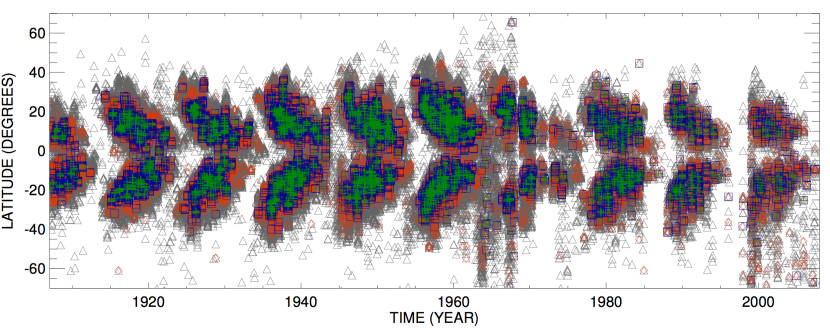
After morph closing operation on binary plage detected images the individual connected structures were identified through giving certain labels to the pixels falling in same region. Subsequently, centroid latitudes for all those regions were calculated for each image and were stacked over time to generate butterfly diagram with four area thresholds for the plage regions , , and (Figure 6).
2.5 Carrington map generation
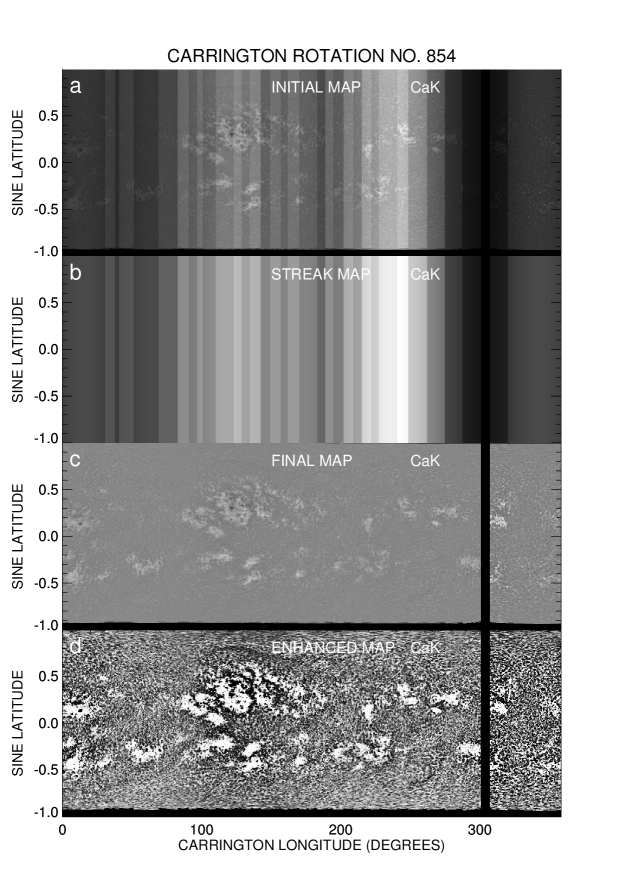
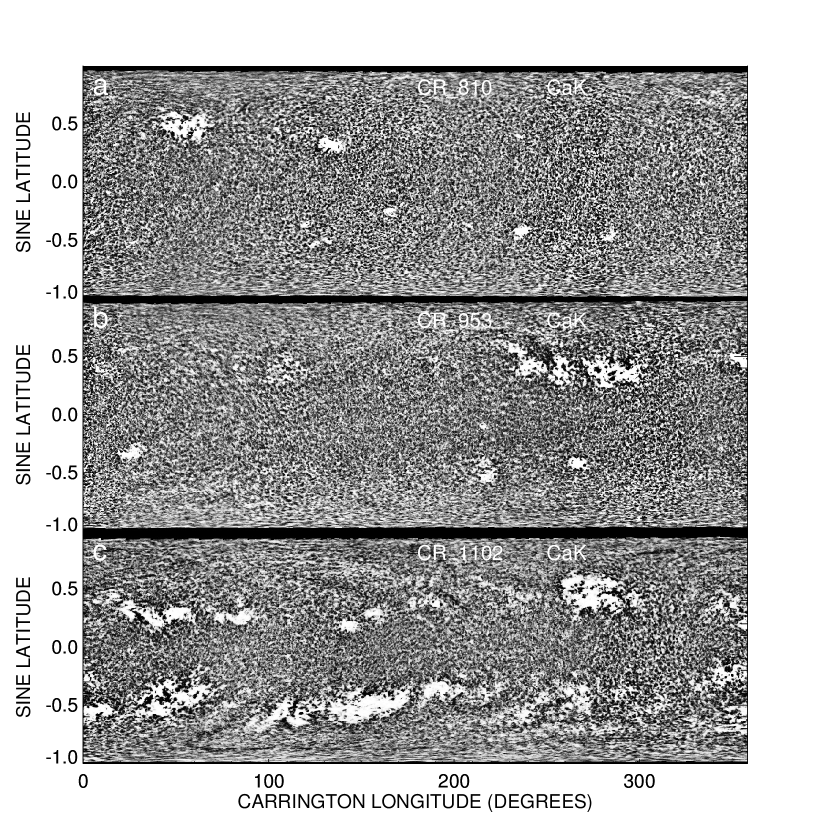
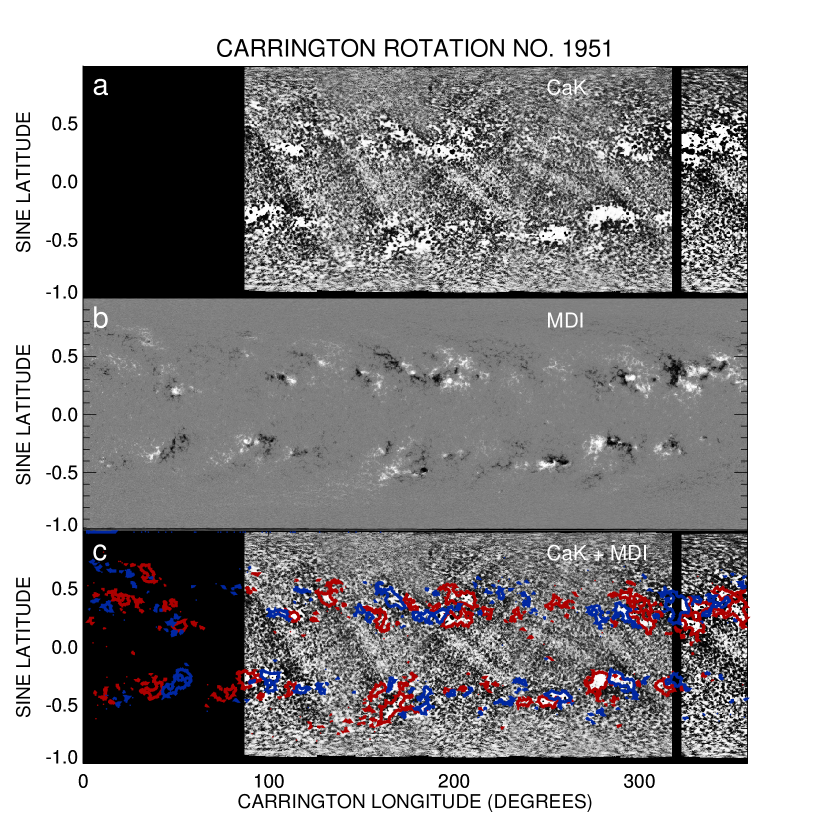
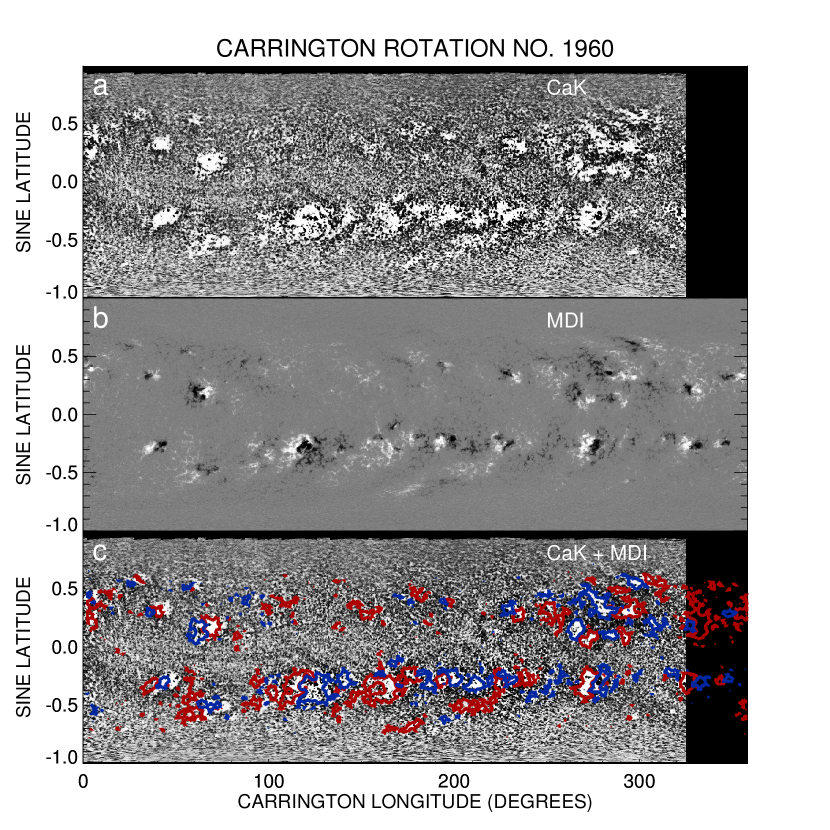
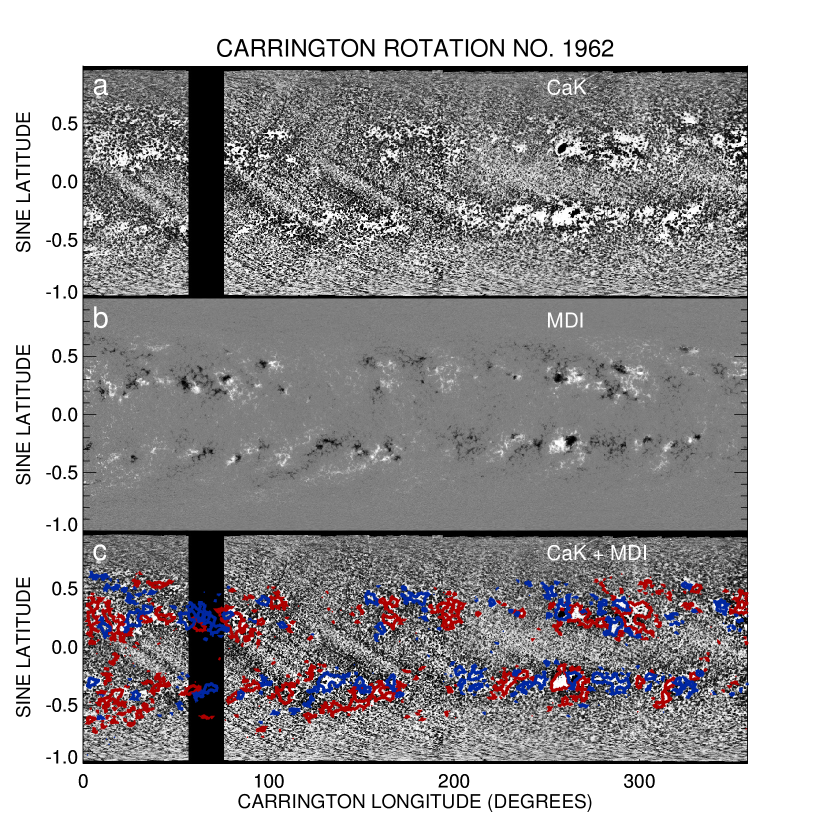
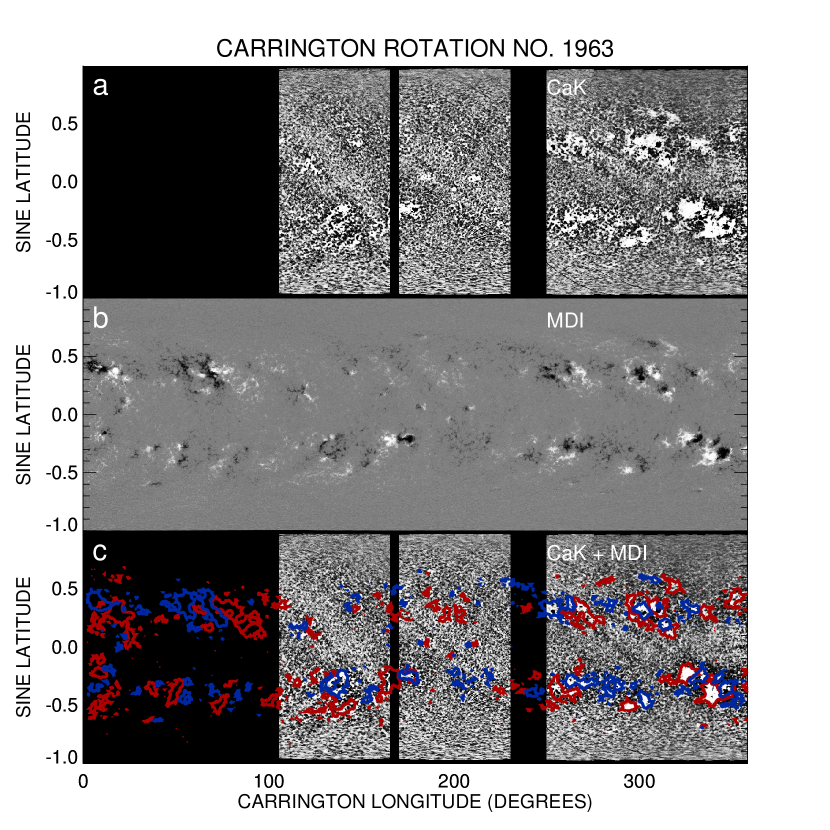
Carrington map is the Mercator projection of the spherical sun mostly generated from daily observation for one solar rotation. In this study, 60 longitude bands across the limb darkening corrected full disc Ca ii K images were selected, angle corrected and stretched in form of a rectangle with a weightage of fourth power of cosine (Sheeley et al., 2011; Harvey & Worden, 1998) over each longitude with respect to the central meridian. These slices were shifted and added according to date and time for 27.2753 days to generate a full 360 degree map of sun. A similar 360 degree map was obtained from rectangular binary slices called streak map (Sheeley et al., 2011). The overlap of same Carrington longitudes was removed through division of the original 360 degree map with streak map to form an image called Carrington map or Synoptic map (Figures 5a-d). Carrington maps were also generated from few MDI LOS full disc magnetograms available after 1996. Binary Carrington maps were generated for Ca ii K and MDI using and thresholds respectively. These maps were further blurred using Gaussian filter to account for the feature boundary uncertainty and were cross-correlated for different relative x-y shifts.
3 Results
For the study of the century-long magnetic activity of the Sun, the Ca ii K plage structures (Figure 2), with projected area , have been used as the primary building block for magnetic proxy. Their segmentation endorsed the area threshold as to minimise loss of fragmented plage structures before morphological closing operation. This enabled us to deal with a good number of plage structures and to achieve desired statistics for the study of solar cycle variation. Histogram equalisation on individual limb darkening corrected solar images resulted in uniformity in image contrast. This also allowed us to detect the features automatically without any human bias of selection by visual inspection.
The area cycle, a temporal evolution of fractional disc area covered by plages, showed a good correlation () with the same from MWO for the overlapping time period (Figure 4). This is an improvement over the earlier report by Priyal et al. (2014b) on KSO Ca ii K data for the period 1955-1985 in which the correlation was shown to be 89. It further revealed the cycle 19 as the strongest one (Figure 4) and evidenced the double peak behaviour in some of the cycles. Some unreal spikes were also observed at the cycle minima after 1975 due to less availability and inferior quality of images being correlated with the occurrence of outlier points in the butterfly diagram for some study period after 1985 (2 years) and 1994 (1 year). Those data points were removed using a criteria involving the maximum latitude of plage appearance at a certain phase of a cycle.
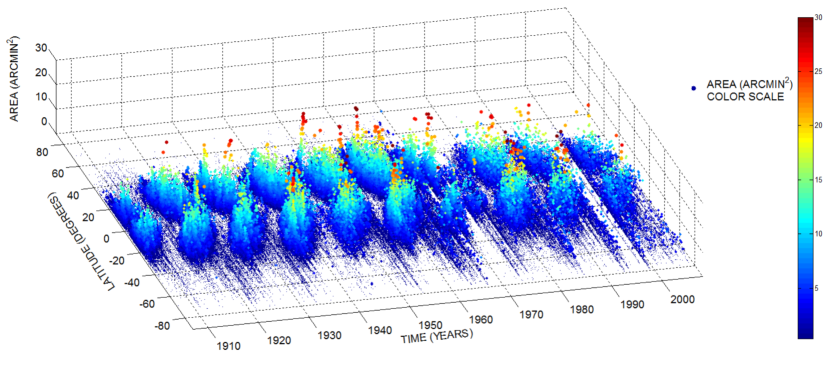
To explore the change in latitudinal distribution of enhanced Ca ii K emission with time we have produced the butterfly diagram. The centroids of plages have been used for the generation of this diagram, in contrast to Sheeley et al. (2011) who used the Carrington maps for the same. Butterfly diagram with three area thresholds (Figure 6) reveals that higher plage areas are more concentrated to the equator with a spatial correlation with active regions (Stix, 2004). In order to have a better visualisation of the latitudinal variation of different sizes with time a 3D version of the butterfly diagram was created, adding individual projected plage area as the third dimension (Figure 7). An animated figure has also been created to demonstrate how the time-latitude distribution changes with variation of plage size. This dynamic illustration has been provided as a supplementary material in the link ftp://ftp.iiap.res.in/subhamoy/cak˙carrington˙maps˙kodaikanal/butterfly˙cak˙3d.gif and is available online. Figures 6 & 7 can be readily compared with well known butterfly diagrams as generated from sunspot areas showing higher latitude to equatorward occurrence of plage structures for each cycle. It should be noted that because of area thresholding the smallest features like network bright points are not detected in the current analysis and the poleward migration is not observed (Priyal et al., 2014a).
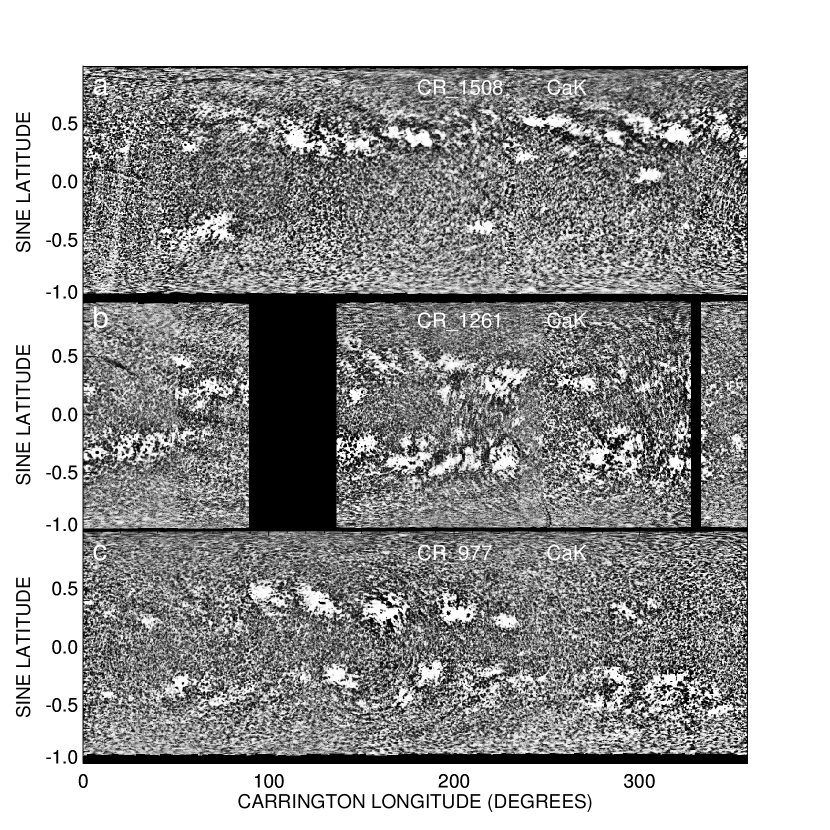
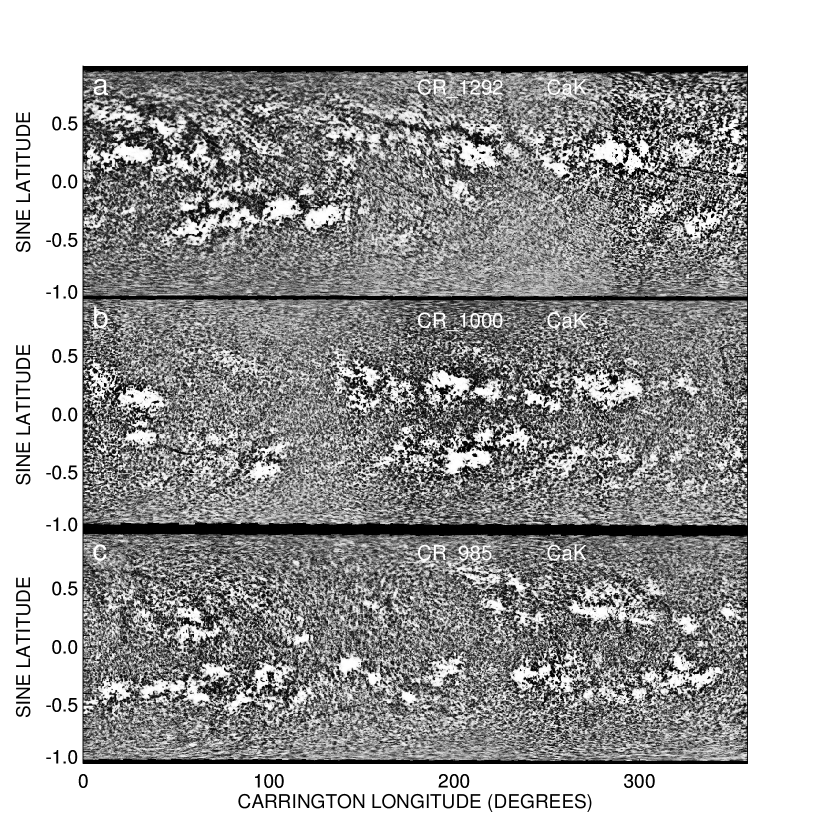
It has been pointed out earlier that the enhanced emission in Ca ii K relates well with the magnetic field concentrations. Thus the Carrington maps do indicate the magnetic flux distribution over a solar rotation. In this article we presented Synoptic or Carrington maps (Figures 8a-c) incorporating plage evolutions for different solar rotations over the past 100 years. These maps will be particularly useful for the period when line of sight magnetograms are not available. Similar maps were generated by Sheeley et al. (2011) from MWO Ca ii K data. First we will compare few representative cases of newly generated Carrington map from KSO data and that of MWO. Figures 8 a,b,c can be compared with upper panel of Figure 4, lower panel of Figure 7 and lower panel of Figure 10 of Sheeley et al. (2011) respectively. The close resemblance of these maps provides a good validation of calibration, map generation and portray the quality of Kodaikanal data. The longitude band selected for each full disc image to generate the map was result of a trade off between feature sharpness and data gap (Figure 8b). However, apart from geometrical similarity a difference in contrast and visibility of network structures can be observed between the maps from KSO and MWO. This might have occurred because of the difference in digitisation and preprocessing of full disc images. In Figures 9 a, b, c and Figures 10 a, b, c we show few more examples of CR maps corresponding to different phases of a solar cycle as generated from Kodaikanal spectroheliograms without any data gaps. Enhanced Ca ii K Carrington maps at later times (after 1990) show bright tilted periodic artefacts because of higher occurrence of scratches in the spectroheliograms.
Next we compare our Ca ii K Carrington maps with Carrington maps of photospheric magnetic fields generated from full disc LOS magnetograms of MDI on SoHO. Cross-correlation of all sample Carrington maps from Ca ii K (KSO) and MDI showed maximum overlap at a relative x-shift and y-shift of about 5 pixels and 9 pixels respectively where size of the maps was . This study reveals good spatial correlation () between magnetic patches and plage structures (Figures 11,12,13,14). Carrington maps from 1907 till mid 2007 have been provided as supplementary material (also available at ftp://ftp.iiap.res.in/subhamoy/cak˙carrington˙maps˙kodaikanal/). We also provide a time lapsed movie which includes all these maps for the period of 100 years in the link ftp://ftp.iiap.res.in/subhamoy/cak˙carrington˙maps˙kodaikanal/cak˙video˙1907˙2007.gif (available online).
4 Conclusion
We have used Ca ii K line images, recorded in the KSO, digitised and calibrated by our group, to construct Carrington maps and butterfly diagrams corresponding to the period of 1907-2007. The KSO data allows us to study the cyclic activity of the solar magnetic fields for longer duration (100 years) in contrast to that from MWO which is for about 85 years (Bertello et al., 2010). Sheeley et al. (2011) studied Carrington maps from 1915 till 1985 from the MWO archive, whereas the current study generated Carrington maps from 1907 to mid 2007 using images which were recorded at the KSO. These maps provide ways of tracking magnetic field distributions all the way back to 1907, a period from which direct magnetic field synoptic observations are not available. In the context of long term evolution of features on Sun at specific wavelength present study segmented plage structures, generated area cycle and butterfly diagram from 100 years Ca ii K KSO data. Derived century-long Ca ii K synoptic maps further elaborated correlation with the same generated from space based magnetograms for an overlapping study period and confirmed their physical connection (Stix, 2004; Sheeley et al., 2011).
Figure 7 illustrated cyclic behaviour of the projected area for individual plages at different latitude bands. It also gives hint about the relative delay in attaining cycle peak for individual plage area between different latitudes. So, this area scaled butterfly diagram gives some additional information for a greater time span (1907-2007) in contrast to the super synoptic map presented in Sheeley et al. (2011) with study period between 1915-1985. Location overlap between plage structures and magnetic patches in turn validated the theoretical expectation of higher field strength correlated with less Ca ii K absorption (Pevtsov et al., 2016). Therefore the century-long Ca ii K data can act as a proxy for understanding the locational evolution of magnetic patches.
This study essentially demonstrated the importance of century-long Ca ii K spectroheliograms to delineate evolutionary features from different perspectives and their possible correspondence. Observations about latitude dependent plage area variation can add some more insight to the conventional area cycle, being an aggregate. Along with the study of long term evolution some smaller time scale phenomena can also be analysed from this huge data. Rotation rate variation for different latitudes can be analysed from plage areas over 100 years (Kiepenheuer, 2012; Singh & Prabhu, 1985). Machine learning techniques can be applied on and validated through this huge data giving confidence about the prediction for future cycle characteristics (Colak & Qahwaji, 2009). We propose to address some of these aspects in our future studies.
We hope that the result presented here and Carrington maps published online (ftp://ftp.iiap.res.in/subhamoy/cak˙carrington˙maps˙kodaikanal/) will also help the global community to study different features at a greater depth and the new database available at https://kso.iiap.res.in/data will act as a valuable resource. Recently Pevtsov et al. (2016) have attempted to create a homogeneous, long term series of pseudo-magnetograms using a combination of Ca ii K line images and sunspot polarity measurements. We hope to pursue the same in near future from our KSO data. We further propose to combine the MWO and KSO data sets to produce a single improved set. This will also enable to fill up the data gaps in the two independent datasets. This cross-calibration and comparison will yield a data series with uniform quality. We would like to mention that further refinements, improvements in the calibration process and cross-calibration between different data series will be released time to time through our web portal at https://kso.iiap.res.in/data with marked versions and data products.
References
- Bertello et al. (2010) Bertello, L., Ulrich, R. K., & Boyden, J. E. 2010, Sol. Phys., 264, 31
- Colak & Qahwaji (2009) Colak, T., & Qahwaji, R. 2009, Space Weather, 7, n/a, s06001
- Ermolli et al. (2009) Ermolli, I., Solanki, S. K., Tlatov, A. G., Krivova, N. A., Ulrich, R. K., & Singh, J. 2009, The Astrophysical Journal, 698, 1000
- Foukal et al. (2009) Foukal, P., Bertello, L., Livingston, W. C., Pevtsov, A. A., Singh, J., Tlatov, A. G., & Ulrich, R. K. 2009, Solar Physics, 255, 229
- Foukal & Lean (1988) Foukal, P., & Lean, J. 1988, ApJ, 328, 347
- Harvey & Worden (1998) Harvey, J., & Worden, J. 1998, in Astronomical Society of the Pacific Conference Series, Vol. 140, Synoptic Solar Physics, ed. K. S. Balasubramaniam, J. Harvey, & D. Rabin, 155
- Jin & Wang (2015) Jin, C., & Wang, J. 2015, The Astrophysical Journal, 806, 174
- Kiepenheuer (2012) Kiepenheuer, K. 2012, Structure and Development of Solar Active Regions, International Astronomical Union Symposia (Springer Netherlands)
- Pevtsov et al. (2016) Pevtsov, A. A., Virtanen, I., Mursula, K., Tlatov, A., & Bertello, L. 2016, A&A, 585, A40
- Priyal et al. (2014a) Priyal, M., Banerjee, D., Karak, B. B., Muñoz-Jaramillo, A., Ravindra, B., Choudhuri, A. R., & Singh, J. 2014a, ApJ, 793, L4
- Priyal et al. (2014b) Priyal, M., Singh, J., Ravindra, B., Priya, T. G., & Amareswari, K. 2014b, Sol. Phys., 289, 137
- Schrijver et al. (1989) Schrijver, C. J., Cote, J., Zwaan, C., & Saar, S. H. 1989, ApJ, 337, 964
- Sheeley et al. (2011) Sheeley, Jr., N. R., Cooper, T. J., & Anderson, J. R. L. 2011, ApJ, 730, 51
- Singh & Prabhu (1985) Singh, J., & Prabhu, T. 1985, Solar Physics, 97, 203
- Skumanich et al. (1975) Skumanich, A., Smythe, C., & Frazier, E. N. 1975, ApJ, 200, 747
- Sonka et al. (2014) Sonka, M., Hlavac, V., & Boyle, R. 2014, Image Processing, Analysis, and Machine Vision (Cengage Learning)
- Stix (2004) Stix, M. 2004, The Sun: An Introduction, Astronomy and Astrophysics Library (Springer Berlin Heidelberg)
- Zharkova et al. (2005) Zharkova, V., Ipson, S., Benkhalil, A., & Zharkov, S. 2005, Artificial Intelligence Review, 23, 209