Angular momentum loss in the envelope-disk transition region of HH 111 protostellar system: evidence for magnetic braking?
Abstract
HH 111 is a Class I protostellar system at a distance of 400 pc, with the central source VLA 1 associated with a rotating disk deeply embedded in a flattened envelope. Here we present the observations of this system at (240 AU) resolution in C18O (J=2-1) and 230 GHz continuum obtained with Atacama Large Millimeter/Submillimeter Array, and in SO () obtained with Submillimeter Array. The observations show for the first time how a Keplerian rotating disk can be formed inside a flattened envelope. The flattened envelope is detected in C18O, extending out to 2400 AU from the VLA 1 source. It has a differential rotation, with the outer part ( 2000 AU) better described by a rotation that has constant specific angular momentum and the innermost part ( 160 AU) by a Keplerian rotation. The rotationally supported disk is therefore relatively compact in this system, which is consistent with the dust continuum observations. Most interestingly, if the flow is in steady state, there is a substantial drop in specific angular momentum in the envelope-disk transition region from 2000 AU to 160 AU, by a factor of . Such a decrease is not expected outside a disk formed from simple hydrodynamic core collapse, but can happen naturally if the core is significantly magnetized, because magnetic fields can be trapped in the transition region outside the disk by the ram pressure of the protostellar accretion flow, which can lead to efficient magnetic braking. In addition, SO shock emission is detected around the outer radius of the disk and could trace an accretion shock around the disk.
1 Introduction
Keplerian rotating disks (KRDs), which are rotationally supported, have been detected around young stellar objects, especially in Class II and Class I phases. Recently, more and more such disks have been found as early as in Class 0 phase (Lee et al., 2009, 2014; Murillo et al., 2013; Ohashi et al., 2014). However, the formation mechanism of such disks is still not well understood because of a lack of observations at high angular and velocity resolutions.
A few years ago with the Submillimeter Array (SMA) observations, the rotation profile in the Class I source HH 111 was found to transition from that conserves angular momentum in the envelope to that of Keplerian in the KRD (Lee, 2010). This transition was found for the first time in star formation, providing a clue to the formation mechanism of KRDs. With Atacama Large Millimeter/Submillimeter Array (ALMA), recent searches also found such a transition even in Class 0 sources, e.g., L 1527 IRS (Sakai et al., 2014; Ohashi et al., 2014) and HH 212 (Lee et al., 2014). In order to study how a KRD can be formed, we need to resolve the transition region, and compare its structure and kinematics to current model predictions.
Theoretically, in models of non-magnetized core collapse, a KRD can indeed form as early as in the Class 0 phase (Terebey et al., 1984). However, a realistic model should include magnetic field, because recent survey toward a few Class 0 sources shows that molecular cores are magnetized and likely to have an hourglass B-field morphology (Chapman et al., 2013). Unfortunately, in many current models of magnetized core collapse, the magnetic field produces an efficient magnetic braking that removes the angular momentum and thus prevents a KRD from forming at the center (Allen, Li, & Shu, 2003; Mellon & Li, 2008; Galli et al., 2009). In those cases, only a flattened envelope called the pseudodisk can be formed around the central source (e.g., Allen, Li, & Shu, 2003). Magnetic-field-rotation misalignment is sometimes able to solve this so-called magnetic braking catastrophe (Joos et al., 2012; Li et al., 2013), but not always.
This paper is a follow-up study of the transition region in the HH 111 protostellar system. The properties of this system have been reported in Lee (2011) and only the important ones are summarized here. This system is deeply embedded in a compact molecular cloud core in the L1617 cloud of Orion at a distance of 400 pc. At the center of this system, there are two sources, VLA 1 and VLA 2, with a projected separation of (1200 AU) and the former driving the prominent HH 111 jet (Reipurth et al., 1999). The VLA 1 source is a Class I protostellar system with a flattened envelope, a rotating disk, and a highly collimated jet. Previous SMA observation of this system in C18O has shown that the flattened envelope is in transition to a KRD near the VLA 1 source (Lee, 2010). No clear influence of the VLA 2 source was seen on the envelope and disk of the VLA 1 source. Here is a follow-up study of this system with about 2 times higher angular and about 3 times higher velocity resolutions in C18O () obtained with ALMA at about 8 times higher sensitivity. In addition, to augment our study, we also include SO () shock emission at a similar angular resolution obtained with the SMA. This study shows for the first time the resolved region of the transition, where a disk can be formed inside an envelope.
2 Observations
2.1 ALMA Observations
Observations toward the HH 111 system were obtained with ALMA using both the 12m array (in C32-4 configuration with a total time of 140 minutes) and the 7m array (with a total time of 445 minutes). This project was a Cycle 1 project transferred to Cycle 2. For the 12m array, 3 executions were carried out during 2014 April 13-28, all with 47.11 minutes on the source. 33-35 antennas were used with the projected baseline length of 20558.2 m. For the 7m array, 20 executions were carried out, with 5 during 2013 December 14-15, 4 during 2014 January 11-15, 5 during 2014 April 09-May 03, and 6 during 2014 December 11-14, all with 22.37 min on the target source, except for one with 19.47 min. 8-10 antennas were used with the projected baseline length of 748.9 m. A 3-point mosaic was used to cover to the north and south from the center, observing the envelope and disk in the equatorial plane of the system.
The 230 GHz band receivers were used to observe the 12CO (), 13CO (), and C18O () lines simultaneously with the 230 GHz continuum. Note that the 12CO and 13CO lines trace mainly the outflow interaction and will be presented in a future publication. The velocity resolution in C18O is 0.083 km s-1.
The data were calibrated with the CASA package, with Quasars J0750+1231 and J0607-0834 as passband calibrators, Quasars J0532+0732 (a flux of 1.40 Jy) and J0607-0834 (a flux of 0.63 Jy) as gain calibrators, and Callisto and Ganymede as flux calibrators. With super-uniform weighting and taper, the synthesized beam becomes circular with a size of in continuum. With super-uniform weighting, the synthesized beam has a size of at a position angle (P.A.) of 77∘ in C18O. The rms noise level is 0.22 mJy beam-1 ( 20 mK) for the continuum, and 4.3 mJy beam-1 ( 0.23 K) for the C18O channel maps at 0.083 km s-1 velocity resolution. The velocities in the channel maps are LSR.
2.2 SMA Observations
For SO observations with SMA, the details have been reported in Lee (2011) and are thus not repeated here. The longest projected baseline length is 480 m, similar to that of ALMA observations. The velocity resolution in SO line is 0.28 km s-1 per channel. Only one single pointing toward the central region was observed to map the inner part of the envelope and disk. The visibility data were calibrated with the MIR package. The flux uncertainty was estimated to be 15%. The calibrated visibility data was then imaged with the MIRIAD package, as described in Lee (2011). With super-uniform weighting, the synthesized beam has a size with a P.A. of 75∘. The rms noise levels are 35 mJy beam-1 ( 2.3 K) in the channel maps. The velocities in the channel maps are LSR.
3 Results
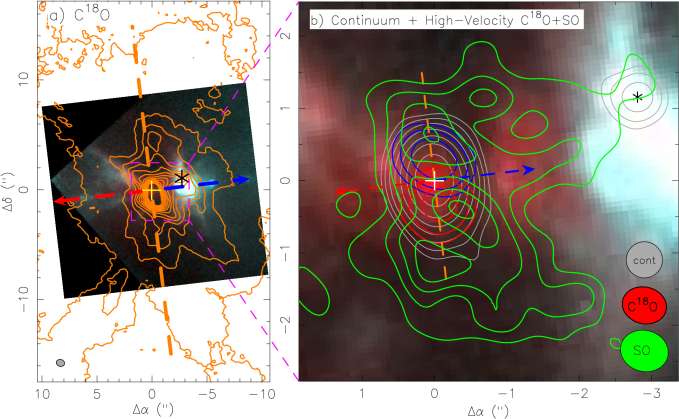
As in Lee (2010), the results are presented in comparison to a mosaic image based on the Hubble Space Telescope (HST) NICMOS image ([FeII] 1.64 m + H2 at 2.12 m + continuum) obtained by Reipurth et al. (1999), which shows two VLA sources in the infrared, reflection nebulae that trace the illuminated outflow cavity walls, and the jet in the system. The two sources have been detected at very high angular resolution of in 7 mm continuum by the VLA as the VLA 1 and 2 sources, respectively, at , and , (Rodríguez et al., 2008). These VLA positions are adopted here as the source positions. Based on the fitting of the rotation curve in the envelope (Section 3.2), the systemic velocity in this region is refined to be km s-1 LSR, from km s-1 found in Lee (2010) at 3 times lower velocity resolution. Throughout this paper, we define an offset velocity to facilitate our presentation.
3.1 230 GHz Continuum Emission
Figure 1 shows the 230 GHz continuum map toward the two VLA sources at an angular resolution of . As discussed in Lee (2011), the continuum emission is thermal dust emission, tracing mainly the dusty disks around the two sources. The continuum emission toward VLA 1 is resolved into a disklike structure with a Gaussian deconvolved size of (212 AU 76 AU) and a P.A. of 7∘, with a flux density of 27040 mJy, all similar to those found in Lee (2011). The orientation of this disk is nearly exactly orthogonal to the jet axis, which has a P.A. of 96.7∘. Interestingly, with unprecedented high ALMA sensitivity, we can see clearly that the continuum emission intensity drops quickly below 50% of the peak beyond the Gaussian deconvolved radius ( , a half of the Gaussian deconvolved size along the major axis). This suggests that the disk has a sharp outer boundary. The continuum emission toward VLA 2 is unresolved with a flux density of 91.4 mJy. As compared to Lee (2011), VLA 2 is better detected because of higher sensitivity.
3.2 C18O Envelope and Disk
Figure 2 shows the C18O spectrum toward the VLA 1 source averaged over an elliptical region of elongated along the equatorial plane (P.A. 6.7∘). The spectrum shows a double-peaked line profile with a blue asymmetry and an absorption dip deepest at 0.2 km s-1, similar to that seen before extracted from resolution SMA observation in Lee (2010). The blue asymmetry and absorption dip were used before to imply an infall motion in the envelope (Lee, 2010). The brightness temperature near the systemic velocity is 25% lower that found before, likely because part of the extended structure is resolved out in our observations at higher angular resolution. With ALMA sensitivity, the emission is now detected more than 5 km s-1 from the systemic, about 2 km s-1 higher than that observed before with the SMA. As seen later, the emission at this high velocity arises near the source, allowing us to better constrain the Keplerian velocity near the source.
Figure 3a shows the C18O total intensity map on top of the HST image. The emission extends mainly along the equatorial plane of the VLA 1 source, with some also extending to the NE, SE, SW, and NW around the outflow cavity walls, and some also extending to the west to the VLA 2 source. In the equatorial plane, C18O emission shows an extended envelope detected up to (4800 AU) from the VLA 1 source. The more extended emission detected in our previous SMA observations (extending to , Lee, 2010) is resolved out from our ALMA observations, due to a lack of shorter coverage. The emission intensity increases toward the VLA 1 source, showing a flattened envelope (with a thickness of ) formed within of the source in the extended envelope. Interestingly, within this radius, the rotation velocity was found to transition to Keplerian velocity (Lee, 2010). The intensity increases rapidly within of the VLA 1 source, suggesting for a final change in the structure from the (tenuous) flattened envelope to the (dense) disk. The envelope-disk is believed to be perpendicular to the jet that was found to have an inclination of 10∘ to the plane of the sky (Reipurth, Raga, & Heathcote, 1992), and is thus almost edge-on, with its farside to the west and nearside to the east.
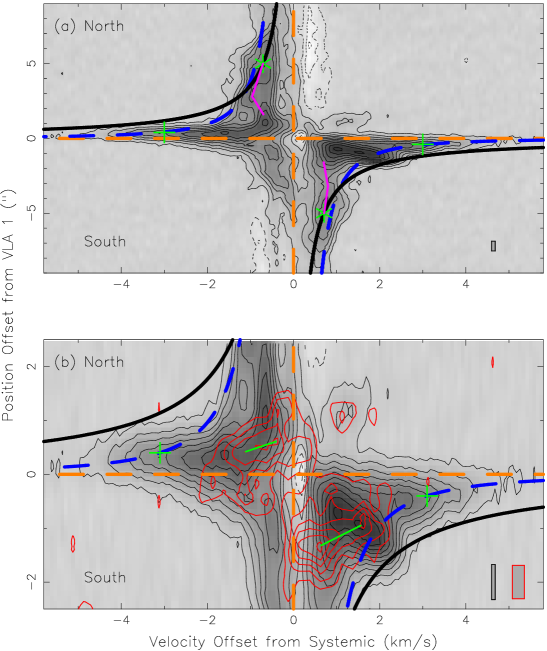
Figure 4 shows the position-velocity (PV) diagram of the C18O emission cut along the major axis of the envelope-disk in order to study the rotation velocity in the envelope-disk. In our previous study with SMA, the rotation velocity was found to increase toward the center, first with a profile corresponding to angular momentum conservation in the outer part and then with a Keplerian velocity profile in the inner part, with a change at the radius of (Lee, 2010). In particular, the outer part ( ) could be fitted by with km s-1, while the inner part ( ) by with km s-1, where .
Now we can refine the fitting parameters with ALMA at higher angular and velocity resolutions. The rotation velocity in the outer part is found to follow the conservation of angular momentum down to as found before (marked as asterisks), but with slightly smaller km s-1 (solid curves). In this fit, the systemic velocity is refined to 8.85 km s-1 from 8.9 km s-1, in order to have a good fit on both redshifted and blueshifted sides. Note that the value of could be smaller because the fit could be affected by the self-absorption and missing flux near the systemic velocity. However, the rotation velocity within of the central source does not change to Keplerian immediately. Instead, as we go toward the central source, the rotation velocity first increases with a rate slower than that in the outer part and then decreases slightly (as indicated by the magenta lines in Figure 4a), and then increases rapidly toward the center, becoming Keplerian within of the central source. The crosses at (, 3.1 km s-1) and (, 3.1 km s-1) mark roughly the locations, within which the rotation velocity can be reasonably described by the Keplerian velocity (dashed curves), with km s-1, slightly larger than that found before. Therefore, unlike previous study, only the very innermost part becomes a KRD. The region in between and can be considered as a transition region between the envelope and the disk. The Keplerian velocity here implies a mass of for the central VLA 1 source. Note that there is a compact absorption dip centered at the VLA 1 source near the systemic velocity, which gives the absorption dip in the spectrum shown in Figure 2. As discussed in Lee et al. (2014) for HH 212, this compact absorption dip is likely due to an absorption of the continuum emission of the disk by the near side of the envelope, which is found to be infalling toward the center (Lee, 2010).
Figure 3b shows the high-velocity emission of C18O, greater than 3 km s-1 from the systemic value, where the rotation velocity becomes Keplerian, as discussed earlier. The peaks of the blueshifted and redshifted emission are on the opposites of the VLA 1 source in the equatorial plane at a distance of , coincident with the radius of the dusty disk, further confirming that the disk is a KRD.
3.3 SO Shocks
In order to further investigate the transition region, we also plot in Figure 3b the SMA map of SO emission, which was argued to trace accretion shocks around the disk (Lee, 2010). The SO emission was detected within of the VLA 1 source. In the equatorial plane, two SO emission peaks are seen on the opposite sides of the VLA 1 source, one at and one at , near the edge of the high-velocity C18O emission and dusty disk emission. In the south, SO emission is also seen closer in at (160 AU) extending to the SW from the disk, and may trace material (i.e., slow wind) coming out from the disk. In addition, SO emission is also seen extending to the west, probably tracing material connecting to the VLA 2 source. SO emission is also seen extending to the NW, probably tracing the envelope or outflow around the cavity wall.
The PV diagram of the SO emission cut along the major axis is shown with the red contours in Figure 4b. The SO emission is detected mainly within 2 km s-1 of the systemic velocity. The redshifted emission is mainly in the south, and blueshifted emission is mainly in the north, similar to those of the C18O disk, suggesting that the shocked material traced by the SO emission is also rotating. On both blueshifted and redshifted sides, the velocity of the emission increases toward the center (as indicated by the green lines), connecting to the C18O emission at higher velocity, where the rotation velocity becomes Keplerian. This clearly suggests that SO shocks occur before the rotation velocity becomes Keplerian and the disk is formed. The SO emission closer in at traces the base of the emission extending out from the disk to the SW (see Figure 3b). It is seen on both blueshifted and redshifted sides in the PV diagram, tracing a shock at the base in the disk.
3.4 Infall Motion
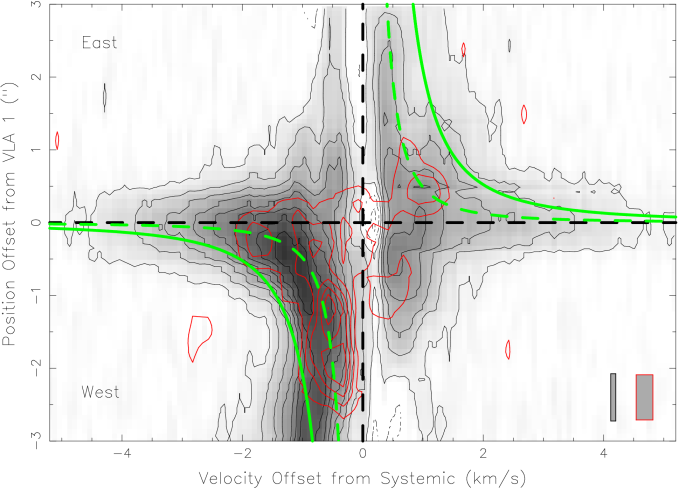
Figure 5 shows the PV diagrams of C18O and SO along the minor axis of the envelope-disk, in order to refine the infall motion in the envelope found in Lee (2010). As mentioned earlier, the envelope-disk is almost edge-on, with its farside to the west and nearside to the east. The flattened envelope has a thickness of and a radius of . Thus, the C18O emission beyond from the center should be mainly from the outflow and is thus not shown here. In addition, the C18O emission at extends to the west to the VLA 2 source and is thus affected by the source. The SO emission at extends to the west to the VLA 2 source (see Figure 3b) and is thus also affected by the source. As a result, both of these emissions should be excluded when studying the infall motion in the envelope. In C18O, the blueshifted emission of the envelope is more on the west (farside) and the redshifted emission is more on the east (nearside), consistent with a small infall motion toward the VLA 1 source. That the blueshifted emission is brighter than the redshifted emission also supports the infall motion in the envelope. Since SO shows a similar velocity structure to C18O, it can trace the infall motion as well. Assuming that the infall velocity in the envelope increases toward the center with as in Lee (2010), then the infall velocity seen in C18O and SO can be roughly fitted with km s-1 (dashed curves)111Note that it was thought to be km s-1 in Lee (2010), due to wrong correction for the projection effect.. This infall velocity is 50% of the free-fall velocity due to the VLA 1 source (solid curves), which has a mass of 1.80.5 (as derived earlier from the Keplerian velocity of the disk).
4 Discussion
4.1 Flattened Envelope: Transition Region
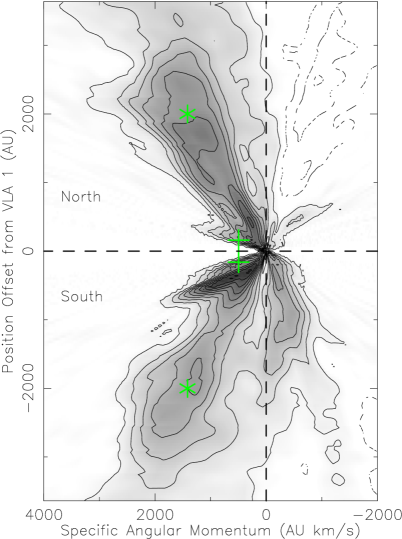
With ALMA observations in C18O at higher angular and velocity resolutions, we can better constrain how a KRD can be formed around a forming star. The C18O map shows a flattened envelope embedded in a more extended envelope. It has a radius of (i.e., 2400 AU), slightly larger than the transition radius ( or 2000 AU) where the rotation profile starts to become flatter than that of conservation of angular momentum. However, the rotation velocity does not change immediately to that of Keplerian at the transition radius. Instead, the rotation velocity first increases with a rate slower than that expected from conservation of angular momentum, then decreases, and then increases rapidly near where the disk is formed. Therefore, the flattened envelope is mainly the transition region. The specific angular momentum, which is proportional to the product of rotation velocity and radius, decreases tremendously in the transition region, by a factor of , from a distance of roughly 2000 AU () to 160 AU () (see Figure 6 on the side of positive angular momentum). If the flow in the transition region is in steady state, the drop implies a tremendous loss of specific angular momentum, by a factor of 3. As a result, only a small KRD can be formed near the central VLA 1 source.
In the flattened envelope, the infall velocity is not well determined, because the flattened envelope is almost edge-on and thus not well resolved along the minor axis. Nonetheless, the infall velocity derived here should be reasonable for the flattened envelope up to the transition radius, which has a projected distance of , resolvable with our observations. It is 50% of the free-fall velocity due to the VLA 1 source. Around the transition radius ( ), it is 0.75 km s-1, roughly the same as the rotation velocity there, which is 0.72 km s-1. The complex rotation profile and substantial infall speed of the flattened envelope indicate that it is the transition region between the KRD (which is rotationally supported) and the more extended envelope, rather than the KRD itself.
The centrifugal radius of the envelope is where the centrifugal force is balanced by the gravitational force and is thus where the rotation velocity is equal to the Keplerian velocity. In our model, this radius is ( 1300 AU), smaller than the transition radius ( ), but much larger than the disk radius. Hence, the gas of the envelope would never reach the disk radius unless its angular momentum is reduced by some mechanisms. We therefore believe that the relatively large, AU-scale, centrifugal radius of the envelope is not directly associated with the formation of the much smaller rotationally supported disk. If it were the centrifugal radius directly responsible for the KRD, the rotation speed inside the radius would increase toward the center and the infall speed would quickly drop to zero if the total (infall + rotation) kinetic energy is conserved; these are inconsistent with our observations. The significant infall speed and apparent decrease in angular momentum that we inferred in the transition region indicate the existence of a second centrifugal radius closer to the central object that is more directly responsible for the small KRD. To study it in more detail, higher resolution observations are needed.
4.2 Keplerian Disk
The radius of the disk can be roughly determined from our observations. In the innermost part of the flattened envelope, the rotation velocity becomes Keplerian at a distance of (e.g., 160 AU), forming a KRD around the central source. Since the PV structure is not well resolved there, this distance can only be considered as a rough radius of the disk. The disk likely has a sharp outer boundary, with the continuum emission decreasing rapidly beyond the disk radius (see Section 3.1). On the other hand, in our previous observations at higher angular resolution of (Lee, 2011), the continuum emission of the disk can be reproduced well using a flat disk model with a radius of (e.g., 240 AU). Therefore, the radius of the disk could reach up to 240 AU and higher angular resolution is really needed to refine it. In Lee (2011), the gas and dust associated with the disk were estimated to have a total mass of . Since this mass is only 8% of the mass of the central VLA 1 source, the disk should be gravitationally stable.
4.3 A Ring of SO Shocks
Interestingly, SO emission is detected in the innermost part of the transition region around where the disk is formed, and where the rotation velocity starts to increase again. The SO emission appears as two peaks outside the disk, one in the north at (240 AU) and one in the south at (480 AU), in the equatorial plane. The SO material not only rotates (although with a lower velocity) in the same sense as the disk, but also infalls toward the disk. These two peaks are likely to be two limb-brightened edges of a ring around the disk. Since the two peaks are at different distance from the VLA 1 source, the ring could be elliptical. As discussed in Lee (2010), SO abundance there is highly enhanced as compared to that in the ambient medium. Therefore, the SO emission likely traces a ring of accretion shocks around the disk.
4.4 Comparing to other sources
Recent ALMA observations have also shown a transition of an infalling envelope to a KRD even in Class 0 sources, e.g., L1527 IRS (Sakai et al., 2014) and HH 212 (Lee et al., 2014). In L1527 IRS, a SO shock is also seen around the disk at 100 AU. Later study found that the rotation velocity becomes Keplerian only further in at 40 AU (Ohashi et al., 2014). This supports the conclusion that the rotation velocity becomes Keplerian only at the radius interior to the shocks, as found here in HH 111. In HH 212, a possible SO shock has been seen as well (Podio et al., 2015). However, higher velocity and angular resolutions are needed to check if there is also a transition region with a decrease of rotation velocity and thus specific angular momentum in these sources.
4.5 Comparing to theoretical models
In theoretical models of core collapse without magnetic field, e.g., Terebey et al. (1984) and Nakamura (2000), no such decrease of rotation velocity would be seen before a KRD is formed. However, it is well known that both molecular clouds and their star-forming dense cores are magnetized (e.g., Planck Collaboration XIX, 2014; Chapman et al., 2013; Hull et al., 2014), and realistic models should include magnetic fields, which can significantly modify the dynamics of the core collapse and star formation, especially in the transition region between the infalling envelope and the KRD that is probed by our C18O observations.
In the presence of a magnetic field of the strength typically measured in dense cores (Troland & Crutcher, 2008), the envelope-disk transition region is expected theoretically to be dynamically distinct from the rotationally supported disk on the one hand, and the infalling envelope on the other. The expectation is based on the well-known magnetic flux problem in star formation; namely, if all of the magnetic flux that threads a typical star-forming core is carried into the formed star, the stellar field strength would be orders of magnitude higher than the typically observed value (e.g., Shu et al., 1987). Only a tiny fraction of the core magnetic flux can be dragged into the star; the vast majority of it must be decoupled from the stellar material and be left behind. Li & McKee (1996) showed that, in the idealized axisymmetric (2D) case, the decoupled magnetic flux is trapped by the ram pressure of the infalling envelope behind an ambipolar diffusion (AD) shock. The trapped flux makes the field strength in the post-AD-shock region much higher than in the pre-shock region. The strongly magnetized post-AD-shock region grows with time, reaching thousands of AUs in size at late times, which is larger than the 100-AU scale KRD. Therefore, a generic expectation is that the KRD, where most of the remaining (after magnetic braking) angular momentum originally associated with the mass of the (single) star is stored, should be surrounded by a strongly magnetized (envelope-disk) transition region, where most of the magnetic flux originally associated with the same stellar mass is parked.
The theoretically expected, strongly magnetized, envelope-disk transition region provides a plausible explanation for the two most puzzling features observed in the HH 111 system: (1) the large decrease of the specific angular momentum, by a factor of , from a distance of roughly 2000 AU to 160 AU (see Figure 6), and (2) the slow infall outside the KRD at a speed below the free-fall value (see Figure 5). Both features can be naturally produced by a strong magnetic field, which can remove angular momentum efficiently through magnetic braking from field line twisting in the azimuthal direction, and can slow down the gravitational collapse through magnetic tension force from field pinching in the radial direction. Both of these effects have been illustrated through numerical simulations, most clearly under the assumption of axisymmetry (2D). For example, Li et al. (2011) found that the magnetic field trapped in the post-AD-shock region could be so strong as to slow down the infall speed temporarily to less than 10% of the local free-fall value, and remove essentially all of the angular momentum of the material passing through the region (see their Figure 5). However, exactly how much angular momentum is removed by the magnetic braking and by how much the infall is slowed down by the magnetic forces depend on many factors, such as the degree of core magnetization and the level of ionization, which are uncertain observationally for individual systems such as HH 111, and on model simplifications. For example, in 3D simulations (without the axisymmetry assumption) of Krasnopolsky et al. (2012), the strongly magnetized post-AD-shock region becomes unstable to the “magnetic interchange” instability, which reduces the field strength somewhat compared to the 2D case. However, the field remains strong enough to slow down the infall significantly and to remove angular momentum so efficiently as to prevent the formation of a large, rotationally supported disk (see their Figure 5 for an illustration), at least at the relatively early times reached in their simulations. Additional physical processes, such as removal of small grains (Zhao et al., 2016) and reduction in cosmic ray ionization rate (Padovani et al., 2013), and longer simulations are needed to produce large 100 AU-scale disks around relatively evolved Class I sources that are more suitable for direct comparison with the observations of the HH 111 system. Nevertheless, its inferred sub-free-fall collapse and large loss of angular momentum are qualitatively consistent with a strongly magnetized envelope-disk region that is expected on general theoretical grounds. This interpretation can be tested by future high-resolution dust polarization and Zeeman observations, perhaps with ALMA.
As for the SO shock, it could be related to the accretion shock when the infalling material right outside the KRD joins the KRD. In this case, the SO shock should be relatively thin. Alternatively, it could be related to heating through ambipolar diffusion in the post-AD-shock region, which could be broader in the radial range. The increase in rotation velocity from the innermost part of the transition region to the outer part of the KRD could be due to a redistribution of angular momentum on the disk, which tends to transport mass toward the central star and angular momentum toward the outer edge.
5 Conclusions
Our ALMA and SMA observations of the HH 111 protostellar system have shown for the first time how a Keplerian rotating disk can be formed inside a flattened envelope. As in previous study, the flattened envelope is detected in C18O, extending out to 2400 AU from the VLA 1 source. It has a differential rotation, with the outer part ( 2000 AU) better described by a rotation that has constant specific angular momentum and the innermost part ( 160 AU) by a Keplerian rotation. The rotationally supported disk is therefore relatively compact in this system, which is consistent with the dust continuum observations. Most interestingly, there is a substantial drop in specific angular momentum in the envelope-disk transition region from 2000 AU to 160 AU, by a factor of , if the flow to the protostar is assumed to be in the steady state. Such a decrease is not expected outside a disk formed from simple hydrodynamic core collapse, but can happen naturally if the core is significantly magnetized, because magnetic fields can be trapped in the transition region outside the disk by the ram pressure of the protostellar accretion flow, which can lead to efficient magnetic braking. In addition, SO shock emission is detected around the outer radius of the disk and could trace an accretion shock around the disk.
References
- Allen, Li, & Shu (2003) Allen, A., Li, Z., & Shu, F. H. 2003, ApJ, 599, 363
- Chapman et al. (2013) Chapman, N. L., Davidson, J. A., Goldsmith, P. F., et al. 2013, ApJ, 770, 151
- Galli et al. (2009) Galli, D., Cai, M., Lizano, S., & Shu, F. H. 2009, Revista Mexicana de Astronomia y Astrofisica Conference Series, 36, 143
- Hull et al. (2014) Hull, C. L. H., Plambeck, R. L., Kwon, W., et al. 2014, ApJS, 213, 13
- Joos et al. (2012) Joos, M., Hennebelle, P., & Ciardi, A. 2012, A&A543, A128
- Krasnopolsky et al. (2012) Krasnopolsky, R., Li, Z.-Y., Shang, H., & Zhao, B. 2012, ApJ, 757, 77
- Lee et al. (2009) Lee, C.-F., Hirano, N., Palau, A., et al. 2009, ApJ, 699, 1584
- Lee (2010) Lee, C.-F. 2010, ApJ, 725, 712
- Lee (2011) Lee, C.-F. 2011, ApJ, 741, 62
- Lee et al. (2014) Lee, C.-F., Hirano, N., Zhang, Q., et al. 2014, ApJ, 786, 114
- Li et al. (2011) Li, Z.-Y., Krasnopolsky, R., & Shang, H. 2011, ApJ, 738, 180
- Li et al. (2013) Li, Z.-Y., Krasnopolsky, R., & Shang, H. 2013, ApJ, 774, 82
- Li & McKee (1996) Li, Z.-Y., & McKee, C. F. 1996, ApJ, 464, 373
- Mellon & Li (2008) Mellon, R. R., & Li, Z.-Y. 2008, ApJ, 681, 1356
- Murillo et al. (2013) Murillo, N. M., Lai, S.-P., Bruderer, S., Harsono, D., & van Dishoeck, E. F. 2013, A&A, 560, A103
- Nakamura (2000) Nakamura, F. 2000, ApJ, 543, 291
- Ohashi et al. (2014) Ohashi, N., Saigo, K., Aso, Y., et al. 2014, ApJ, 796, 131
- Padovani et al. (2013) Padovani, M., Hennebelle, P., & Galli, D. 2013, A&A, 560, A114
- Podio et al. (2015) Podio, L., Codella, C., Gueth, F., et al. 2015, A&A, 581, A85
- Reipurth, Raga, & Heathcote (1992) Reipurth, B., Raga, A. C., & Heathcote, S. 1992, ApJ, 392, 145
- Reipurth et al. (1999) Reipurth, B., Yu, K. C., Rodríguez, L. F., Heathcote, S., & Bally, J. 1999, A&A, 352, L83
- Rodríguez et al. (2008) Rodríguez, L. F., Torrelles, J. M., Anglada, G., & Reipurth, B. 2008, AJ, 136, 1852
- Sakai et al. (2014) Sakai, N., Sakai, T., Hirota, T., et al. 2014, Nature, 507, 78
- Shu et al. (1987) Shu, F. H., Adams, F. C., & Lizano, S. 1987, ARA&A, 25, 23
- Terebey et al. (1984) Terebey, S., Shu, F. H., & Cassen, P. 1984, ApJ, 286, 529
- Troland & Crutcher (2008) Troland, T. H., & Crutcher, R. M. 2008, ApJ, 680, 457
- Zhao et al. (2016) Zhao, B., Caselli, P., Li, Z.-Y., et al. 2016, arXiv:1602.02729