Adsorption geometry and electronic properties of flat-lying monolayers of tetracene on the Ag(111) surface
Abstract
The geometrical and electronic properties of the monolayer (ML) of tetracene (Tc) molecules on Ag(111) are systematically investigated by means of DFT calculations with the use of localized basis set. The bridge and hollow adsorption positions of the molecule in the commensurate -Tc/Ag(111) are revealed to be the most stable and equally favorable irrespective to the approximation chosen for the exchange-correlation functional. The binding energy is entirely determined by the long-range dispersive interaction. The former lowest unoccupied orbital remains being unoccupied in the case of -Tc/Ag(111) as well as in the -phase with increased coverage. The unit cell of the -phase with point-on-line registry was adapted for calculations based on the available experimental data and the computed structures of the -phase. The calculated position of the Tc/Ag(111) interface state is found to be noticeably dependent on the lattice constant of the substrate, however its energy shift with respect to the Shockley surface state of the unperturbed clean side of the slab is sensitive only to the adsorption distance and in good agreement with the experimentally measured energy shift.
pacs:
68.43.-h, 73.20.-r, 73.20.AtI introduction
Organic molecular thin films are currently of great interest because of their possible applications in micro- and optoelectronic devices Dimitrakopoulos and Malenfant (2002); Hoppe and Sariciftci (2004). Their properties depend on the nature of the interface between the molecular layer and the substrate Shen et al. (2004); Koch et al. (2013). The performance of the molecular devices is considerably conditioned by the efficiency of charge transfer across the interface, which in turn is governed by the relative alignment of molecular energy levels with respect to the Fermi level of the metal substrate as well as the overlap between molecular and substrate wave functions Koch (2008); Tautz (2007). The presence of interface electronic states (ISs) Temirov et al. (2006); Schwalb et al. (2008); Zaitsev et al. (2010) is an additional agent influencing the overall charge transfer, albeit role of these states in the process and the mechanism of their formation are not yet fully understood Marks et al. (2014). On one hand, such hybrid states can be formed as the result of the chemical interaction of molecular orbitals with metallic states Temirov et al. (2006); Ferretti et al. (2007); Gonzalez-Lakunza et al. (2008); Ziroff et al. (2010). On the other hand, the symmetry breaking at the metal/organic interface alone, can, in many cases, lead to new interface electronic states, analogues to the Shockley state of clean metal surfaces Schwalb et al. (2008); Marks et al. (2011); Galbraith et al. (2014); Caplins et al. (2014); Schäfer et al. (2000). Theoretical investigations of these types of organic/metal interface states (IS) have focused on molecules with a perylene core and carboxylic end groups, i.e. NTCDA and PTCDA Zaitsev et al. (2010); Dyer and Persson (2010); Marks et al. (2011); Zaitsev et al. (2012); Galbraith et al. (2014). The calculations reveal that the IS has its maximum probability density between the top-most metallic layer and the plane of carbon atoms. The IS wave function shows a similar penetration into the metal substrate as the Shockley surface state Chulkov et al. (2001). At the same time, the lateral corrugation of the IS local density of states above the metal substrate resembles that of organic molecular orbitals Zaitsev et al. (2010); Dyer and Persson (2010); Marks et al. (2011); Zaitsev et al. (2012); Galbraith et al. (2014); Caplins et al. (2014).
The interaction of NTCDA and PTCDA with many metal substrates, however, is not of purely van-der-Waals type. On Ag(111) and Ag(100) a lowering and partial filling of the lowest unoccupied molecular orbital of the molecules is observed Willenbockel et al. (2015). In such a situation, it is difficult to assess to what extent this type of chemical hybridization influences the interface state and whether it attains similar properties for the case of physisorption. Here, we thus consider a model system with a weaker molecule-substrate interaction, Tetracene/Ag(111).
Tetracene (Tc) is an organic molecule with planar aromatic structure ( ) and it is one of the most promising organic semiconductor for the application due to its high charge carrier mobility Boer et al. (2003); Newman et al. (2004). A number of the arrangement patterns (or ordered phases) of Tc molecules on the Ag(111) surface has been observed as a function of coverage Soubatch et al. (2011); Sueyoshi et al. (2013). The compressed monolayer (ML) -phase with point-on-line type of commensurability, which can undergo spontaneous structural transformationSueyoshi et al. (2013), has been studied in detail by different experimental techniques Langner et al. (2005); Gonella et al. (2008). Additionally, the fully commensurate -phase with submonolayer coverage has been discovered rather recently Soubatch et al. (2011). Both phases are characterized by the same orientation of the molecule with respect to the substrate and they are suitable for the computational study of the coverage impact on the adsorption geometry and electronic properties. This work is intended to get a better understanding about the interaction between Tc molecules and the silver (111) surface, as well as its effect on the energy levels alignment and the interface electronic states.
In this study, we have examined - and -Tc/Ag(111) by means of density functional theory (DFT) calculations with numerical pseudoatomic orbitals. Because of the large size of the system the localized basis functions offer obvious advantage over the plane waves, especially for the reasonable description of the interface state which requires the metal surface to be represented by quite thick slabZaitsev et al. (2012). Nevertheless, accurate description of the delocalized surface states needs careful handling with pseudoatomic orbitals García-Gil et al. (2009). Here we explore a few ways of representation of the substrate wave function by localized numerical basis functions and show that the better one is to use different cutoff radii of the basis functions for bulk and surface silver atoms.
It was revealed that the surface state energy of the clean surface directly depend on its lattice constant. The same trend is demonstrated by the interface state which appeared higher in energy of the hybrid Tc/Ag(111) system, namely its absolute position increases with expansion of the substrate. The binding between Tc and Ag(111) can be described correctly only with taking into account the long-range dispersive forces fully determining the substrate-adsorbate interaction in this interface. In general, our calculations provide good description of the available experimental data.
II methods
The first-principles electronic structure calculation is performed within the DFT as implemented in the SIESTA code Ordejón et al. (1996); Soler et al. (2002). Localized pseudoatomic orbitals were used for the wave function representation, and deep core potentials were represented by norm-conserving Troullier-Martins pseudopotentials Troullier and Martins (1991) in the Kleynman-Bylander Kleinman and Bylander (1982) nonlocal form. The conventional generalized gradient approximation (GGA) was chosen for the exchange-correlation functional with the PBE Perdew et al. (1996) parametrization. Long-range dispersion forces were introduced by using the optB88-vdW functional of the vdW-DF2 approach especially adapted for solids Klimeš et al. (2010, 2011).
The double- polarized (DZP) basis set with the energy shift of 10 meV and generated by a soft confinement scheme was used for hydrogen (with the cutoff radius of 7.2 a.u.), oxygen (5.95 a.u.) and silver (9.73 a.u.) atoms. Such basis functions for silver provide the enlarged equilibrium lattice constant Å for both the GGA-PBE and the optB88-vdW functional. The indicated cutoff-radius value for silver was taken to reach the convergence with respect to the lattice constant. However, the reasonable silver bulk properties were found with the shorter radius a.u. of the basis orbitals. Actually, the equilibrium lattice constant Å and the bulk modulus GPa were obtained with the GGA-PBE functional, and similar values ( Å , GPa) with the optB88-vdW one.
On the one hand, for a good description of the silver (111) surface, i.e., to obtain accurate values of the surface energy, work function, energy of the surface state and its decay into the vacuum, one needs to use the basis functions with a large García-Gil et al. (2009). It was also shown Lee and Yu (2005) that the long range orbitals are needed to minimize basis set superposition error (BSSE) and reproduce the binding energy of plane wave calculations. On the other hand, a shorter provides the bulk properties consistent with the experiment, which are important to be described properly, because the increasing of the lattice constant causes the up-shift in energy of the surface state position of the Ag(111) surface. Moreover, as calculations show, the adsorption distance of aromatic molecules on metallic surfaces depends on the parameter of the substrate: the shorter the radius we chose the smaller the distance we have Buimaga-Iarinca and Morari (2014). Thereby, in examining the geometrical and electronic properties of the metal-organic interface under study, we consider three approaches to the silver-substrate description.
In the first one, the experimental value for the silver lattice constant ( Å) and the largest radius of the basis functions (=9.73 a.u.) are used. All silver atoms in the slab are pinned to their bulk positions, but the atoms of the molecular monolayer are allowed to be relaxed. In the second approach, two types of basis functions are used for silver atoms: a.u. for atoms in the upper- and lowermost silver layers of the slab (the external atoms) and a.u. for the rest of atoms (the internal atoms). As was shown in Ref. García-Gil et al. (2009), such an approach improves the description of the clean surfaces. The lattice constant is set to its equilibrium value as found with the basis functions of the internal atoms. Along with atoms in the molecular ML, the positions of the atoms in the two uppermost silver layers are optimized as well. We improve thus the description of surface electronic bands and substrate bulk properties simultaneously. It is worth noting that the use of orbitals with the largest for all atoms in the slab leads to insignificant changes of the electronic band structure, but vastly increases the computational cost. In order to demonstrate it, in the third type of substrate handling all silver atoms are taken with the large a.u. In this case, the equilibrium lattice constant has the value of Å. Again, only the positions of the silver atoms in the two uppermost layers of the slab are allowed to be optimized. Hereinafter, we refer to these approaches of the substrate description as to Model 1, 2, and 3, respectively.
The scheme of periodically repeated slabs are used to describe the infinite close packed face-centered cubic Ag(111) surface. Interaction between the periodic images of the systems in the direction perpendicular to the surface (in the -direction) is suppressed by the large size of the cell along this direction, imposing a vacuum layer of about 11 Å. A uniform mesh for the numerical integration and solution of the Poisson equation is specified by the energy cutoff of 250 Ry. The substrate was represented by four layers during structural relaxation and by 12 layers for calculations of the interface band structure. The molecular monolayer is applied to one side of the substrate only. We use the k-point sampling of the surface Brillouin zone based on the Monkhorst-Pack scheme with 22 k-points. The iterative modified Broyden procedure Johnson (1988) is applied to reach stable structures. All the considered geometries are relaxed until all interatomic forces were smaller than 0.02 eV/Å.
The spatial distribution of the interface state was computed with the help of the OpenMX (version 3.7) DFT code Ozaki et al. ; Ozaki (2003); Ozaki and Kino (2004, 2005). For silver atoms two types of basis functions with different cutoff radii of 7.0 and 9.0 Bohr (as in Model 2), but with the same size s2p2d2f1 were used, while for hydrogen and carbon atoms we chose H7.0-s2p1 and C7.0-s2p2d1, respectively. The notation in the last case means that two primitive orbitals for each s and p states and one primitive orbital for the d states with the cutoff radius of 7.0 Bohr were used. The real-space grid for numerical integration was specified by the energy cutoff of 250 Ry. The total-energy convergence was better than 0.027 meV. The surface Brillouin zone (SBZ) of the supercell was sampled with a 6 × 6 × 1 mesh of k-points. The calculation were performed within GGA-PBE approximation.
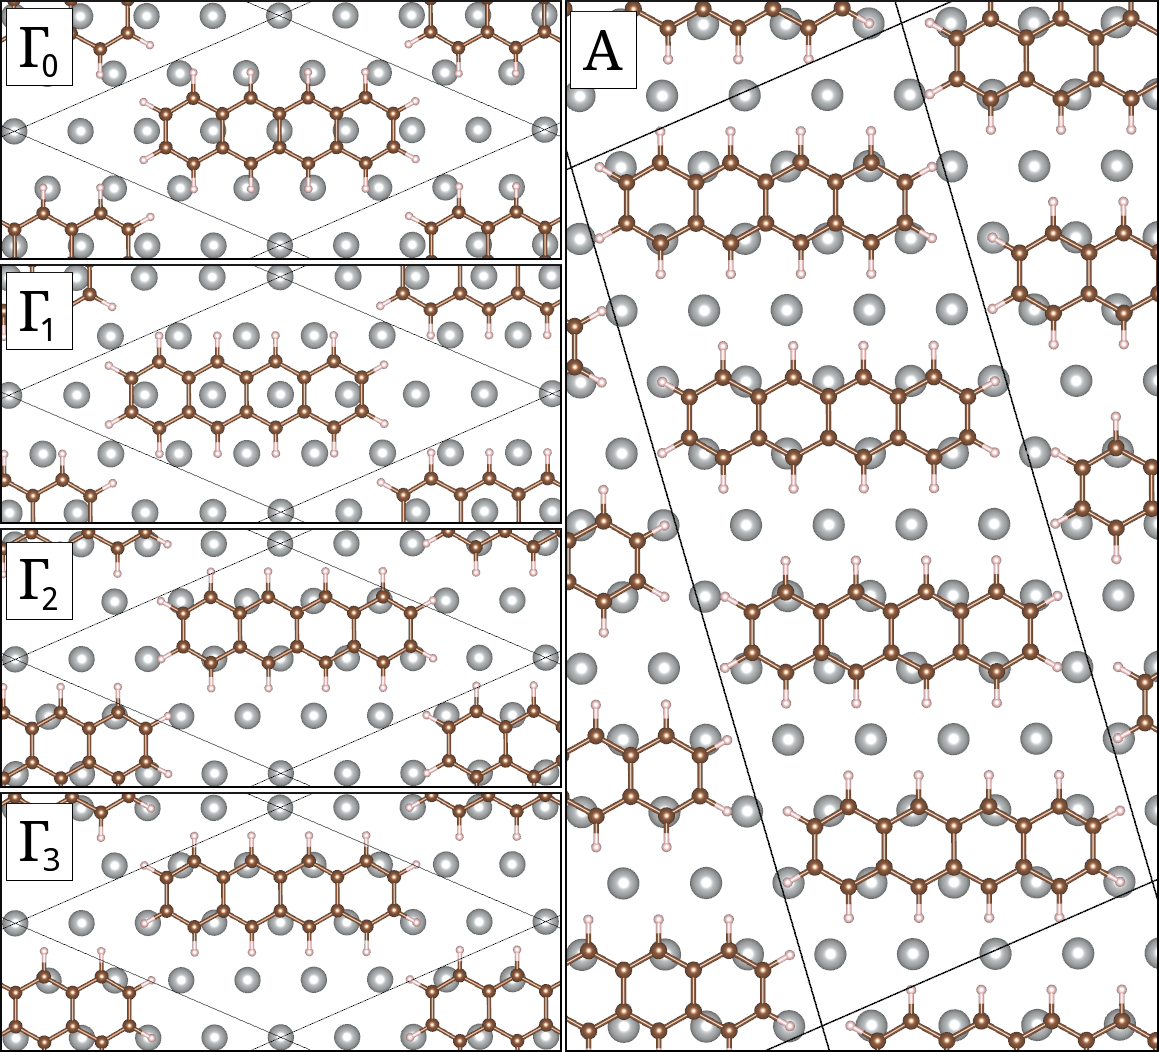
The alignment of Tc molecules on the silver (111) surface in -phase and its surface unit cell are determined in accordance with the experimental data Soubatch et al. (2011). The unit cell characterized by the structural matrix contains only one molecule with the coverage of 83%, being commensurate with hexagonal lattice of Ag(111). The orientation of the molecular longitudinal axis coincides with -directions of the silver substrate. To find the most favorable structure, four different adsorption sites are used as a starting location of the Tc center (see Fig. 1) in the procedure of interatomic forces minimization. The on-top position of Tc was proposed in the experiment as the most probable one Soubatch et al. (2011). Also, the bridge (), hollow () and long bridge () adsorption sites are considered (Fig. 1).
The unit cell of the -phase contains one Tc molecule with the coverage of 100%, which has the point-on-line coincidence with the substrate and is described by the non-integer matrix Langner et al. (2005); Soubatch et al. (2011). The commensurate unit cell can be obtained by a tenfold increase of the first unit vector and fourfold of the second one. As a result, the unit cell contains already 40 molecules with their own adsorption sites. By neglecting the shifts of the adsorption site along the first unit vector (it is only 0.1 of the silver interatomic distance), the unit cell can be tenfold shortened in this direction. Such a reduced unit cell contains only four molecules on different adsorption sites and has the 101% coverage. This adapted unit cell is used in our calculations of the electronic structure of the -Tc/Ag(111) interface, which are performed within the Model 2 only (see Fig.1).
The binding energy is introduced in the conventional way as the difference between the total energy of the whole system and the sum of the energies of independently optimized freestanding monolayer and silver substrate . The counterpoise correction Boys and Bernardi (1970) is exploited to estimate the basis set superposition error. To this end, the binding energy is written as follows:
| (1) |
Here, the substrate-adsorbate interaction energy is expressed as , where both constituents of the system can be counterpoise corrected (as indicated by the superscript in parentheses) or not, and they both are cut from optimized geometry of the whole system. The deformation term is simply the difference between the energy of the optimized freestanding monolayer (or substrate) and the energy of the monolayer (substrate) clamped in the adsorption geometry.
III Results
The calculated binding energy of -Tc/Ag(111) listed in Table 1 evidences that Tc molecules prefer to be lined up directly above the silver rows by their external carbon atoms, i. e., by those linked with hydrogens (Fig. 1). The long bridge () and on-top adsorption geometries () provide disadvantageous alignments of Tc molecules on Ag(111); in both cases carbons are located upon the interstitial sites of the underlying silver layer (Fig. 1). The same trends in adsorption geometry were revealed in the recent calculation of the Tc/Ag(110) interface Tao et al. (2015). Because of the obvious disadvantage of the geometry, it will excluded from our further analysis, but despite the unfavorable adsorption structure of , it will be considered as a reference structure proposed by experimentalists Soubatch et al. (2011). The bridge () and hollow () sites are the most favorable adsorption sites of -Tc and they both have very close binding energies (Table 1). The above statement holds true irrespectively of the exchange-correlation approximation and type of the substrate model used.
| (C) | (H) | (C) | (H) | (C) | (H) | ||||||
|---|---|---|---|---|---|---|---|---|---|---|---|
| top () | bridge () | hollow () | |||||||||
| GGA-PBE | |||||||||||
| Model 1 [4.09] | -0.40 | -0.42 | -0.42 | ||||||||
| Model 2 [4.16] | -0.48 | -0.50 | -0.49 | ||||||||
| Model 3 [4.23] | -0.32 | -0.35 | -0.35 | ||||||||
| optB88-vdW | |||||||||||
| Model 1 [4.09] | -1.96 | -2.05 | -2.05 | ||||||||
| Model 2 [4.17] | -1.97 | -2.06 | -2.06 | ||||||||
| Model 3 [4.23] | -1.86 | -1.97 | -1.97 | ||||||||
III.1 Adsorption geometry
For the same adsorption site, the vertical separation of carbon atoms as found with the GGA-PBE functional within Model 1 and 2 is characterized by the fairly close averaged values (see Table 1); the difference is merely of 0.03 Å in the case of the on-top and bridge positions of the molecule. Model 3 gives the noticeably smaller adsorption height for all adsorption sites. It is worth also noting that the Tc molecule is rather distorted on the Ag(111) surface. Actually, the z-coordinate of the molecule atoms varies within the range of 0.07–0.1 Å. It is clearly seen in Table 1, where the superscript in parentheses denotes the maximal difference between the perfect z-coordinate of the topmost silver layer and the z-position of carbon and hydrogen atoms of the molecule. For the on-top adsorption geometry, the distortion is found along the longitudinal axis only, and the center of the molecule is farther from the substrate than the molecule edges. The attractive interaction between carbon and underlying silver atoms results in more complicated distortion of Tc, when the center of the latter occupies the bridge or hollow site. For instance, the lateral slop of Tc in the hollow () site takes place, i.e., the side of the molecule, on which the external carbon atoms locate directly over the silver atoms is about 0.08 Å closer to the substrate than the side with carbon atoms located over the interstitials (see Fig. 1).
The inclusion of the long range interaction within optB88-vdW approximation gives rise to a reduction of the vertical adsorption distance (Table 1). Model 1 and 2 provide almost identical vertical separations and binding energies. As it was before, Model 3 using the enlarged Ag lattice constant results in shorter separations and a weaker binding. The adsorption geometry is characterized by the nearly flat shape of Tc, while, as in the previous case, the molecule is more distorted in and in accordance with the mutual alignment of carbon and silver atoms. Moreover, in the case of the hollow adsorption site the slop of the Tc molecule has the same value regardless the approximation chosen for the exchange-correlation functional.
The experimental estimation of the binding energy for -Tc by the thermal desorption study Gonella et al. (2008) is about 1 eV (1.4 eV in the zero-coverage limit), while for -Tc it is expected to be a slightly higher, because of the smaller coverage. The calculated binding energy of structure is thus considerably underestimated within the GGA-PBE calculations (Table 1); as compared with the experimental value the energy of 0.5 eV is half as much. On the contrary, the calculation with the optB88-vdW functional provides , which is twice as much as compared with the experiment (Table 1).
The detailed insight into the substrate-adsorbate interaction is done for the bridge () geometry, because it is one of the most energetically favorable structure. The major part of the binding energy is the interaction energy (Table 2), while the deformation energy of both the molecular monolayer and the topmost layers of the substrate is of 20 meV in the PBE calculations and slightly larger in the case of the optB88-vdW functional. As compared with the GGA-PBE values, the long-range dispersive interaction gives rise to a fourfold increase in the interaction energy.
| -Tc | ||||||
| GGA-PBE | ||||||
| Model 1 [4.09] | 3.52 | -0.43/-0.02 | 0.00 | -0.42/-0.01 | 0.10/0.14 | |
| Model 2 [4.16] | 3.49 | -0.53/-0.02 | -0.01 | -0.01 | -0.50/0.00 | 0.07/0.12 |
| Model 3 [4.23] | 3.32 | -0.37/-0.01 | -0.01 | -0.02 | -0.35/0.01 | 0.12/0.16 |
| optB88-vdW | ||||||
| Model 1 [4.09] | 3.14 | -2.06/-1.50 | -0.01 | -2.05/-1.49 | 0.13/0.20 | |
| Model 2 [4.17] | 3.16 | -2.09/-1.51 | -0.01 | -0.01 | -2.06/-1.48 | 0.09/0.18 |
| Model 3 [4.23] | 3.00 | -2.01/-1.54 | -0.01 | -0.03 | -1.97/-1.50 | 0.14/0.21 |
| -Tc | ||||||
| optB88-vdW | ||||||
| Model 2 [4.17] | 3.16 | -1.87/-1.44 | -0.01 | -0.02 | -1.84/-1.41 | 0.10/0.16 |
The binding energy computed with the use of localized basis functions tends to be overestimated by reason of BSSE, which should be corrected. There is a noticeable reduction in counterpoise corrected substrate-adsorbate interaction, because of quite large area of Tc molecule for both functionals used. In the GGA-PBE calculations, the considered structure becomes even unstable (Table 2), being characterized by the positive binding energy. In the case of the optB88-vdW functional, the counterpoise corrected binding energy comes closer to the experimental value Gonella et al. (2008), but it is still overestimated. Thus, the binding of the molecular monolayer with silver in -Tc/Ag(111) is fully determined by long-range dispersive forces. Note also that the BSSE-free values of the binding energy are almost the same for all models of the substrate; its deviation is about 20 meV.
The calculation of -Tc/Ag(111) was performed in Model 2 with optB88-vdW functional only. As was described above, the coverage in adapted unit cell coincides well with the experimental one. The adsorption sites for Tc were chosen in accordance with -phase calculation, i.e., the external carbon atoms reside above the silver atoms (Fig. 1) as in the bridge and hollow adsorption sites. The averaged vertical separations for carbon (3.16 Å) and hydrogen (3.13 Å) atoms are very close to the -phase results (see table 2), but the binding energy becomes smaller as compared with the -phase because of the increased coverage.
III.2 Charge transfer and bands alignment
Due to the substrate-adsorbate interaction, the real space electron density rearrangement occurs in the interface region. The charge transfer between the substrate and the molecular monolayer can be extracted from the laterally averaged electron-density difference, which is calculated in the following way:
Here, is the charge density of the interface under study averaged over the -plane within the unit cell, and are the charge densities of the monolayer and the substrate, respectively. A positive value of indicates a gain in electron density upon adsorption, while a negative value means a loss of electrons. In Fig. 2, it is clearly seen that the regions around molecular plane loose electrons. The amount of change transfer can be thus determined by function , here is a point in the vacuum where is zero. Since the integration is started from the clean side of the slab, which is on the left in Fig. 2, the positive values of at a given provide the amount of charge, which flow from the right side into the left side with respect to this and vise versa for the negative values. If we fix the boundary between substrate and adsorbate at the point in interface region, where crosses zero on the left of its global minimum, then the positive will determine the charge transfer from molecule to metal. The charges presented in Table 2 have values which are close to each other. Nevertheless, distinctly depends on adsorption distance; it tends to be increased with shortening of the molecule-substrate separation. Additionally, is sensitive to the overlap between the molecular and the substrate wave functions, it is clearly seen on example of Model 2 (see Fig. 2 b, d), where the basis functions of the topmost silver atoms with increased were used. The influence of the wave functions overlap on the amount of charge flow is also observed in the case of the counterpoise corrected charge difference. The superposition of substrate and molecule basis functions is expected to cause an error in a charge density in the same way as in the interaction energy. The amount of charge transfered into the substrate noticeably increased due to the redistribution of BSSE free charge density (see Table 2), and the accumulation of charge density upon silver layer becomes evident (see Fig. 2).
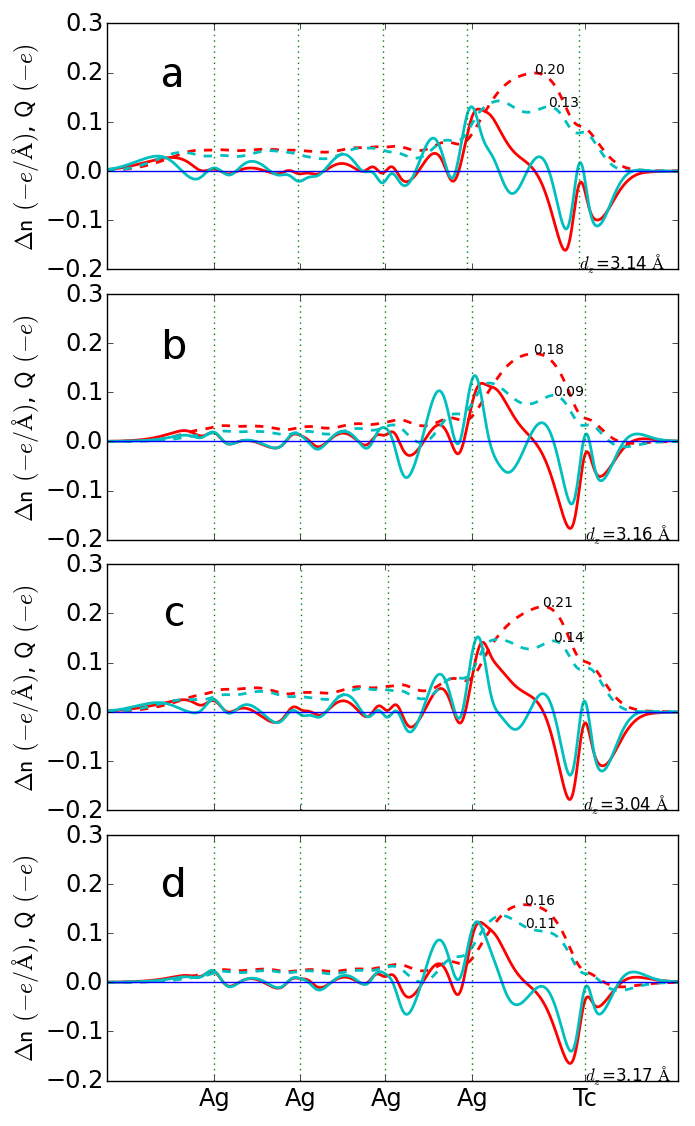
The aforementioned behavior of and can be interpreted in terms of the push-back effect Witte et al. (2005), which is typical for organic molecules physisorbed onto metallic surfaces. Actually, the repulsive exchange interaction between the molecular and substrate electrons, i.e., Pauli repulsion, leads to the molecular electronic cloud pushes the substrate electronic cloud back into the metal. The same mechanism is responsible for charge transfer in the repeatedly described PTCDA/Au(111) interface Romaner et al. (2009); Rusu et al. (2010).
The charge density difference of the -phase with increased coverage of Tc on Ag(111) provides almost the same outflow of charge from the ML as in the -phase, i.e. the increase of the charge density in the ML has a minimal effect on the amount of charge transfered. Note, a negative work function change upon adsorption of Tc has been experimentally observed Frank et al. (1988), suggesting donation of negative charge from the molecule to the Ag substrate, which was roughly estimated afterwards Gonella et al. (2008); the present calculation is thus consistent with experimental findings.
The fact that the molecular ML looses electrons implies that there is an electron donation from Tc to the substrate involving many formerly occupied molecular orbitals and that the LUMO (the lowest unoccupied molecular orbital) of Tc is still empty after the interaction with silver. The projected band structure onto -states of carbon atoms in the directions of the reciprocal lattice vectors was calculated for the system where silver substrate is represented by a 12-layer slab ( Fig. 3). As clearly seen in the figure, the energy-bands alignment of the interacting systems with respect to the Fermi level ensures that the LUMO of Tc remains unoccupied and non-dispersive, residing close to the Fermi level, especially in the optB88-vdW calculations.
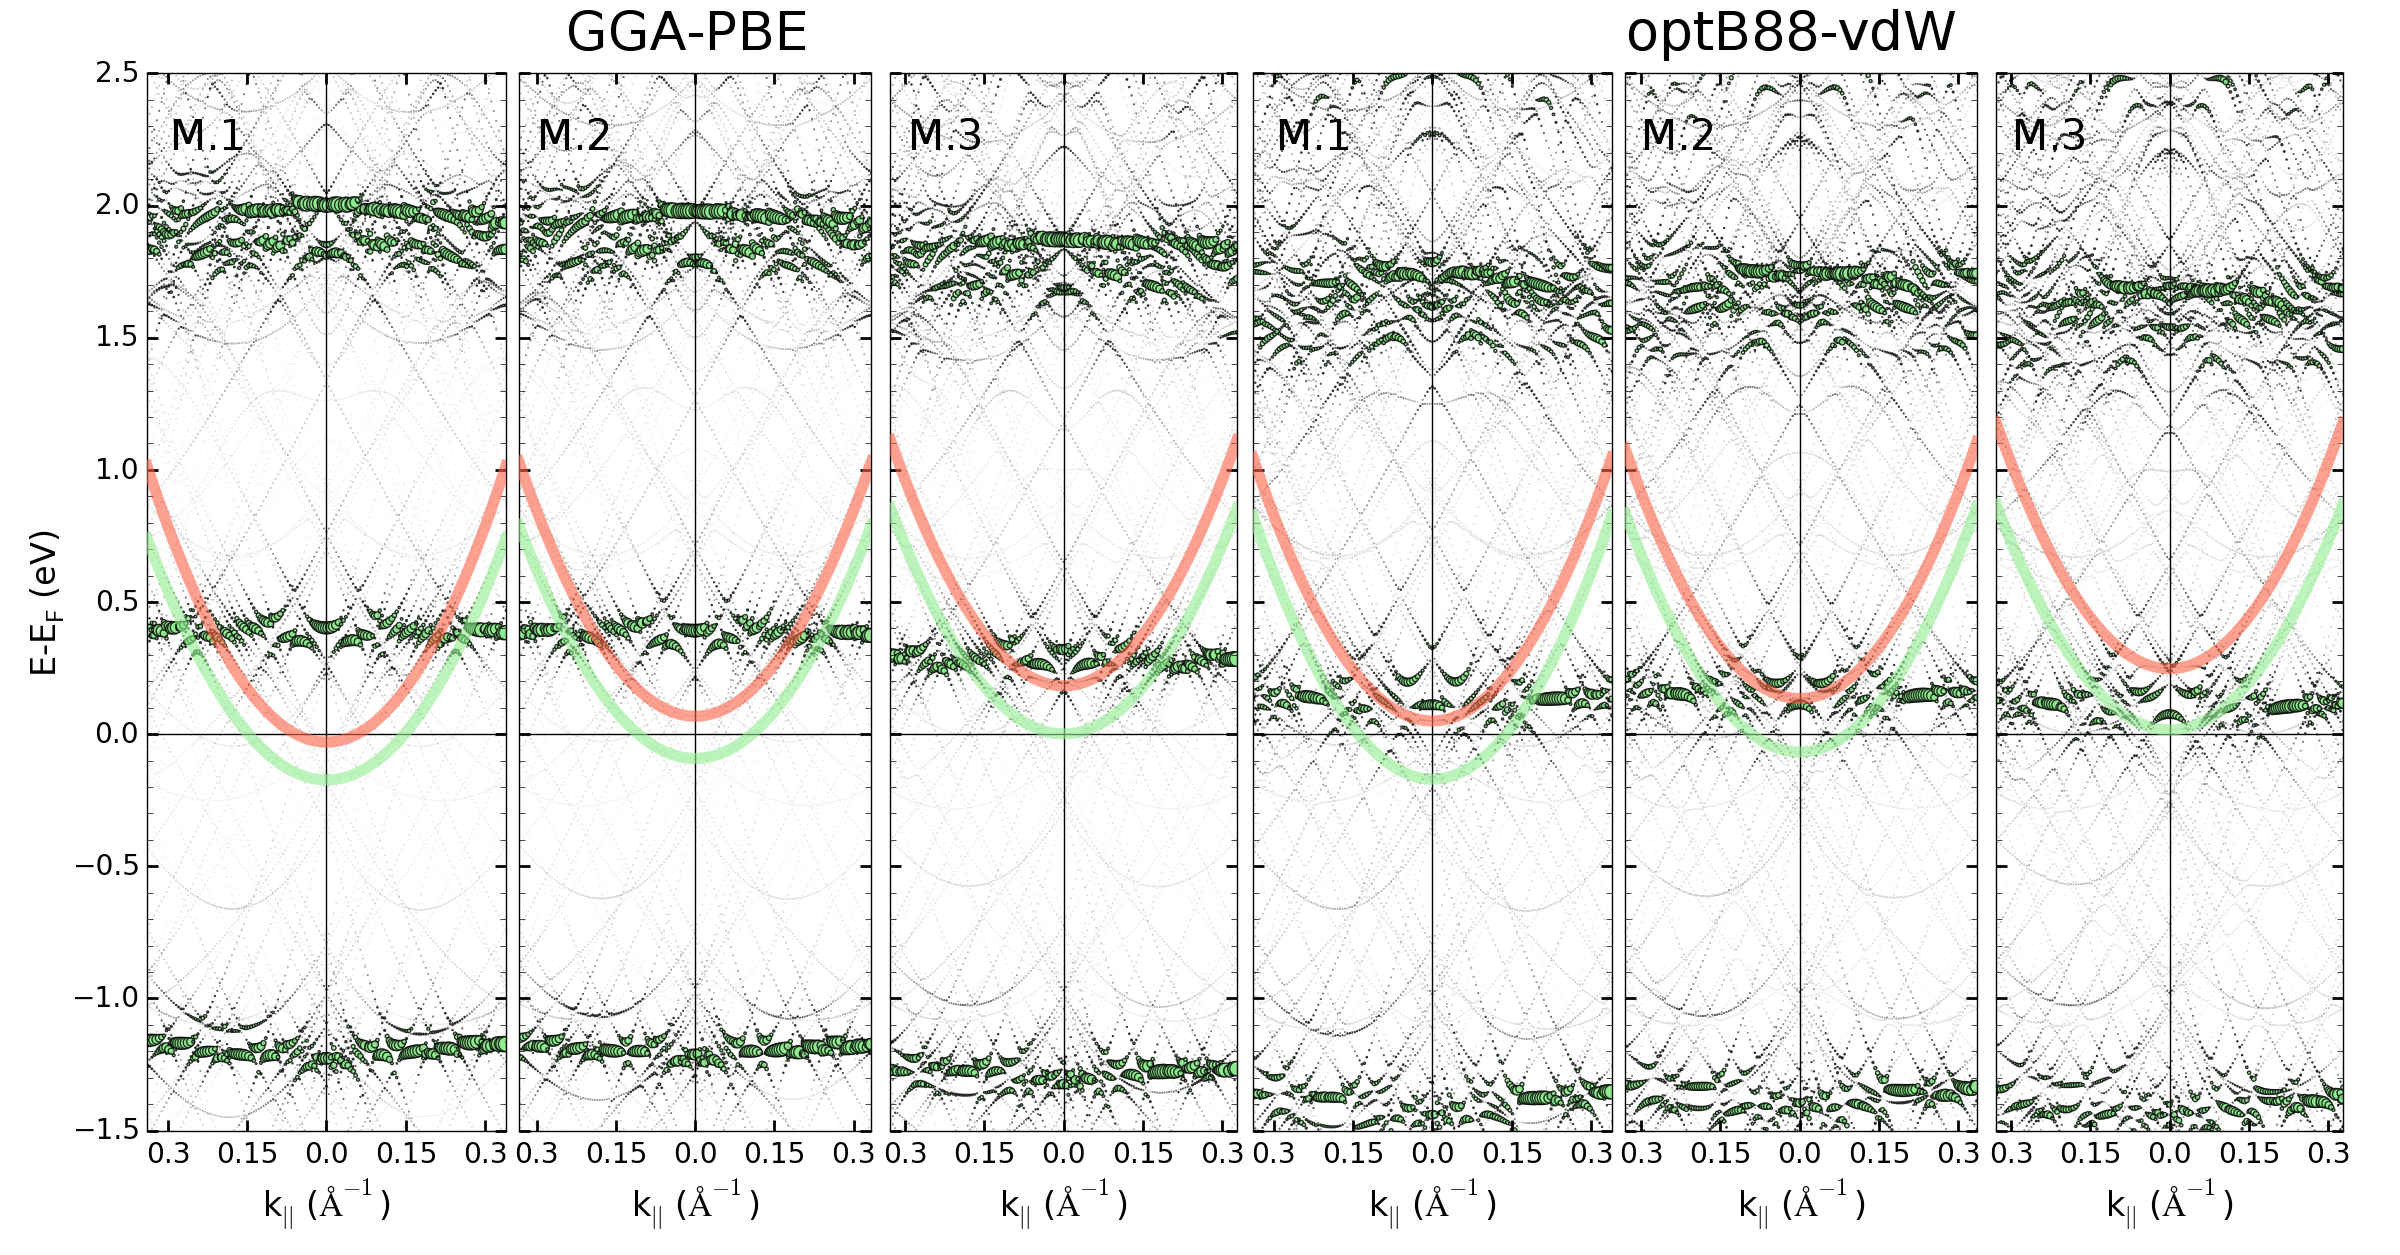
The band structure calculated within Model 1 and 2 shows similar energy values for the unoccupied LUMO and LUMO+1 (Table 3), while these orbitals are shifted down in the case of Model 3 for both functionals (see Table 2). This down-shift can be explained by the decrease of the substrate-adsorbate distance. Therefore, the calculated energy of the LUMO with the GGA-PBE functional (390 meV) is higher than the value of 150 meV obtained with the optB88-vdW one (Table 3). Since the adsorption height of the-phase considered in Model 2 within optB88-vdW approximation is the same as of the -phase, the energy of the LUMO has close value too, but now this band is characterized by a larger width.
The adsorption of the Tc monolayer on Ag(111) in the -phase results in an up-shift of the silver surface state (SS). The same transformation of SS manifests itself after adsorption of the NTCDA and PTCDA Zaitsev et al. (2010); Marks et al. (2011); Zaitsev et al. (2012) or phthalocyanine Caplins et al. (2014) molecules on the same substrate, whereas the downshift of the SS was observed for pentacene molecules absorbed on Cu(110) Scheybal et al. (2009). The projected band structure onto the -states of silver atoms located in the uppermost substrate layer covered by the ML or the clean lowermost silver layer directly reveals the interface state (IS) or the clean-side SS of the slab, respectively. Both states are shown in Fig. 3 by red (IS) and green (SS) dispersive curves.
The energies of both states at the -point depend strongly on the type of the substrate model. The calculated SS energy of the clean Ag(111) surface in the slab model is very sensitive to the silver lattice constant; the greater the equilibrium lattice constant that the bulk silver possesses the higher the SS energy we obtain. The same dependence is observed in the behavior of both the clean-side SS of the -Tc/Ag(111) slab and the IS. It is worth noting that if an extremely thick slab is used, the bonding-antibonding splitting of two surface states (since we have two surfaces of the slab) would be negligible. After the adsorption of the molecular monolayer on one side of the slab, the respective SS transforms into the interface state, while the other tends to be a surface state of the thick slab limit. Therefore, the difference between the resulting IS and SS represents the surface-state transformation energy. As follows from Table 3, in Model 1 and 2 the differences for the -Tc/Ag(111) interface are fairly close, while in Model 3 it has a larger value due to the smaller adsorption distance Zaitsev et al. (2010, 2012). Definitely, the GGA-PBE calculation provides smaller IS energies then optB88-vdW one for the same reason.
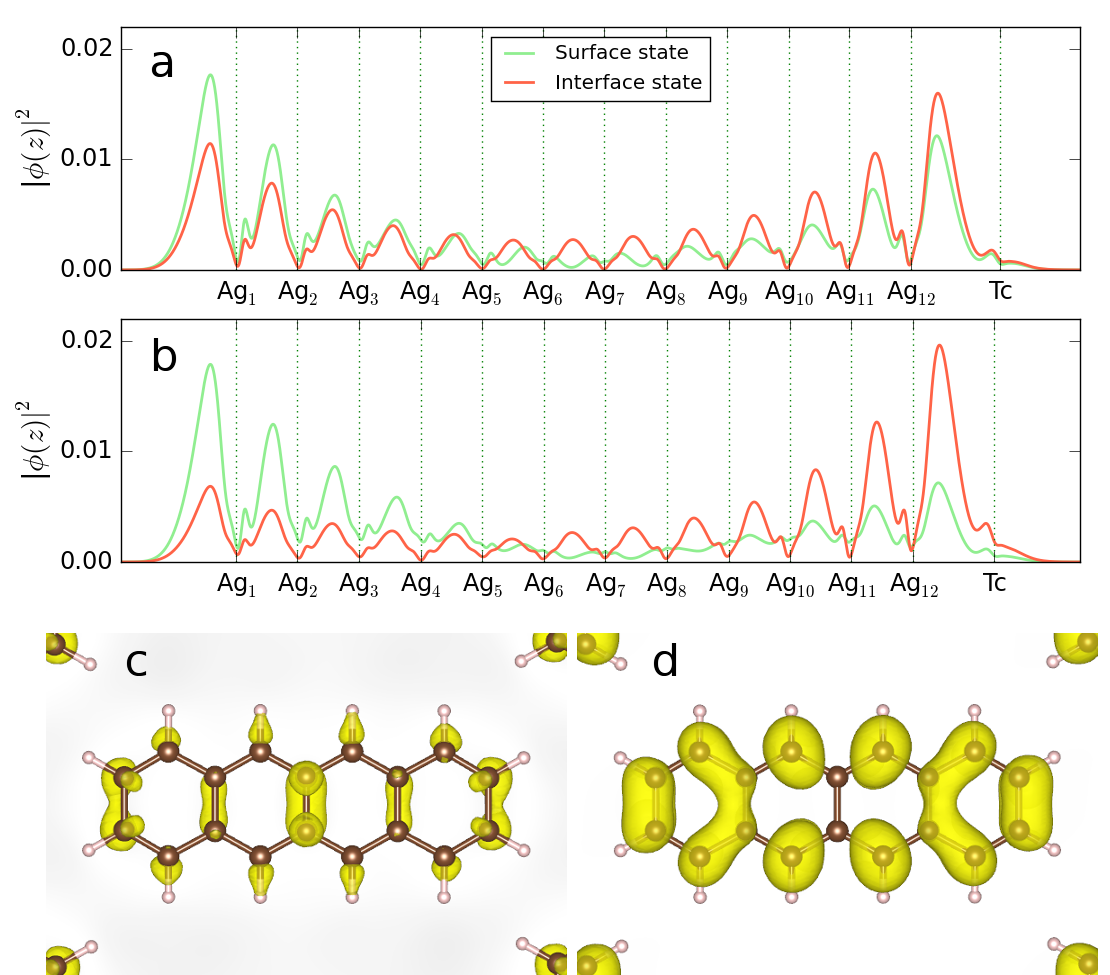
The adsorption distance is responsible for the spatial localization of the IS wave function. The perturbation of the SS by adsorbed molecules becomes stronger with decreasing the distance. For the quite big adsorption distance obtained in the GGA-PBE calculation, the charge density of the IS is localized almost equally on both sides of the slab as well as the clean-side SS (see Fig. 4 a). For the shorter distance obtained with optB88-vdW functional, the IS tends to be more localized in the interface region, while the SS on the clean side (Fig 4 b). In the case of NTCDA and PTCDA on Ag(111), there is a strong chemical interaction between the functional group and metallic atoms, therefore the adsorption distance is much shorter, the perturbation of the former SS is stronger, so the IS wave function is almost completely localized on the side with the adsorbate, whereas the SS resides on the opposite clean side of the slab Zaitsev et al. (2012).
The overlap between the IS and molecular state wave functions exhibits the same dependence from the substrate-adsorbate vertical separation. For the largest distance, the accumulation of the IS charge density on the molecular ML has a minimal value, but it increases as the adsorbate approaches the substrate. The shape of the IS charge density localized on the Tc molecule (Fig. 4 c) is insensitive to the adsorption distance, and there is no hybridization of the IS with the unoccupied former LUMO of Tc (Fig. 4d) though they have close energies at the -point. In contrast, in the strongly interacting systems as NTCDA or PTCDA on Ag(111), the former LUMO is partially occupied and the shape of the IS in molecular region resembles the LUMO of the free molecule.
Another factor affecting the magnitude of the SS transformation is the adsorbate coverage or the density of carbon atoms in the surface unit cell Zaitsev et al. (2012). The -phase calculations illustrate the influence of the increased coverage by ; the transformation of the SS-IS energy is increased by 30 meV in comparison with the -phase calculations within Model 2 (Table 3). The available STS (scanning tunneling spectroscopic) data Soubatch et al. (2011) of -Tc/Ag(111) provides the SS-IS energy difference of 220 meV, which is well described by the optB88-vdW calculation.
| GGA-PBE | optB88-vdW | ||||||||
| -Tc | |||||||||
| Model 1 | -20 | -172 | 152 | 390 | 50 | -164 | 214 | 140 | |
| Model 2 | 68 | -92 | 160 | 390 | 135 | -70 | 205 | 150 | |
| Model 3 | 183 | 1 | 182 | 280 | 248 | 16 | 232 | 110 | |
| -Tc | |||||||||
| Model 2 | 175 | -60 | 235 | 150 | |||||
| exp Soubatch et al. (2011) | 220 | 830 | |||||||
IV Conclusion
We performed the theoretical study of the Tc/Ag(111) metal-organic interface by means of DFT calculations with localized basis. We focused on the simultaneous description of the structural and electronic properties on equal footings. The optB88-vdW version of the vdW-DF2 family of exchange-correlation functionals especially optimized for solids was used as well as the conventional GGA-PBE approximation.
The bridge and hollow adsorption sites were determined as the most stable geometries of -Tc/Ag(111) irrespective to the approximation chosen for the exchange-correlation functional, but vdW contribution constitutes a decisive part of the substrate-adsorbate interaction. The inclusion of the long-range dispersive forces into the calculations provides the close agreement of the binding energy with the available experimental data Gonella et al. (2008) and, therefore, better description of the adsorption geometry, whereas the conventional GGA-PBE scheme underestimates the equilibrium adsorption distance.
We suggested and tested three schemes of handling the substrate in the metal-organic hybrid interface under study in order to overcome the controversial trends of its bulk and surface electronic properties in the case of localized-basis-set description. We obtained the best result within the Model 2, where only the silver atoms on the slab surfaces are described by long-range basis orbitals, while the internal (bulk) silver atoms are characterized by rather short orbitals providing adequate bulk properties. In our case of weakly bound adsorbate, the corrugation of the substrate is small and the Model 1 with fixed substrate provides a good description as well. But when considering chemisorbed systems, like PTCDA/Ag(111), the stronger substrate-adsorbate interaction gives rise to the larger substrate corrugation and the possibility for the substrate to be relaxed becomes quite important.
We showed that too large lattice constant of the substrate (Model 3) results in noticeable change of adsorption geometry and, in consequence, to inadequate description of the electronic structure. Moreover, the absolute position of the interface state (or surface state in case of pristine surface) is systematically shifted upward with growth of the substrate lattice constant. But, the difference between the interface and surface state energies is tolerant to the substrate characteristics, it is sensitive only to the adsorption distance of the adsorbate. The interface states of the both phases are fully unoccupied, and because of the enlarged density of Tc molecules in the -phase the IS energy is higher than in the -phase. The calculation with the OptB88-vdW functional gives not only good value of the binding energy, but the IS energy is in close agreement with the experimental measurements Soubatch et al. (2011).
Acknowledgements.
This work is a project of the SFB 1083 “Structure and Dynamics of Internal Interfaces” funded by the Deutsche Forschungsgemeinschaft (DFG). We acknowledge partial support from the University of Basque Country UPV/EHU (IT-756-13), the Departamento de Educación del Gobierno Vasco, The Tomsk State University Academic D.I. Mendeleev Fund Program (Grant No. 8.1.05.2015), the Spanish Ministry of Economy and Competitiveness MINECO (Grant No. FIS2013-48286-C2-1-P), and Saint Petersburg State University (Project No. 11.50.202.2015).References
- Dimitrakopoulos and Malenfant (2002) C. Dimitrakopoulos and P. Malenfant, Advanced Materials 14, 99 (2002).
- Hoppe and Sariciftci (2004) H. Hoppe and N. S. Sariciftci, Journal of Materials Research 19, 1924 (2004).
- Shen et al. (2004) Y. Shen, A. R. Hosseini, M. H. Wong, and G. G. Malliaras, ChemPhysChem 5, 16 (2004).
- Koch et al. (2013) N. Koch, U. Ueno, and A. Wee (Eds.), The Molecule-metal interface (Wiley-VCH, Weinheim, 2013).
- Koch (2008) N. Koch, Journal of Physics: Condensed Matter 20, 184008 (2008).
- Tautz (2007) F. Tautz, Progress in Surface Science 82, 479 (2007).
- Temirov et al. (2006) R. Temirov, S. Soubatch, A. Luican, and F. S. Tautz, Nature 444, 350 (2006).
- Schwalb et al. (2008) C. H. Schwalb, S. Sachs, M. Marks, A. Schöll, F. Reinert, E. Umbach, and U. Höfer, Physical Review Letters 101, 146801 (2008).
- Zaitsev et al. (2010) N. L. Zaitsev, I. A. Nechaev, and E. V. Chulkov, Journal of Experimental and Theoretical Physics 110, 114 (2010).
- Marks et al. (2014) M. Marks, A. Schöll, and U. Höfer, Journal of Electron Spectroscopy and Related Phenomena 195, 263 (2014).
- Ferretti et al. (2007) A. Ferretti, C. Baldacchini, A. Calzolari, R. Di Felice, A. Ruini, E. Molinari, and M. G. Betti, Physical Review Letters 99, 046802 (2007).
- Gonzalez-Lakunza et al. (2008) N. Gonzalez-Lakunza, I. Fernández-Torrente, K. J. Franke, N. Lorente, A. Arnau, and J. I. Pascual, Physical Review Letters 100, 156805 (2008).
- Ziroff et al. (2010) J. Ziroff, F. Forster, A. Schöll, P. Puschnig, and F. Reinert, Physical Review Letters 104, 233004 (2010).
- Marks et al. (2011) M. Marks, N. L. Zaitsev, B. Schmidt, C. H. Schwalb, A. Schöll, I. A. Nechaev, P. M. Echenique, E. V. Chulkov, and U. Höfer, Phys. Rev. B 84, 081301 (2011).
- Galbraith et al. (2014) M. C. E. Galbraith, M. Marks, R. Tonner, and U. Höfer, The Journal of Physical Chemistry Letters 5, 50 (2014).
- Caplins et al. (2014) B. W. Caplins, D. E. Suich, A. J. Shearer, and C. B. Harris, The Journal of Physical Chemistry Letters , 1679 (2014).
- Schäfer et al. (2000) A. Schäfer, I. L. Shumay, M. Wiets, M. Weinelt, T. Fauster, E. V. Chulkov, V. M. Silkin, and P. M. Echenique, Phys. Rev. B 61, 13159 (2000).
- Dyer and Persson (2010) M. S. Dyer and M. Persson, New Journal of Physics 12, 063014 (2010).
- Zaitsev et al. (2012) N. L. Zaitsev, I. A. Nechaev, P. M. Echenique, and E. V. Chulkov, Phys. Rev. B 85, 115301 (2012).
- Chulkov et al. (2001) E. V. Chulkov, V. M. Silkin, and M. Machado, Surface Science 482–485, 693 (2001).
- Willenbockel et al. (2015) M. Willenbockel, D. Lüftner, B. Stadtmüller, G. Koller, C. Kumpf, S. Soubatch, P. Puschnig, M. G. Ramsey, and F. S. Tautz, Physical Chemistry Chemical Physics 17, 1530 (2015).
- Boer et al. (2003) R. W. I. d. Boer, T. M. Klapwijk, and A. F. Morpurgo, Applied Physics Letters 83, 4345 (2003).
- Newman et al. (2004) C. R. Newman, R. J. Chesterfield, J. A. Merlo, and C. D. Frisbie, Applied Physics Letters 85, 422 (2004).
- Soubatch et al. (2011) S. Soubatch, I. Kröger, C. Kumpf, and F. Tautz, Phys. Rev. B 84, 195440 (2011).
- Sueyoshi et al. (2013) T. Sueyoshi, M. Willenbockel, M. Naboka, A. Nefedov, S. Soubatch, C. Wöll, and F. S. Tautz, The Journal of Physical Chemistry C 117, 9212 (2013).
- Langner et al. (2005) A. Langner, A. Hauschild, S. Fahrenholz, and M. Sokolowski, Surface science 574, 153 (2005).
- Gonella et al. (2008) G. Gonella, H.-L. Dai, and T. Rockey, Journal of Physical Chemistry C 112, 4696 (2008).
- García-Gil et al. (2009) S. García-Gil, A. García, N. Lorente, and P. Ordejón, Phys. Rev. B 79, 075441 (2009).
- Ordejón et al. (1996) P. Ordejón, E. Artacho, and J. M. Soler, Physical Review B 53, R10441 (1996).
- Soler et al. (2002) J. M. Soler, E. Artacho, J. D. Gale, A. García, J. Junquera, P. Ordejón, and D. Sánchez-Portal, Journal of Physics: Condensed Matter 14, 2745 (2002).
- Troullier and Martins (1991) N. Troullier and J. L. Martins, Physical Review B 43, 1993 (1991).
- Kleinman and Bylander (1982) L. Kleinman and D. M. Bylander, Phys. Rev. Lett. 48, 1425 (1982).
- Perdew et al. (1996) J. P. Perdew, K. Burke, and M. Ernzerhof, Phys. Rev. Lett. 77, 3865 (1996).
- Klimeš et al. (2010) J. Klimeš, D. R. Bowler, and A. Michaelides, Journal of Physics: Condensed Matter 22, 022201 (2010).
- Klimeš et al. (2011) J. Klimeš, D. R. Bowler, and A. Michaelides, Physical Review B 83, 195131 (2011).
- Lee and Yu (2005) K. Lee and J. Yu, Surface Science 589, 8 (2005).
- Buimaga-Iarinca and Morari (2014) L. Buimaga-Iarinca and C. Morari, Theoretical Chemistry Accounts 133 (2014).
- Johnson (1988) D. D. Johnson, Phys. Rev. B 38, 12807 (1988).
- (39) T. Ozaki, H. Kino, J. Yu, M. Han, N. Kobayashi, M. Ohfuti, F. Ishii, T. Ohwaki, H. Weng, and K. Terakura, http://openmx-square.org/.
- Ozaki (2003) T. Ozaki, Physical Review B 67, 155108 (2003).
- Ozaki and Kino (2004) T. Ozaki and H. Kino, Physical Review B 69, 195113 (2004).
- Ozaki and Kino (2005) T. Ozaki and H. Kino, Physical Review B 72, 045121 (2005).
- Boys and Bernardi (1970) S. Boys and F. Bernardi, Molecular Physics 19, 553 (1970).
- Tao et al. (2015) Y. Tao, H. Mao, H. Zhang, and P. He, Surface Science 641, 135 (2015).
- Witte et al. (2005) G. Witte, S. Lukas, P. S. Bagus, and C. Wöll, Applied Physics Letters 87, 263502 (2005).
- Romaner et al. (2009) L. Romaner, D. Nabok, P. Puschnig, E. Zojer, and C. Ambrosch-Draxl, New Journal of Physics 11, 053010 (2009).
- Rusu et al. (2010) P. C. Rusu, G. Giovannetti, C. Weijtens, R. Coehoorn, and G. Brocks, Phys. Rev. B 81, 125403 (2010).
- Frank et al. (1988) K. H. Frank, P. Yannoulis, R. Dudde, and E. E. Koch, The Journal of Chemical Physics 89, 7569 (1988).
- Scheybal et al. (2009) A. Scheybal, K. Müller, R. Bertschinger, M. Wahl, A. Bendounan, P. Aebi, and T. A. Jung, Physical Review B 79, 115406 (2009).