Search for high- conventional superconductivity at megabar pressures in the lithium-sulfur system
Abstract
Motivated by the recent report of superconductivity above 200 K in ultra-dense hydrogen sulfide, we search for high- conventional superconductivity in the phase diagram of the binary Li-S system, using ab-initio methods for crystal structure prediction and linear response calculations for the electron-phonon coupling. We find that at pressures higher than 20 GPa, several new compositions, besides the known Li2S, are stabilized; many exhibit electride-like interstitial charge localization observed in other alkali metal compounds. Of all predicted phases, only Li3S at P > 640 GPa displays a sizable , in contrast to what is observed in sulfur and phosphorus hydrides, where several stoichiometries lead to high . We attribute this difference to 2-2 hybridization and avoided core overlap, and predict similar behavior for other alkali metal compounds.
pacs:
The successful prediction of a record critical temperature () of 203 K in hydrogen sulfide (H3S) at 200 GPa Drozdov et al. (2015a); Troyan et al. (2016); Duan et al. (2014) gave a considerable impulse to the ab-initio design of new high- superconductors at extreme pressures. H3S was in fact the first example of a conventional high-temperature superconductor whose crystal structure and were first predicted completely from first-principles, and later confirmed experimentally. It is now understood that its record-high stems from the constructive interference of large vibrational frequencies, electronic van-Hove singularities at the Fermi level and large electron-phonon () matrix elements due the formation of covalent H-S bonds. Duan et al. (2014); Bernstein et al. (2015); Heil and Boeri (2015); Flores-Livas, José et al. (2016); Quan and Pickett (2016); Li et al. (2014); Papaconstantopoulos et al. (2015); Luciano et al. (2015); Errea et al. (2015) A few months after H3S, a high- superconducting phase was also found in compressed phosphines, which is compatible with several metastable PHx phases identified by first-principles calculations. Drozdov et al. (2015b); Shamp et al. (2016); Flores-Livas et al. (2016); Fu et al. (2016) Recent reports of metallization in hydrogen at 350 GPa have risen the hope to attain superconductivity at room temperatures, or even higher. Ashcroft (1968); Cudazzo et al. (2008); McMahon and Ceperley (2011); Borinaga et al. (2016); Szczȩs̀niak and Jarosik (2009); M.I. Eremets (2016); Dalladay-Simpson (2016) While several hydrides have been proposed as prospective superconductors along the lines of H3S; Ashcroft (2004); Tse et al. (2007); Gao et al. (2010); Kim et al. (2010); Yao and Klug (2010); Flores-Livas et al. (2012) high- superconductivity at high pressures in hydrogen-free compounds is still a largely unexplored field.
In this work we search for high- superconductivity at extreme pressures in the Li-S system, using the USPEX method for ab-initio evolutionary crystal structure prediction, Oganov et al. and density functional perturbation theory (DFPT) calculations of the coupling as implemented in Quantum Espresso. QE_ ; Giannozzi et al. (2009) The underlying idea is to explore a hydrogen-free system similar to H3S; Li-S is a natural choice, because lithium belongs to the same group as hydrogen (similar chemical properties) and has a small atomic mass (large phonon frequencies). At ambient pressure, Li-S is stable in crystalline form in the Li2S composition; this compound has applications in lithium-based batteries, and has been investigated by several authors. Grzechnik et al. (2000); Lazicki et al. (2006) We find that at high pressures several new phases are stabilized, many of which behave quite differently from the corresponding hydrides; in particular, superconductivity is harder to attain, and the typical ’s are much lower. We will show that this can be explained by the different chemistry of the two elements, caused by the presence or absence of core electrons. Naumov et al. (2015)
In fact, lithium passes through a sequence of transitions under pressure from close-packed, metallic structures to open, semi-metallic or semiconducting ones. Hanfland et al. (2000); Shi and Papaconstantopoulos (2006); Christensen and Novikov (2006); Marqués et al. (2011a) The increasing covalency is induced by the growing - hybridization, and is accompanied by the characteristic phenomenon of interstitial charge localization, i.e. the electronic valence charge tends to localize in interstitial regions of the crystal to minimize the overlap with underlying atomic core states (avoided core overlap). Rousseau and Ashcroft (2008); Marqués et al. (2009); Gatti et al. (2010); Marqués et al. (2011b); Xie et al. (2010) Hydrogen, whose valence electrons have no underlying core and are well separated in energy from 2 states, has a completely different behavior, transforming from molecular, insulating to close-packed metallic structures at very high pressures. Pickard and Needs (2007) The highest ’s in the two elements range from 16 K, measured in lithium at 100 GPa, Yao et al. (2009); Profeta et al. (2006) to K predicted for hydrogen in the metallic phase. Ashcroft (1968); Cudazzo et al. (2008); McMahon and Ceperley (2011); Borinaga et al. (2016)
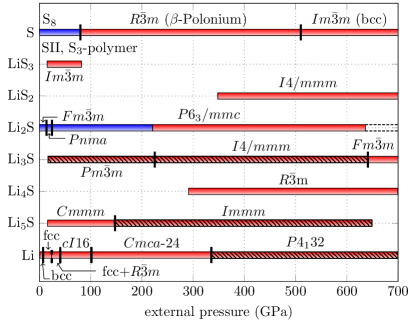
Figure 1 shows our theoretical phase diagram for the Li-S system, constructed with a four-step procedure. (i) First, we performed a preliminary scan of the phase space, with variable-compositions evolutionary algorithm (EA) runs from 0 to 600 GPa at 50 GPa intervals. (ii) For the most promising phases, i.e. those which lie on the convex hull, we ran additional calculations at fixed compositions with 100 GPa intervals starting from 0 GPa to identify thermodynamically stable phases. (iii) The best three structures from each fixed composition run were relaxed once more with stricter convergence parameters, to ensure the correct enthalpy hierarchy of the phases. (iv) The best individuals were relaxed further with a tighter convergence threshold, at pressure intervals of 50-100 GPa, and the resulting energy vs. volume curves were then fitted to a Murnaghan equation of state. Murnaghan (1944) This allowed us to obtain analytical expressions for the enthalpy vs. pressure relation for all structures, from which we could extract accurate stability ranges for all phases. USP ; PD_
Note that, in order to maintain our search within a reasonable time limit, we restricted the search space to phases with a maximum of 24 atoms per unit cell and 6 atoms per formula unit ().
Before discussing the new phases found in our EA search, we note that our calculations reproduce accurately literature results for the known phases, that is, for the two end members and Li2S. For elemental lithium, we find essentially the same phase diagram as Ref. Ma et al., 2008, i.e. we predict a transition from a to a phase and then into a phase, stable until 100 GPa. Hanfland et al. (2000) At 100 GPa, a phase with 24 atoms is stabilized, and remains the lowest in enthalpy up to 330 GPa, where a simple cubic (P4132) phase occurs. Our results are in very good agreement with previous works which employ unit cells up to 24 atoms, Shi and Papaconstantopoulos (2006); Christensen and Novikov (2006) while recent calculations with larger supercells predicted two additional phases between 60 and 270 GPa – Aba2-40 (40 atoms per cell) and Cmca-56 (56 atoms per cell). Having verified that the enthalpy differences with respect to the Cmca-24 phases are minimal and do not affect the calculated convex hull, we decided to use the Cmca-24 phase in the whole range. For sulfur, we predict a transition from the S8 phase to the polymeric S-II (2 GPa) and S3-polymer (20 GPa) phases. Oganov and Glass (2006a) At 80 GPa, the S3-polymer phase transforms into the -Po phase, which is metallic. At very large pressures (510 GPa) we predict a transition to a standard phase, as in Ref. Zakharov and Cohen, 1995. In agreement with previous calculations, and despite several attempts, we did not find any indication of a phase as seen by experiments between 83 and 162 GPa. Degtyareva et al. (2005) For Li2S, we correctly predict a transition from the antifluorite structure () at ambient pressure to the anticotunnite structure at 13 Gpa. At pressures higher than 26 GPa, a Ni2In-type structure (), shown in Fig. 2, becomes stable; similar transition sequences are observed in other alkali-metal sulfides as Na2S and K2S, Vegas et al. (2001, 2002) as well as in the closely related compound Li2O. Lazicki et al. (2006) The phase remains insulating up to 221 GPa, where an insulator-to-metal transition takes place; we find that this phase remains stable up to the highest pressure we calculated.
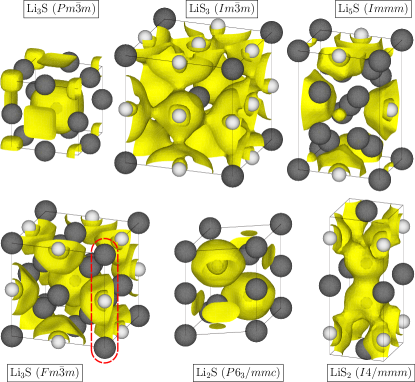
For pressures higher than 20 GPa, several new compositions are stabilized; the relative structures are detailed in the supplementary material (SM), SM together with band structure plots and results of DFPT calculations. Figure 2 only shows those relevant to our discussion, decorated with isosurfaces of the electronic localization function (ELF). We start the discussion from the Li-rich side: The Li5S composition becomes stable at 15 GPa, in an orthorombic structure, with 12 atoms in the unit cell. This is a very open and weakly metallic structure. At 130 GPa, Li5S transforms to a more densely packed phase, shown in the first row of Fig. 2. The new phase shows signatures of interstitial charge localization around the center of the tetragonal faces. The Li4S stoichiometry is stabilized only at extreme pressures (P > 290 GPa); the lowest-enthalpy structure is trigonal, with 10 atoms in the unit cell. Due to the low symmetry and poorly metallic behavior, we do not investigate this structure any further, but keep it in the convex hull because it has a strong infuence on the stability of other phases.
Li3S is of particular interest, as it has the same stoichiometry as high- H3S. Its stability ranges from 20 GPa up to the highest pressure investigated. The lowest-enthalpy structure at 20 GPa, shown in the top left corner of Fig. 2, has space group. Sulfur occupies the positions at the center of the cube, and lithium the positions at the middle of the edges. Around the cube corners, there are large regions of empty space; the ELF isocontours show that a substantial fraction of charge tends to localize in these regions. Above 220 GPa, the simple cubic structure is destabilized towards an variant, with three in the unit cell, in which three cubic cells are stacked along one of the cubic axes, with a small in-plane mismatch. Except for the different stacking, the interatomic distances and interstitial charge localization are very similar to the phase. At 640 GPa, the simple cubic arrangement is finally destabilized towards a completely different phase, with space group , shown in the bottom left corner of Fig. 2. This structure, which has been reported at high pressures for Li3N Lazicki et al. (2005) is very closely packed. In this case, the ELF shows that the valence charge, which can no longer occupy the interstitial regions rearranges and Li forms strong bonds with its second nearest neighbor S along the direction, indicated by the red, dashed line in Fig. 2. As we will show in the following, the suppression of interstitial charge localization in -Li3S is the reason this structure is the only high- superconducting phase of our study. The two S-rich phases (LiS2 and LiS3) have very different structures and stability ranges. LiS3 crystallizes in the same 3̄ structure as H3S, with S occupying the Wyckoff positions of hydrogen, and Li the of S; this phase, shown in the middle of the first row in Fig. 2, is thermodynamically stable only between 20 and 80 GPa. LiS2 crystallizes in an crystal structure, with two – middle of lower row in Fig. 2 – which is metallic and lies on the convex hull at pressures larger than 350 GPa. Both phases are superconducting with moderate ’s.
Our precedent study shows that there are fundamentally three pressure regimes in the high-pressure phase diagram of the Li-S system in Fig. 1: (a) a low-pressure regime (P < 15 GPa), where Li2S is the only stable composition; (b) an intermediate regime (P < 200 GPa), where new stoichiometries are stabilized; some of the new phases, such as LiS3, disappear at higher pressures, while others remain; and (c) a high-pressure regime, where new phases appear again. With the exception of Li2S below 221 GPa, we identified all new phases as metallic, which leaves us with an extremely large pool of potential high- conventional superconductors.
For a given crystal structure and chemical composition, the superconducting due to interaction can be estimated through the Mc-Millan-Allen-Dynes formula:
| (1) |
Here, is the Boltzmann constant and is the Coulomb pseudopotential. The coupling constant and the logarithmic average phonon frequency are obtained from the Eliashberg spectral function for the interaction , calculated within DFPT: QE_
| (2) |
as: ; . In Eq. 2, is the density of states (DOS) at the Fermi level, is the phonon frequency of mode and wavevector and is the electron-phonon matrix element between two electronic states with momenta and at the Fermi level. Carbotte (1990); Allen and Mitrović (1983)
Since coupling calculations in DFPT are computationally much more demanding than electronic structure calculations, we could not afford a full scan of the phase space at all pressures and compositions. Instead, we selected two pressures, 100 and 500 GPa, representative of the intermediate and high-pressure regimes respectively, and performed calculations for all phases which are stable at these pressures or in their immediate vicinity.
| comp. | () | |||||
| Li3S () | 100 | 754 | 0.08 | 0.0 | 0.62 | 0.13 |
| LiS3 () | 100 | 409 | 0.52 | 5.4 | 1.45 | 0.36 |
| Li () | 500 | 546 | 0.40 | 2.2 | 0.25 | 1.64 |
| Li () | 500 | 420 | 0.53 | 8.6 | 0.48 | 1.10 |
| Li3S () | 500 | 702 | 0.25 | 0.0 | 0.67 | 0.37 |
| Li3S () | 500 | 773 | 1.43 | 80.0 | 1.67 | 0.85 |
| Li3S () | 600 | 826 | 1.01 | 55.9 | 1.30 | 0.78 |
| Li2S () | 500 | 374 | 0.22 | 0.0 | 0.27 | 0.85 |
| LiS2 () | 500 | 494 | 0.54 | 7.6 | 1.35 | 0.40 |
| H3S () | 200 | 1200 | 2.40 | 180 | 1.83 | 1.31 |
| Li3SH () | 500 | 1156 | 1.43 | 169 | 1.67 | 0.86 |
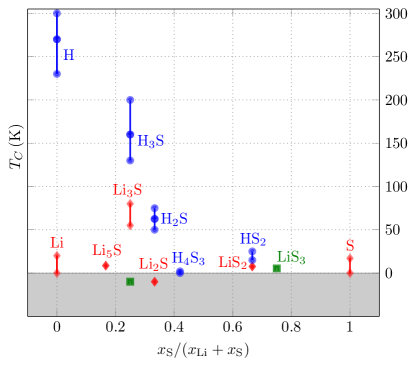
The calculated values of are plotted in Fig. 3, as green (100 GPa) and red (500 GPa) symbols. Literature values for different sulfur hydrides from Ref. Li et al. (2016) are shown as blue symbols on the same scale; the error bars indicate pressure variations of , when known. To give a visual impression of the presence or absence of superconductivity, ’s smaller than 0.5 K are shown as negative. Table 1 reports the corresponding values of and . Since we could not find any literature values, we calculated also data for the P phase of Li at 500 GPa.
Figure 3 shows that only a few Li-S phases display a finite , and a single phase – i.e. the high-pressure phase of Li3S – displays a critical temperature comparable to that of hydrides. Furthermore, two of the phases with a finite , LiS3 and LiS2, are S-rich phases, in which the coupling is dominated by the sulfur sublattice, and thus not directly related to hydrides. Other Li-rich phases, including elemental Li, exhibit ’s lower than 20 K. The contrast with the corresponding hydrides is striking: for some compositions the differences in are as large as two orders of magnitude. This suggests a fundamental difference between hydrogen- and lithium-rich compounds that we will investigate based on Eq. 1 and Tab. 1.
First, the higher atomic mass of lithium implies a smaller prefactor in Eq. 1: to a first approximation, the reduction can be estimated as: . For most cases reported in Tab. 1, this is clearly not the dominating effect. The single notable exception is -Li3S, which is the only truly high- phase identified in our study - its is 80 K at 500 GPa, and decreases to 55 K in its stability range. If we take into account the mass effect, the is comparable to that of H3S. To prove that, we performed a calculation in which we replaced the Li mass with that of hydrogen; this phase is indicated as Li3SH in the table. The calculated is 170 K, i.e., comparable to that of H3S. We want to note, however, that the pressure needed to stabilize a high- phase in this case is almost three times larger as in the hydrides. We will discuss this point further in the following.
Table 1 shows that, with the exception of -Li3S, where , all Li-S phases have small, or at best intermediate coupling constants (). The simplified Hopfield expression: , where is an average matrix element and is an average lattice force constant permits to separate the coupling into a purely electronic contribution given by the DOS and a factor , related to the lattice. Values of , i.e. DOS per atom, and for all Li-S phases in Fig. 3 are reported in Tab. 1.
First of all, we notice that in three high-pressure phases, simple cubic Li, Li5S and Li2S, is suppressed by an extremely low . For Li and Li5S, the poor metallic behavior is a consequence of 2-2 hybridization; Li2S is instead a semiconducting phase which has metallized by band overlap, and its DOS is intrinsically low. In the two sulfur-rich phases – LiS2 and LiS3 – the coupling is moderate () and the DOS is sizable; due to the high sulfur content the characteristic phonon frequencies and ’s are relatively low.
Interestingly, for Li3S we observe a striking difference between the simple cubic () low-P and the high-P structures: The phase has an extremely low in its stability range, which increases slightly at 500 GPa (), where it is still dynamically stable; both values yield negligible ’s. The high- phase, instead, exhibits a very high coupling () at 500 GPa and at higher pressures (600 GPa); the corresponding ’s are large.
Table 1 shows that in this case, besides the DOS, there is a remarkable difference in the lattice contribution to the coupling, , between the low and high-pressure phases. This is due to the different nature of electronic states involved in the superconducting pairing in the two structures. In fact, the double- integral in Eq. 2 implies that the only electronic states, which give a finite contribution to the coupling are those that are at . If these states have a large intrinsic coupling to phonons, as in covalently-bonded solids, , and thus , are large. Bernstein et al. (2015); Heil and Boeri (2015); Boeri et al. (2004) On the contrary, interstitial electrons, which are localized in empty regions of the crystal structure, couple very little to lattice vibrations, and hence and will be low.
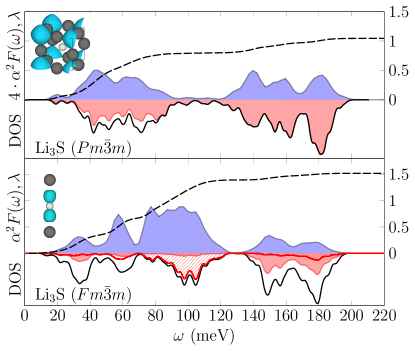
Figure 4 illustrates how the superconducting properties of – and –Li3S differ due to matrix elements effects. The two main panels show the Eliashberg spectral functions and partial phonon DOS’s calculated for both phases at 500 GPa: the two spectra extend up to 180 meV, but the intensity and spectral distribution of the coupling is crucially different. Note that for better readability of the figure, and of –Li3S are multiplied by four. –Li3S has an extremly uniform (and low) coupling, while –Li3S shows a strong enhancement in the spectral region which corresponds to modes that distort the long Li-S bonds in the direction. In the small insets we plot isocontours of the square of the wavefunctions for the electronic states at the Fermi level – see SM for the definition. SM In –Li3S, these are localized in the interstitial region, i.e. around the corners of the cube. In –Li3S, on the other hand, they are localized along the edges of the cube, i.e. along the long Li-S bonds, indicated by the red dashed lines in Fig. 2. The different nature of the electronic states leads to a factor of increase in ; the difference in is even larger.
We thus find that interstitial charge localization due to avoided core overlap can be a fundamental limiting factor for conventional superconductivity. This feature is very common in many alkali-metal-rich phases, including several new Li-S phases of this study, indicated by dashed areas in in Fig. 1. When, as in –Li3S, the electron count is such that interstitial charge localization involve electrons at , the coupling is strongly suppressed.
In conclusion, in this work we studied the thermodynamic stability and superconducting properties of the Li-S system up to 700 GPa, using methods for ab-initio crystal structure prediction and linear response calculations of the coupling. The calculated convex hulls show that several compositions besides the ambient pressure Li2S are stabilized with increasing pressure. Most of these phases are metallic, but exhibit no or low- superconductivity. We attribute this to two detrimental effects of core electrons in lithium: (i) an increased insulating behavior under pressure, due to hybridization between 2 and 2 electronic states; and (ii) interstitial charge localization due to avoided core overlap, which can bring states to the Fermi level that are intrinsically not coupled to lattice vibrations. This is observed for example in Li3S, where a high- (55-80 K) phase appears only at pressures high enough to stabilize closed packed structures (> 600 GPa). Our study thus shows that high- superconductivity at megabar pressures can be attained in Li-rich compounds, similarly to hydrides, but a general tendency to insulating behavior and avoided core overlap will limit the possible range of pressures and dopings.
Acknowledgements.
The authors acknowledge computational resources from the dCluster of the Graz University of Technology and the VSC3 of the Vienna University of Technology.References
- Drozdov et al. (2015a) A. P. Drozdov, M. I. Eremets, I. A. Troyan, V. Ksenofontov, and S. I. Shylin, Nature 000, 2015/08/17/online (2015a).
- Troyan et al. (2016) I. Troyan, A. Gavriliuk, R. Rüffer, A. Chumakov, A. Mironovich, I. Lyubutin, D. Perekalin, A. P. Drozdov, and M. I. Eremets, Science 351, 1303 (2016), http://science.sciencemag.org/content/351/6279/1303.full.pdf .
- Duan et al. (2014) D. Duan, Y. Liu, F. Tian, D. Li, X. Huang, Z. Zhao, H. Yu, B. Liu, W. Tian, and T. Cui, Sci. Rep. 4 (2014), http://dx.doi.org/10.1038/srep06968.
- Bernstein et al. (2015) N. Bernstein, C. S. Hellberg, M. D. Johannes, I. I. Mazin, and M. J. Mehl, Phys. Rev. B 91, 060511 (2015).
- Heil and Boeri (2015) C. Heil and L. Boeri, Phys. Rev. B 92, 060508 (2015).
- Flores-Livas, José et al. (2016) Flores-Livas, José, Sanna, Antonio, and Gross, E. K.U., Eur. Phys. J. B 89, 63 (2016).
- Quan and Pickett (2016) Y. Quan and W. E. Pickett, Phys. Rev. B 93, 104526 (2016).
- Li et al. (2014) Y. Li, J. Hao, H. Liu, Y. Li, and Y. Ma, The Journal of Chemical Physics 140, (2014).
- Papaconstantopoulos et al. (2015) D. A. Papaconstantopoulos, B. M. Klein, M. J. Mehl, and W. E. Pickett, Phys. Rev. B 91, 184511 (2015).
- Luciano et al. (2015) O. Luciano, E. Cappelluti, and L. Pietronero, (2015), arXiv: 1511.04304.
- Errea et al. (2015) I. Errea, M. Calandra, C. J. Pickard, J. Nelson, R. J. Needs, Y. Li, H. Liu, Y. Zhang, Y. Ma, and F. Mauri, Phys. Rev. Lett. 114, 157004 (2015).
- Drozdov et al. (2015b) A. Drozdov, M. I. Eremets, and I. A. Troyan, ArXiv e-prints (2015b), arXiv:1508.06224 [cond-mat.supr-con] .
- Shamp et al. (2016) A. Shamp, T. Terpstra, T. Bi, Z. Falls, P. Avery, and E. Zurek, Journal of the American Chemical Society 138, 1884 (2016), pMID: 26777416, http://dx.doi.org/10.1021/jacs.5b10180 .
- Flores-Livas et al. (2016) J. A. Flores-Livas, M. Amsler, C. Heil, A. Sanna, L. Boeri, G. Profeta, C. Wolverton, S. Goedecker, and E. K. U. Gross, Phys. Rev. B 93, 020508 (2016).
- Fu et al. (2016) Y. Fu, X. Du, L. Zhang, F. Peng, M. Zhang, C. J. Pickard, R. J. Needs, D. J. Singh, W. Zheng, and Y. Ma, Chemistry of Materials 28, 1746 (2016), http://dx.doi.org/10.1021/acs.chemmater.5b04638 .
- Ashcroft (1968) N. Ashcroft, Phys. Rev. Lett. 21, 1748 (1968).
- Cudazzo et al. (2008) P. Cudazzo, G. Profeta, A. Sanna, A. Floris, A. Continenza, S. Massidda, and E. Gross, Phys. Rev. Lett. 100, 257001 (2008).
- McMahon and Ceperley (2011) J. M. McMahon and D. M. Ceperley, Phys. Rev. B 84, 144515 (2011).
- Borinaga et al. (2016) M. Borinaga, I. Errea, M. Calandra, F. Mauri, and A. Bergara, ArXiv e-prints (2016), arXiv:1602.06877 [cond-mat.supr-con] .
- Szczȩs̀niak and Jarosik (2009) R. Szczȩs̀niak and M. Jarosik, Solid State Communications 149, 2053 (2009).
- M.I. Eremets (2016) A. D. M.I. Eremets, I.A. Troyan, ArXiv e-prints (2016), arXiv:1601.04479 [cond-mat.supr-con] .
- Dalladay-Simpson (2016) E. G. Dalladay-Simpson, R. T. Howie, Nature 529, 63 (2016).
- Ashcroft (2004) N. Ashcroft, Phys. Rev. Lett. 92, 187002 (2004).
- Tse et al. (2007) J. S. Tse, Y. Yao, and K. Tanaka, Phy. Rev. Lett. 98, 117004 (2007).
- Gao et al. (2010) G. Gao, A. R. Oganov, P. Li, Z. Li, H. Wang, T. Cui, Y. Ma, A. Bergara, A. O. Lyakhov, T. Iitaka, and G. Zou, Proceedings of the National Academy of Sciences 107, 1317 (2010).
- Kim et al. (2010) D. Y. Kim, R. H. Scheicher, H.-k. Mao, T. W. Kang, and R. Ahuja, PNAS 107, 2793 (2010).
- Yao and Klug (2010) Y. Yao and D. D. Klug, Proceedings of the National Academy of Sciences 107, 20893 (2010).
- Flores-Livas et al. (2012) J. A. Flores-Livas, M. Amsler, T. J. Lenosky, L. Lehtovaara, S. Botti, M. A. L. Marques, and S. Goedecker, Phys. Rev. Lett. 108, 117004 (2012).
- (29) A. Oganov, C. Glass, A. Lyakhov, H. Stokes, Q. Zhu, R. Agarwal, X. Dong, P. Pertierra, Z. Raza, M. Salvado, et al., .
- (30) For selected phases we calculated the properties using DFPT, as implemented in Quantum espresso. Giannozzi et al. (2009). We employed PBE ultrasoft pseudopotentials with semicore states in valence for lithium and sulfur from the standard Quantum espresso distribution, with energy cutoffs of 80 and 800 Ry for wavefunctions and charge density, respectively. We used - and -points meshes for reciprocal space integration for electron and phonon states in the self-consistent calculations, and up to 383 -points for the matrix elements.
- Giannozzi et al. (2009) P. Giannozzi, S. Baroni, N. Bonini, M. Calandra, R. Car, C. Cavazzoni, D. Ceresoli, G. L. Chiarotti, M. Cococcioni, I. Dabo, A. Dal Corso, S. de Gironcoli, S. Fabris, G. Fratesi, R. Gebauer, U. Gerstmann, C. Gougoussis, A. Kokalj, M. Lazzeri, L. Martin-Samos, N. Marzari, F. Mauri, R. Mazzarello, S. Paolini, A. Pasquarello, L. Paulatto, C. Sbraccia, S. Scandolo, G. Sclauzero, A. P. Seitsonen, A. Smogunov, P. Umari, and R. M. Wentzcovitch, Journal of Physics: Condensed Matter 21, 395502 (19pp) (2009).
- Grzechnik et al. (2000) A. Grzechnik, A. Vegas, K. Syassen, I. Loa, M. Hanfland, and M. Jansen, Journal of Solid State Chemistry 154, 603 (2000).
- Lazicki et al. (2006) A. Lazicki, C.-S. Yoo, W. J. Evans, and W. E. Pickett, Phys. Rev. B 73, 184120 (2006).
- Naumov et al. (2015) I. I. Naumov, R. J. Hemley, R. Hoffmann, and N. Ashcroft, The Journal of chemical physics 143, 064702 (2015).
- Hanfland et al. (2000) M. Hanfland, K. Syassen, N. Christensen, and D. Novikov, Nature 408, 174 (2000).
- Shi and Papaconstantopoulos (2006) L. Shi and D. A. Papaconstantopoulos, Physical Review B 73, 184516 (2006).
- Christensen and Novikov (2006) N. Christensen and D. Novikov, Physical Review B 73, 224508 (2006).
- Marqués et al. (2011a) M. Marqués, M. I. McMahon, E. Gregoryanz, M. Hanfland, C. L. Guillaume, C. J. Pickard, G. J. Ackland, and R. J. Nelmes, Phys. Rev. Lett. 106, 095502 (2011a).
- Rousseau and Ashcroft (2008) B. Rousseau and N. W. Ashcroft, Phys. Rev. Lett. 101, 046407 (2008).
- Marqués et al. (2009) M. Marqués, G. J. Ackland, L. F. Lundegaard, G. Stinton, R. J. Nelmes, M. I. McMahon, and J. Contreras-García, Phys. Rev. Lett. 103, 115501 (2009).
- Gatti et al. (2010) M. Gatti, I. V. Tokatly, and A. Rubio, Phys. Rev. Lett. 104, 216404 (2010).
- Marqués et al. (2011b) M. Marqués, M. I. McMahon, E. Gregoryanz, M. Hanfland, C. L. Guillaume, C. J. Pickard, G. J. Ackland, and R. J. Nelmes, Phys. Rev. Lett. 106, 095502 (2011b).
- Xie et al. (2010) Y. Xie, A. R. Oganov, and Y. Ma, Phys. Rev. Lett. 104, 177005 (2010).
- Pickard and Needs (2007) C. J. Pickard and R. J. Needs, Nat Phys 3, 473 (2007).
- Yao et al. (2009) Y. Yao, J. Tse, K. Tanaka, F. Marsiglio, and Y. Ma, Physical Review B 79, 054524 (2009).
- Profeta et al. (2006) G. Profeta, C. Franchini, N. Lathiotakis, A. Floris, A. Sanna, M. A. L. Marques, M. Lüders, S. Massidda, E. K. U. Gross, and A. Continenza, Phys. Rev. Lett. 96, 047003 (2006).
- Murnaghan (1944) F. Murnaghan, Proceedings of the National Academy of Sciences 30, 244 (1944).
- (48) We explored the Li-S system using the technique of ab-initio evolutionary crystal structure prediction as implemented in the USPEX-package. Oganov and Glass (2006b); Lyakhov et al. (2013); Oganov et al. (2011) The underlying structural relaxations were performed using the VASP code, Kresse and Hafner (1993); Kresse and Furthmüller (1996) within the generalized gradient approximation. Perdew et al. (1996) We used the all-electron projector-augmented wave method. Kresse and Joubert (1999); Blöchl (1994) To avoid core overlap at high pressures in Li, we treated the 1s and 2s electrons as valence. Individual structures generated by the evolutionary algorithms were relaxed with increasing precision in a 5-step procedure; the energies were finally recalculated with increasing convergence criteria to ensure a correct ranking of the structure.
- (49) For all evolutionary runs, we limited trapping in local minima by repeating simulations at selected pressures and using the antiseeds-technique described in Ref. Oganov et al. . To ensure a reliable ranking of the structures, we performed extensive convergence checks of the total energy and forces with respect to cut-off energy and k-point resolution; for variable and fixed composition runs we used energy cut-offs up to 700 up to 800 eV, and a k-point resolution of 0.06 to obtain a first rough approximation of the enthalpies; for the final enthalpy vs. pressure curves, we increased these values up to 1100 to 1200 eV and Monkhorst-Pack k-point meshes for sampling the Brilloin-zone with resolution of 0.03 , which ensured a convergence of forces up to 1 meV/atom.
- Ma et al. (2008) Y. Ma, A. R. Oganov, and Y. Xie, Physical Review B 78, 014102 (2008).
- Oganov and Glass (2006a) A. R. Oganov and C. W. Glass, The Journal of Chemical Physics 124, 244704 (2006a), http://dx.doi.org/10.1063/1.2210932.
- Zakharov and Cohen (1995) O. Zakharov and M. L. Cohen, Physical Review B 52, 12572 (1995).
- Degtyareva et al. (2005) O. Degtyareva, E. Gregoryanz, M. Somayazulu, H.-k. Mao, and R. J. Hemley, Physical Review B 71, 214104 (2005).
- Vegas et al. (2001) A. Vegas, A. Grzechnik, K. Syassen, I. Loa, M. Hanfland, and M. Jansen, Acta Crystallographica Section B: Structural Science 57, 151 (2001).
- Vegas et al. (2002) A. Vegas, A. Grzechnik, M. Hanfland, C. Mühle, and M. Jansen, Solid state sciences 4, 1077 (2002).
- (56) Supplementary Material for this article is available online under…
- Lazicki et al. (2005) A. Lazicki, B. Maddox, W. J. Evans, C.-S. Yoo, A. K. McMahan, W. E. Pickett, R. T. Scalettar, M. Y. Hu, and P. Chow, Phys. Rev. Lett. 95, 165503 (2005).
- Carbotte (1990) J. P. Carbotte, Rev. Mod. Phys. 62, 1027 (1990).
- Allen and Mitrović (1983) P. B. Allen and B. Mitrović, Theory of Superconducting Tc, Solid State Physics, Vol. 37 (Academic Press, 1983) pp. 1 – 92.
- Li et al. (2016) Y. Li, L. Wang, H. Liu, Y. Zhang, J. Hao, C. J. Pickard, J. R. Nelson, R. J. Needs, W. Li, Y. Huang, I. Errea, M. Calandra, F. Mauri, and Y. Ma, Phys. Rev. B 93, 020103 (2016).
- Akashi et al. (2016) R. Akashi, W. Sano, R. Arita, and S. Tsuneyuki, ArXiv e-prints (2016), arXiv:1512.06680 [cond-mat.supr-con] .
- Boeri et al. (2004) L. Boeri, J. Kortus, and O. K. Andersen, Phys. Rev. Lett. 93, 237002 (2004).
- Oganov and Glass (2006b) A. R. Oganov and C. W. Glass, The Journal of chemical physics 124, 244704 (2006b).
- Lyakhov et al. (2013) A. O. Lyakhov, A. R. Oganov, H. T. Stokes, and Q. Zhu, Computer Physics Communications 184, 1172 (2013).
- Oganov et al. (2011) A. R. Oganov, A. O. Lyakhov, and M. Valle, Accounts of chemical research 44, 227 (2011).
- Kresse and Hafner (1993) G. Kresse and J. Hafner, Physical Review B 47, 558 (1993).
- Kresse and Furthmüller (1996) G. Kresse and J. Furthmüller, Computational Materials Science 6, 15 (1996).
- Perdew et al. (1996) J. P. Perdew, K. Burke, and M. Ernzerhof, Physical review letters 77, 3865 (1996).
- Kresse and Joubert (1999) G. Kresse and D. Joubert, Physical Review B 59, 1758 (1999).
- Blöchl (1994) P. E. Blöchl, Physical Review B 50, 17953 (1994).