Mid-infrared dust in two nearby radio galaxies, NGC 1316 (Fornax A) and NGC 612 (PKS 0131-36)
Abstract
Context. Most radio galaxies are hosted by giant gas-poor ellipticals, but some contain significant amounts of dust, which is likely to be of external origin.
Aims. In order to characterize the mid-IR properties of two of the most nearby and brightest merger-remnant radio galaxies of the Southern hemisphere, NGC 1316 (Fornax A) and NGC 612 (PKS 0131–36), we used observations with the Wide-field Infrared Survey Explorer (WISE) at wavelengths of 3.4, 4.6, 12 and 22 m and Spitzer mid-infrared spectra.
Methods. By applying a resolution-enhancement technique, new WISE images were produced at angular resolutions ranging from to . Global measurements were performed in the four WISE bands, and stellar masses and star-formation rates were estimated using published scaling relations. Two methods were used to uncover the distribution of dust, one relying on two-dimensional fits to the 3.4 m images to model the starlight, and the other one using a simple scaling and subtraction of the 3.4 m images to estimate the stellar continuum contribution to the emission in the 12 and 22 m bands.
Results. The two galaxies differ markedly in their mid-IR properties. The 3.4 m brightness distribution can be well represented by the superposition of two Sérsic models in NGC 1316 and by a Sérsic model and an exponential disk in NGC 612. The WISE colors of NGC 1316 are typical of those of early-type galaxies; those of NGC 612 are in the range found for star-forming galaxies. From the 22 m luminosity, we infer a star-formation rate of yr-1 in NGC 1316 and yr-1 in NGC 612. Spitzer spectroscopy shows that the 7.7-to-11.3 m PAH line ratio is significantly lower in NGC 1316 than in NGC 612. The WISE images reveal resolved emission from dust in the central 1′–2′ of the galaxies. In NGC 1316, the extra-nuclear emission coincides with two dusty regions NW and SE of the nucleus seen in extinction in optical images and where molecular gas is known to reside. In NGC 612 it comes from a warped disk. This suggests a recent infall onto NGC 1316 and disruption of one or several smaller gas-rich galaxies, but a smoother accretion in NGC 612. While the nucleus of NGC 1316 is currently dormant and the galaxy is likely to evolve into a passive elliptical, NGC 612 has the potential of growing a larger disk and sustaining an active nucleus.
Conclusions. NGC 1316 and NGC 612 represent interesting challenges to models of formation and evolution of galaxies and AGNs.
Key Words.:
Galaxies: individual: NGC 1316 – Galaxies: individual: NGC 612 – Galaxies: ISM – Galaxies: interactions – Infrared: galaxies1 Introduction
Powerful radio galaxies are living evidence of relatively recent activity in the nuclei of their host galaxies. The characteristic timescale for ejected plasma to reach the outer radio lobes, located some hundreds of kpc away from the center, is a few tens to hundreds of Myr. Most observations are consistent with the scenario that radio lobes can be triggered during the merger of two gas-rich galaxies, a process that also results in the formation of a large elliptical galaxy with a supermassive black hole (e.g. Barnes & Hernquist 1991, Treister et al. 2012). Most radio galaxies are hosted by gas-poor giant elliptical galaxies, but some contain significant amounts of gas and dust in their central regions; this material is likely of external origin, injected during the more recent infall of low-mass gas-rich galaxies onto the giant elliptical. At intermediate redshift (), the median dust mass of bright radio galaxies is , which is about twice as large as in the Large Magellanic Cloud but about four times lower than in the Milky Way (Tadhunter et al., 2014). The spread in dust mass in that sample is however very large (more than two orders of magnitudes), which probably reflects the large range in the total mass and morphological type of the progenitors.
Whereas mergers might be a necessary condition for an Active Galactic Nucleus (AGN) and the ejection of radio lobes, it is clearly not sufficient: only a fraction of elliptical galaxies with signs of merging activity and recent star formation are radio-loud (Ramos Almeida et al., 2012). The temperature of the gas fueling the AGN (either hot and associated with the surrounding X-ray gas, or cold and associated with atomic or molecular gas) probably plays a role in the level of activity of the nucleus (Hardcastle et al., 2007).
An interesting recent development is the increasing number of radio galaxies found associated with disk-like galaxies (e.g. Hurley-Walker et al. 2015, Singh et al. 2015). Those galaxies, although very rare, challenge the standard model of radio galaxy formation. Some of them (Centaurus A and Fornax A) are giant ellipticals with dust lanes oriented along the minor axis; others have a clear disk seen edge-on (e.g. NGC 612, Ekers et al. 1978; 2MASX J03155208-1906442, Ledlow et al. 2001; Speca, Hota et al. 2011; J2345-0449, Bagchi et al. 2014; NGC 1534, Hurley-Walker et al. 2015). It is likely that the latter have had a quieter secular evolution, possibly via slow accretion rather than mergers, to allow the disk to grow and gain angular momentum at the same time as the central black hole increased its mass. Simulations indicate that the angular momentum of the gas when it enters a halo is an important factor for the subsequent accretion by the black hole (Bellovary et al., 2013).
Clearly, the central regions of the hosts of radio galaxies contain valuable information about their recent history. Mid-IR imaging provides additional information on the AGN, stars, and interstellar medium and permits investigation of their inter-relation. Data taken by the Wide-field Infrared Survey Explorer (WISE; Wright et al. 2010) are well suited for that purpose. The short wavelength WISE bands, and , are dominated by emission from an evolved stellar population, while the and bands primarily capture emission from warm dust ( K), potentially at least partially heated by an AGN (see Jarrett et al., 2011). Polycyclic aromatic hydrocarbon (PAHs) molecular features at 11.3 and 12.7 m and nebular [NeII] line emission at 12.8 m may also contribute to the flux in the band. At low redshifts, the band is mostly free from emission lines and traces warm dust and possible AGN.
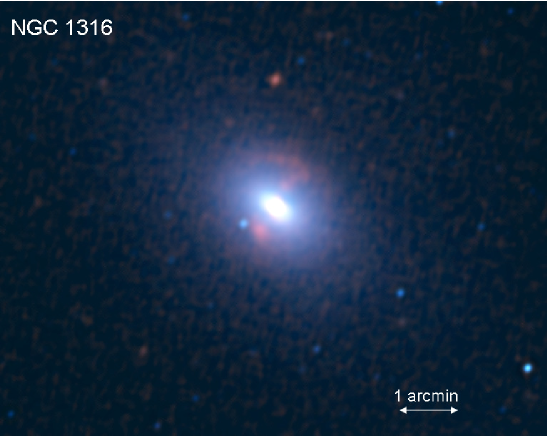
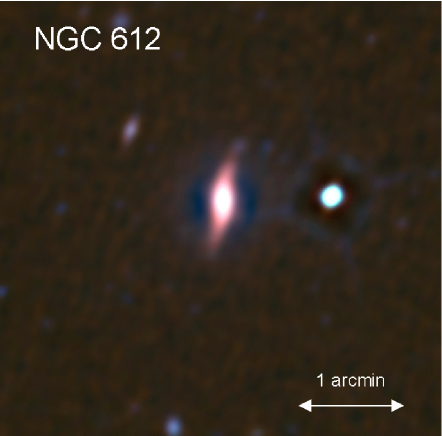
In this paper, we analyze WISE mid-IR images of NGC 1316 (Fornax A) and NGC 612, two prominent nearby examples of dusty radio galaxies in the Southern hemisphere. Whereas the two galaxies are rather similar in their radio properties, with bright radio lobes extending out to large distances from the galaxies’ centers (about 150 kpc on the sky for NGC 1316 and 250 kpc for NGC 612), they are very different in the optical (see Fig. 1). NGC 612, of morphological type SA0+ pec (de Vaucouleurs et al., 1991), possesses a dusty stellar disk with a young stellar population (Holt et al., 2007), which is very unusual for a radio galaxy (Ekers et al. 1978, Véron-Cetty & Véron 2001). It also possesses an enormous HI disk ( kpc wide, or ; , Emonts et al. 2008). In contrast, NGC 1316, of morphological type SAB(s)00 pec (de Vaucouleurs et al., 1991), is a giant galaxy with outer shells and loops and an irregular dust pattern in the central 2′ (e.g. Schweizer 1980, 1981), and it is poor in atomic gas (, Horellou et al. 2001). Both galaxies contain molecular gas: about in NGC 1316 (Horellou et al. 2001, after correction for our adopted distance; see also Sage & Galletta 1993) and in NGC 612 (Prandoni et al., 2012). NGC 612 has the highest H2 mass in the Prandoni et al. 2012 sample111 The Prandoni et al. (2012) sample was extracted from the flux-density–limited sample of radio galaxies of Ekers et al. (1989) from the Parkes 2.7 GHz survey in the declination range –40∘ to –17∘. It includes NGC 612 and NGC 1316. of 11 nearby () southern early-type radio galaxies. A brief description of the galaxies is given in Sect. 2.
Preliminary results based on lower-resolution WISE images of NGC 1316 were reported by Duah Asabere et al. (2014). The data presented here have been reprocessed in order to achieve a higher angular resolution, as described in Sect. 3. In Sect. 4 the results from our global flux measurements in the four WISE bands are presented. In Sect. 5 archival Spitzer IRS spectra of the central regions of the galaxies are shown and discussed in relation to the WISE observations. Sect. 6 is a description of the models of the galaxies’ starlight that were tested and of the two different methods that were used to separate the contributions of the various components (starlight, AGN, dust) to the mid-IR emission. Since NGC 1316 has been observed with Spitzer at 3.6, 4.5, 5.8, 8 and 24 m (Temi et al. 2005, Lanz et al. 2010), we focus here on the WISE 12 m image. In Sect. 7 the WISE colors and estimates of the stellar masses and star-formation rates are given. Finally, the results and the methods are discussed in Sect. 8.
All magnitudes are quoted in the Vega system.
| Banda𝑎aa𝑎aWISE bands. | Wavelengthb𝑏bb𝑏bCentral wavelengths (taken from Brown et al., 2014). | Resolutionc𝑐cc𝑐cAngular resolution. For comparison, the original single frame WISE images have a diffraction and optics-limited resolution of in the three short-wavelength bands and in the 22 m band (see Jarrett et al., 2012). The enhanced resolution of the WISE images is comparable to that of Spitzer images ( for IRAC and for MIPS-24). | Sensitivityd𝑑dd𝑑dApproximate surface brightnesses (Vega) measured in the NGC 1316 mosaic images. | Sensitivitye𝑒ee𝑒eAs in (d), but in Jy arcsec-2. The pixel size is 0.6875′′ in all four bands. |
|---|---|---|---|---|
| (m) | (arcsec) | (mag arcsec-2) | (Jy arcsec-2) | |
| 3.4 | 2.6 | 23.4 | 0.14 | |
| 4.6 | 3.0 | 22.4 | 0.19 | |
| 12.0 | 3.5 | 18.6 | 1.1 | |
| 22.8 | 5.5 | 16.1 | 2.9 |
2 The galaxies
At a distance333 Several slightly conflicting distance estimates to NGC 1316 have been published (e.g. Feldmeier et al. 2007, Stritzinger et al. 2010, Cantiello et al. 2013). For simplicity, we adopt a distance of 20 Mpc for NGC 1316, consistent with the various estimates given in the NASA Extragalactic Database (NED). At that distance, corresponds to 0.97 kpc. of about 20 Mpc, NGC 1316 (Fornax A, PKS 0320–37, Arp 154) has been abundantly studied. The spectacular dust lanes of NGC 1316 were discussed by Schweizer (1980, 1981) and their detailed structure was revealed in Hubble Space Telescope (HST) images (Grillmair et al. 1999; see also Carlqvist 2010). Some of the molecular gas was found about NW of the center in the region of the dust lane where the central radio jet abruptly stops and may have been deviated (Horellou et al. 2001, Geldzahler & Fomalont 1984).
A remarkable correspondence was found between the HST extinction features and the dust lanes seen in emission in the the Infrared Space Observatory (ISO) 15 m image (Xilouris et al., 2004) and in the Spitzer 8 m image (Temi et al., 2005). In a detailed multi-component analysis of near- and mid-IR Spitzer images, Chandra and XMM-Newton X-ray images, millimeter and radio maps, Lanz et al. (2010) quantified the inter-relations between the central AGN, the inner jet, the surrounding hot gas, and the dust and cool gas likely due to the infall of a gas-rich companion less than Gyr ago (Mackie & Fabbiano 1998). From the analysis of the globular cluster population in NGC 1316, Goudfrooij et al. (2004) estimated that a major merger took place about 3 Gyr ago. NGC 1316 is a member of the SINGS and KINGFISH samples444 SINGS (Spitzer Infrared Nearby Galaxies Survey) and KINGFISH (Key Insights on Nearby Galaxies: A Far-Infrared Survey with Herschel) are samples of 75 and 61 nearby star-forming galaxies that span a wide range of luminosities, optical-to-infrared ratios and morphologies observed with Spitzer and Herschel (Kennicutt et al. 2003a, 2011). . Herschel global flux measurements between 70 and 500 m were reported by Dale et al. (2012), and resolved Herschel maps and APEX-LABOCA 870 m observations were presented by Galametz et al. (2012, 2014). By modeling the spectral energy distribution (SED), Draine et al. (2007) estimated the dust mass of NGC 1316 to be about 2.5 .
As mentioned in the introduction, NGC 612 (PKS 0131–36) possesses a large HI disk and is about ten times richer than NGC 1316 in molecular gas. At 125 Mpc, it is about six times more distant than NGC 1316. At that distance, 10′′ correspond to 6.1 kpc. NGC 612 was detected in the four IRAS bands (Knapp et al. 1989; see also corrections in NED by Knapp 1994), by ISO at 170 m (Stickel et al. 2004) and by Akari (Onaka et al. 2007) at 9 m and 18 m (Ichikawa et al., 2012). NGC 612 can be classified as a luminous infrared galaxy (LIRG) with a luminosity of , whereas NGC 1316 is about 25 times less luminous, (from the relation with the IRAS fluxes given by Sanders & Mirabel 1996 and using the corrected IRAS values in NED).
3 Data analysis
| Band | Flux densitya𝑎aa𝑎aIntegrated flux density. Note that the quoted uncertainties do not include the uncertainty in the absolute calibration, which ranges from 2.4-5.7% depending on the band (see section 4.4h/vii of the WISE All Sky Explanatory Supplement, Cutri et al. 2012). | Magnitudeb𝑏bb𝑏bIntegrated Vega magnitude. | c𝑐cc𝑐c1- isophotal radius or semi-major axis for the aperture photometry. | d𝑑dd𝑑dEffective (half-light) radius. | e𝑒ee𝑒eEffective (half-light) surface brightness. | f𝑓ff𝑓fConcentration index (75% to 25% light ratio). | g𝑔gg𝑔gCentral surface brightness. | hℎhhℎhand | i𝑖ii𝑖iare the position angle and axis ratio of the 3- isophote. |
|---|---|---|---|---|---|---|---|---|---|
| (mJy) | (mag) | (arcsec) | (arcsec) | (mag arcsec-2) | (mag arcsec-2) | (∘) | |||
| 761.1 | 101.3 | 16.61 | 7.66 | 13.58 | 34.7 | 0.65 | |||
| 588.7 | 93.4 | 16.50 | 7.05 | 13.61 | 34.7 | 0.65 | |||
| 188.0 | 62.2 | 14.82 | 5.54 | 12.67 | 34.7 | 0.65 | |||
| 101.6 | 39.5 | 12.73 | 4.79 | 11.98 | 34.7 | 0.65 |
| Band | Flux densitya𝑎aa𝑎afootnotemark: | Magnitudeb𝑏bb𝑏bfootnotemark: | c𝑐cc𝑐cfootnotemark: | d𝑑dd𝑑dfootnotemark: | e𝑒ee𝑒efootnotemark: | f𝑓ff𝑓ffootnotemark: | g𝑔gg𝑔gfootnotemark: | hℎhhℎhfootnotemark: | i𝑖ii𝑖ifootnotemark: |
|---|---|---|---|---|---|---|---|---|---|
| (mJy) | (mag) | (arcsec) | (arcsec) | (mag arcsec-2) | (mag arcsec-2) | (∘) | |||
| 141.3 | 16.7 | 16.65 | 5.29 | 20.57 | 170.9 | 0.60 | |||
| 92.6 | 13.8 | 16.19 | 4.20 | 19.60 | 170.9 | 0.60 | |||
| 48.6 | 14.0 | 13.04 | 3.24 | 15.13 | 170.9 | 0.60 | |||
| 44.3 | 17.6 | 11.97 | 3.06 | 13.51 | 170.9 | 0.60 |
Mid-IR level 1-b frames of NGC 1316 and NGC 612 were downloaded from the WISE archive777 The All-sky Data Products and Atlas Images archive is maintained by the NASA IPAC (Infrared Processing and Analysis Centre) in the IRSA (Infra-Red Science Archive), http://irsa.ipac.caltech.edu/applications/wise/ . In order to improve the resolution of those images, we used the Image Co-addition with Optional Resolution Enhancement software package (ICORE, Masci 2013) and a deconvolution technique based on the Maximum Correlation Method (MCM-HiRes, Masci & Fowler 2009; Jarrett et al. 2012). This allowed an improvement of a factor of 3–4 in angular resolution compared to the publicly released mosaics, which were optimized for point-source detection and have a degraded resolution of 30 to 40% compared to the native single frames (see Cutri et al., 2012; Jarrett et al., 2013). As shown in Table 2, the achieved resolutions are about 3′′ in the first three bands and 6′′ in , which is comparable (within about 30%) to those of Spitzer IRAC and MIPS-24 images. For comparison, the resolution of the original WISE images is in the first three bands and in the 22 m band. This super-resolution reconstruction is not without limitations. Most commonly associated with deconvolution processing are “ringing” (sinc function) artifacts associated with abrupt transitions between background (or low surface brightness emission) and bright emission such as stars or active galactic nuclei. These artifacts are mitigated to a certain extent (as described in Jarrett et al. 2012), but are still present adjacent to the bright nucleus of NGC 1316 and the PSF-dominated inner regions of NGC 612.
The images were converted from Data Number (DN) into mJy/pixel by multiplying by the following factors, , , , and for the respective , ,, bands (Wright et al. 2010, Cutri et al. 2012).
A color correction was applied to account for the steeply rising mid-IR spectra of dusty sources such as NGC 1316 and NGC 612. Rather than using the standard conversion for sources with a flat spectrum (), we used the following values for the zero-magnitude flux density, : , , , and Jy in the respective , , , bands (given by Jarrett et al. 2013 for the three first bands and by Brown et al. 2014 for ; the latter value takes into account the revised response function and effective wavelength of ).
Figure 2 shows three-color (, , ) resolution-enhanced WISE images. The dust lanes are clearly visible in both galaxies.
In order to characterize the various contributions to the mid-IR emission of the two galaxies, we used GALFIT, a two-dimensional image decomposition program that fits parametric functions to digitized images using standard chi-squared minimization (Peng et al., 2002). As inputs, GALFIT uses, in addition to the images in the different bands, uncertainty maps and point-spread function (PSF) images to account for image smearing in the corresponding bands.
The analysis was done on images of NGC 1316 and images of NGC 612 centred on the galaxies’ respective nuclei. The sky background emission in our enhanced-resolution and cleaned images, which virtually have no visible bad pixels to mask, was first subtracted. It was determined in an annulus well outside the target galaxy.
4 Global measurements
Source characterization of the WISE data was carried out using software tools specifically developed for Spitzer and WISE imaging, described in Jarrett et al. (2013). The most important steps included foreground star removal (PSF-subtraction), local background estimation using an elliptical-shaped annulus, ellipticity and position angle estimation from the 3 isophote (thereafter fixed for all radii), and the radial size based on the 1 isophote. Using a double Sérsic model (Sérsic, 1968) to fit the galaxies’ inner and outer regions, the total integrated flux was then computed from the integrated isophotal flux and the extrapolated light that extends beyond the 1 isophote. The flux density uncertainties reported in Tables 5 and 6 were computed from the background and Poisson error estimations. Finally, these global measurements were complemented with curve of growth and azimuthally-averaged surface brightness measurements that provide insights into internal structural changes with radius.
Tables 5 and 6 present the results. The flux density measurements of NGC 1316 compare very well with the corresponding Spitzer values in Table 1 of Dale et al. (2005). For NGC 612, our measurement in is in agreement with the IRAS value at 25 m ( mJy; NED); the isophotal flux is significantly lower than the 12 m IRAS flux ( mJy; NED) and the 9 m Akari flux of 135 mJy (Ichikawa et al. 2012).
For both galaxies, there is approximately a 50% drop in the measured flux density from to ; this is mainly due to the decline in stellar emission as one moves from 3.4 m to 4.6 m. NGC 1316 has a higher -to- flux density ratio than NGC 612. This will be discussed in Sect. 8.
5 Spitzer IRS spectra of the central regions
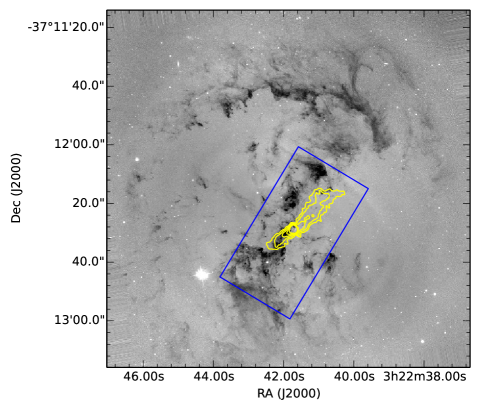
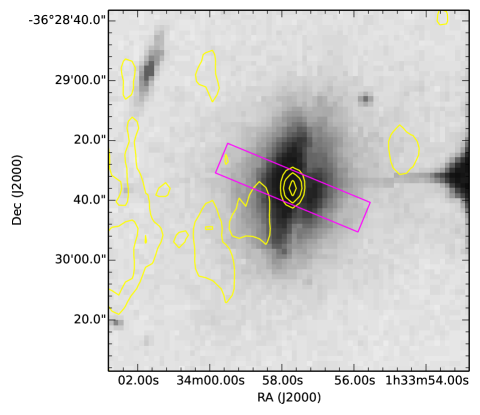
Spitzer IRS spectra are available for the central regions of both galaxies. The regions from which they were extracted are shown in Fig. 1 as rectangles overlaid on an HST image of NGC 1316 and on a Digitized Sky Survey image of NGC 612. Those regions are rather large and cover both the nuclei of the galaxies and areas where dust is seen in extinction. For NGC 1316, the extraction box is roughly oriented along the central dust lane, while in NGC 612 it is almost perpendicular to the dust lane of the nearly edge-on disk. The width of the extraction box of NGC 612 is (6.5 kpc); in NGC 1316, the height of the box of corresponds to 5 kpc.
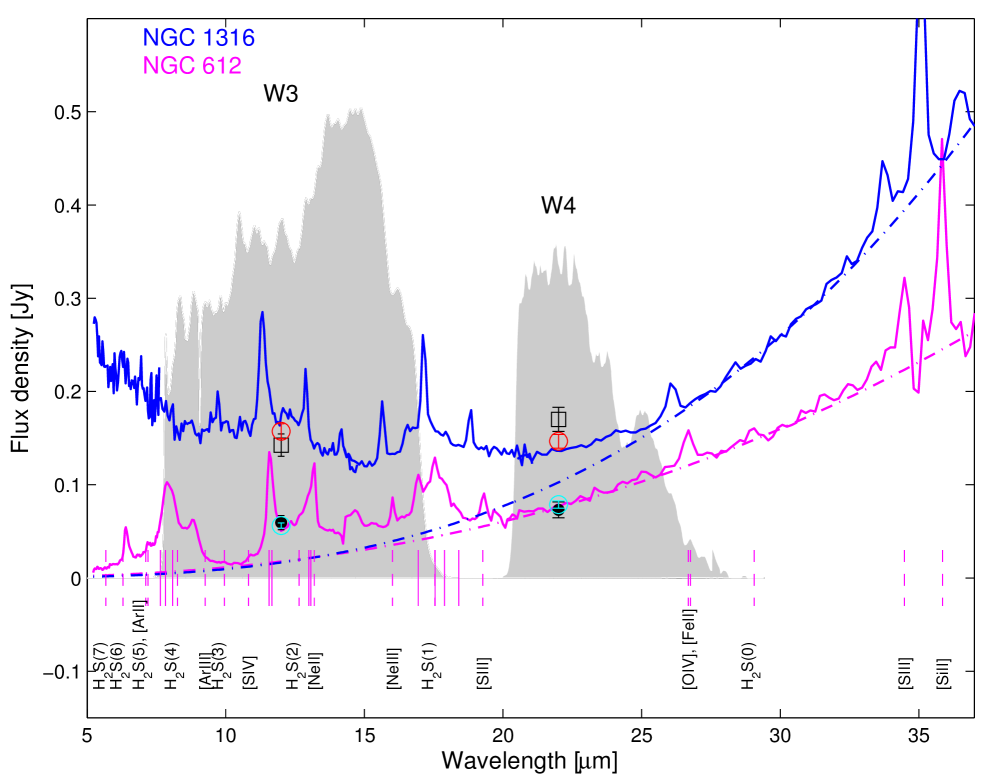
The spectra are a combination of four low-resolution spectra (SL2, SL1, LL2 and LL1, with increasing wavelength) and are shown in Fig. 3 in the observer’s frame. The NGC 1316 spectra were taken by the SINGS team (Kennicutt et al., 2003b) and downloaded from the SINGS archive888irsa.ipac.caltech.edu/data/SPITZER/SINGS/galaxies. The NGC 612 spectrum was downloaded from the Spitzer archive as an Enhanced Imaging Product999 Project ID 30745, ‘Spitzer Observations of the First Unbiased AGN Sample of the Local Universe’, PI K.I. Weaver.
The spectrum of NGC 1316 is shown here as a comparison to the NGC 612 spectrum and to help interpret the WISE broad-band observations. To our knowledge, the NGC 612 spectrum has not been published before. The near-IR to mid-IR spectrum of NGC 1316 has been discussed before (the Spitzer IRS spectrum by Smith et al. 2007 and the 2.5–13 m AKARI spectrum by Kaneda et al. 2007).
The response functions of the WISE and bands are displayed as shaded areas in Fig. 3, and the corresponding fluxes measured in those bands are shown as squares for NGC 1316 and black dots for NGC 612. We also calculated the flux contained in the IRS regions by weighing and summing up the Spitzer spectra over the response functions of the and bands. The resulting points are added to Fig. 3 as open circles (red for NGC 1316 and cyan for NGC 612). The WISE broad-band measurements are in good agreement101010 For NGC 612 we measured mJy in and mJy in from the Spitzer spectra. For NGC 1316 we got mJy and mJy in the respective bands. The 5% uncertainties reflect the uncertainties attached to the spectral values. For comparison, the values measured in the WISE maps are mJy and mJy for NGC 612, and mJy and mJy for NGC 1316. with the Spitzer IRS spectra, especially for NGC 612.
In NGC 1316, the low-wavelength part of the spectrum is dominated by the Rayleigh-Jeans part of the spectrum of the old stellar population, whereas NGC 612 displays strong emission lines, in particular the 7.7 m PAH feature that enters the filter. Smith et al. (2007) had pointed out the peculiar spectrum of NGC 1316, with an unusually low ratio of the 7.7 to 11.3 m line strength. The 7.7 m PAH feature is produced by smaller, ionized PAHs whereas the 11.3 m feature is due to larger and neutral PAHs (e.g. Allamandola et al. 1999). Such low ratios were found in the other low-luminosity AGNs of the SINGS sample (Smith et al., 2007) and in a sample of dusty elliptical galaxies (Kaneda et al., 2008). It is likely that the PAHs in NGC 1316 come from the recent infall of a small gas-rich galaxy. The 7.7 m feature may be weakened by the X-ray radiation field in NGC 1316 that destroys the smaller PAHs. The 11.3 m PAH emission line from NGC 612 is as bright as that from NGC 1316, despite the-six-times greater distance.
The steeper slope of NGC 1316 in the IRS spectrum may indicate a higher dust temperature than in NGC 612, likely associated with AGN heating. Both spectra exhibit high-excitation lines, such as [OIV] at 25.9m, typically attributed to AGN.
Could the synchrotron cores of the galaxies contribute significantly to the WISE fluxes and the Spitzer IRS spectra? Interestingly, the core of double-lobed radio galaxy Virgo A at the center of M 87 is detected across the entire electromagnetic spectrum, with a 24 m MIPS flux of about 51 mJy (Shi et al., 2007). The non-thermal core and jet of M 87 were also detected in WISE images (Jarrett et al., 2013). At 6 cm (at resolution), the core has a flux density of 2875 mJy (Nagar et al., 2001). For a similar spectral index, the flux density of Fornax A and NGC 612 would be about 60 times weaker than at 6 cm, and therefore fainter than 1 mJy at 24 m111111 At 6 cm, the core of Fornax A has a flux density of 26 mJy and that of NGC 612 38 mJy (Morganti et al., 1993). . This is much lower than what is measured in both galaxies’ IRS spectra, which indicates that most of the emission in the long-wavelength part of the IRS spectra and in the WISE and images is not due to synchrotron emission from the nucleus. The jet of NGC 1316 was not detected in the Spitzer images either, and upper limits were set ranging between 0.39 mJy and 1.05 mJy between 3.6 m and 24 m (Lanz et al., 2010), in agreement with the expectations.
The centers of both galaxies were observed at subarcsecond resolution in the MIR (the Sasmirala project121212http://dc.zah.uni-heidelberg.de/sasmirala, Asmus et al. 2014). The nucleus of NGC 612 was undetected, and an upper limit of 33 mJy at 12 m was set, well below the measurement in the Spitzer IRS spectrum. In NGC 1316, a flux density of mJy was measured at 12 m, and a limit on the size of the emission of 38.1 pc was obtained (after correcting for our adopted distance). Those values show that in both galaxies the AGN is weak and the MIR emission is dominated by dust/star formation.
6 Resolved maps and component separation
The three main components that contribute to the mid-IR emission of NGC 1316 and NGC 612 (the stellar component, the AGN, and the dust) have different spatial and spectral shapes:
– The stellar component is extended and smooth and can be modelled using simple geometrical models; the spectrum is that of the Rayleigh-Jeans side of a black-body spectrum.
– The AGN, on the other hand, is point-like at the angular resolutions of WISE and can be modelled by a PSF; as a synchrotron source, its flux density varies with frequency as a power law, . The core of Fornax A has a spectral index, , of between 2.7 and 4.8 GHz and that of NGC 612 (Morganti et al., 1993). In Fornax A, decreases in the central jet to about (Geldzahler & Fomalont, 1984).
– The dust in NGC 1316 appears very irregular, whereas in NGC 612 the dust lanes seen in extinction seem to be associated with a nearly edge-on warped disk. The mid-IR spectrum is a complex combination of spectral lines and thermal dust continuum (Draine et al., 2007); a good model of the thermal dust continuum is a superposition of modified black bodies at fixed temperatures (e.g. Smith et al. 2007).
In this Section, we describe the two methods that we used to perform the component separation in the WISE images and present the results for each galaxy. In both methods, the images serve as representatives of the starlight distribution.
6.1 Methods
| Sérsic | PSF | 1st Sérsic | 2nd Sérsic | PSF | |
|---|---|---|---|---|---|
| Image center (RA) | 03:22:41.692 | 03:22:41.770 | 03:22:41.701 | 03:22:41.809 | 03:22:41.770 |
| (DEC) | –37:12:28.86 | –37:12:27.54 | –37:12:28.68 | –37:12:32.09 | –37:12:27.54 |
| Integrated magnitude | 4.87 | 10.66 | 4.69 | 8.61 | 12.26 |
| Flux density (mJy) | 3456.9 | 16.70 | 4080.3 | 110.3 | 3.8 |
| Effective radius, (′′) | 144.0 | - | 248.0 | 37.7 | - |
| Sérsic index | 6.15 | - | 8.21 | 0.29 | - |
| Position angle, PA (∘) | 52.7 | - | 52.9 | 28.9 | - |
| Axis ratio, | 0.70 | - | 0.67 | 0.98 | - |
| Reduced chi-squared | 21.8 | 13.9 |
The emission in both (3.4 m) and (4.6 m) is dominated by starlight. After examining the images, we decided to use the images as representatives of the starlight in the galaxies. Indeed, although the and images are very close in wavelength, the noise is higher in ; the galaxies are brighter in by a factor of about 2, so the signal-to-noise is higher in the image by a factor of about 2.5. The AGN is expected to be slightly fainter in (by a factor of about 1.2 for NGC 1316, based on the estimates from the corresponding Spitzer images by Lanz et al. 2010) and is therefore less of a contaminant. Finally, we expect the PAH feature at 3.3 m to be insignificant compared to the continuum.
6.1.1 Fitting method
In the first method we used GALFIT to model the starlight and the AGN. The residuals of the two-dimensional fits are a representation of the dust distribution in the galaxies.
Our choice of starlight models was informed by the morphology of the galaxies, appreciable lower residuals and reduced chi-squared values. For each galaxy, we tested two models of the starlight: for NGC 1316, a single Sérsic and a double Sérsic model were used; for NGC 612, a single Sérsic model and the superposition of a Sérsic and an exponential disk model. As will be shown in the following sections, the double starlight models were better fits to the images and were subsequently used to represent the starlight in the other bands.
The AGN being very faint in , we had to use an iterative procedure with GALFIT to determine its location and flux, following the approach taken by Lanz et al. (2010) in their analysis of the Spitzer images of NGC 1316. We first determined the centers of the starlight in , then used a starlight + PSF model to identify the location of the AGN in . We then kept these centers fixed and fitted a starlight + PSF model to the image. The geometrical best-fit Sérsic parameters from the fit and the iteratively determined centers (of both the Sérsic and the AGN) were held constant in the subsequent fits to the other images, while the amplitudes were left to float.
6.1.2 Scaling method
In the second method, we subtracted the starlight in the and images by simply scaling the images by appropriate factors and subtracting them from the and images, after having smoothed them to the angular resolutions of and . This technique is commonly used to extract the non-stellar emission from mid-IR images (e.g. Helou et al. 2004, Dale et al. 2005, Draine et al. 2007). The scaling factors were calculated from the spectral energy distribution of the stellar population of galaxies that are completely dominated by the evolved stellar population,
| (1) |
| (2) |
We used a 13 Gyr E-type galaxy from the GRASIL template (Silva et al., 1998).
6.2 NGC 1316
6.2.1 Starlight and AGN
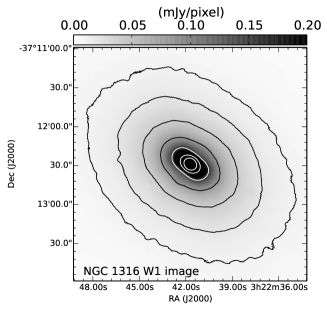
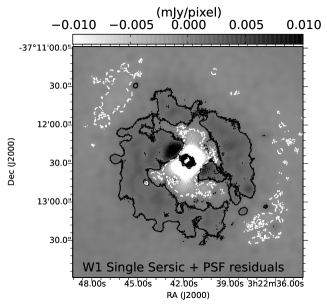
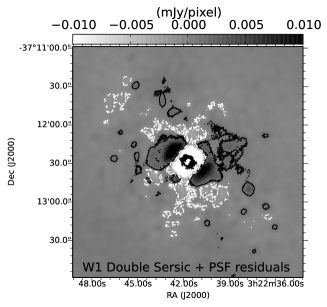
Figure 4 shows the image (left panel) and the residual maps for the two models considered, a single Sérsic + PSF and a double Sérsic + PSF (middle and right panels). The best-fit parameters are listed in Table 4.
The results can be directly compared to the ones obtained by Lanz et al. (2010) in their analysis of the Spitzer 3.6 m image of NGC 1316. They also used a single Sérsic model + PSF; the central coordinates and the geometrical parameters are in excellent agreement (they had a Sérsic index of , an effective radius of , an axis ratio of and a position angle of ). This is comforting given the similar wavelengths and comparable angular resolutions of the Spitzer 3.6 m image and our enhanced-resolution 3.4 m image. The flux densities, however, are significantly higher in the WISE map, both for the Sérsic model (about 3457 mJy for WISE versus 2390 mJy for Spitzer) and for the central point source (16.7 mJy versus 4.670.22 mJy). Unfortunately Lanz et al. (2010) do not say whether their value for the Sérsic model refers to the total flux or whether it was measured within a certain aperture. The WISE value in Table 4 refers to the total flux, out to infinite radius, while in Table 5 we give the flux within the 1-sigma isophotal radius of 761, 2.8 Jy, which is closer to the value quoted by Lanz et al. (2010). Another explanation of the difference may be the background subtraction. Some of the diffuse emission may have been included in the background and subtracted. Lanz et al. (2010) mention that they used a region for the analysis. The large field of view of WISE ( degree) means that a clean background measurement is possible.
The residual map for the single Sérsic + PSF model shows a positive ring-like feature at a radius of about 30′′, with a width of about . In the more central region, on the other hand, the model slightly oversubtracts the emission and then undersubtracts it (black and white regions). Very similar features can be seen in the residual Spitzer 3.6 m map of Lanz et al. (2010). Using a double Sérsic model + PSF removes completely the ring-like structure, whereas the very central region remains the same.
Compared to the single Sérsic + PSF model, the number of parameters has increased from 10 to 17, for a total number of data points of 5252. The reduced chi-square values have decreased significantly (see Table 4), which indicates that the double Sérsic model is a better representation of the stellar light in NGC 1316. It will therefore be used in the rest of the analysis.
6.2.2 Non-stellar emission
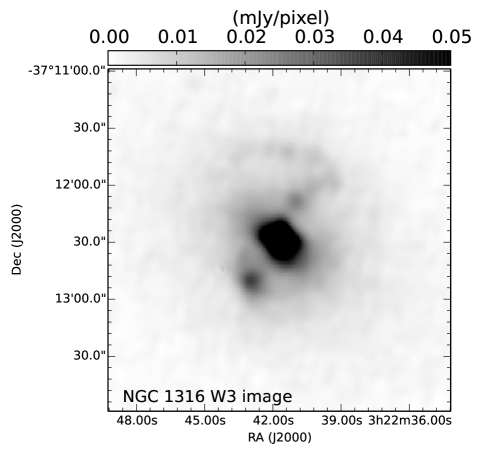
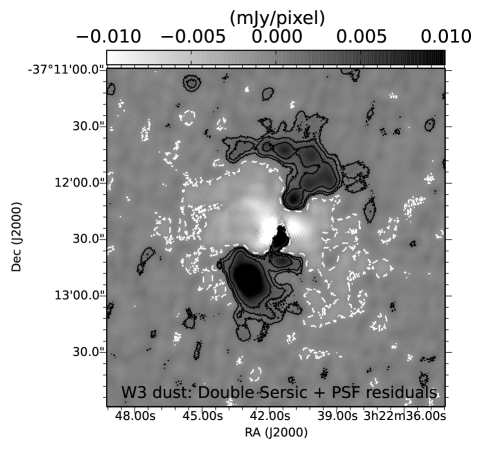
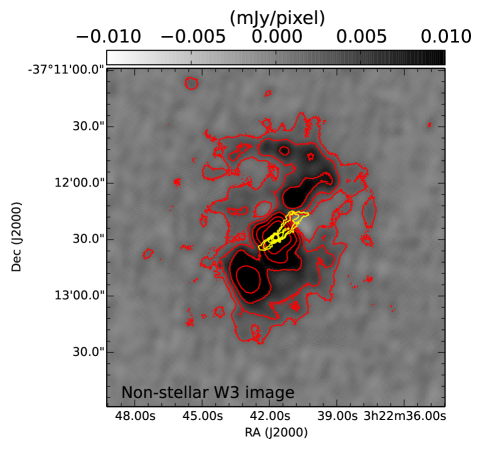
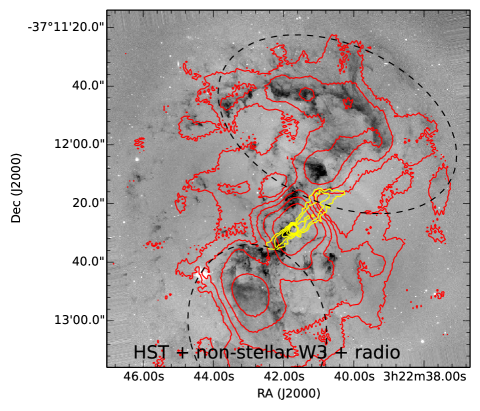
Figure 5 (left panel) shows the image of NGC 1316. The residual image obtained from the fitting method to subtract the stellar component and a possible AGN is shown in the right panel. This image reveals clearly the dusty features to the NW (the mushroom-like structure with an azimuthal arc) and SE of the nucleus seen in the HST image and known from earlier mid-IR studies (e.g. Xilouris et al. 2004, Temi et al. 2005, Lanz et al. 2010, Duah Asabere et al. 2014).
The limitations of the fitting method are visible in the central region, where emission has clearly been oversubtracted (there are negative values). The Sérsic models do not perfectly represent the stellar light, as indicated earlier in the fits to W1. The PSF component also clearly overestimated the central flux. The central region of NGC 1316 contains dust patches very close to the AGN and those components are mixed at the resolution and sensitivity of the WISE images.
Fig. 6 shows the image of NGC 1316 obtained using the scaling method to remove the starlight contribution (traced by ) to the image. The scaling method yields more extended emission than the fitting method. It is possible that the Sérsic models included part of the diffuse dust emission, since their amplitudes were left to vary freely during the fit (while the geometrical parameters were fixed). If the dust distribution partly follows that of the starlight, then the two components cannot be separated by the fitting method and part of the dust emission may be subtracted.
In order to check the sensitivity of the features to the adopted scaling factor of 0.158 for the image, we slightly varied this factor. Increasing it only slightly (to 0.17) produces a negative ring around the center, which indicates that this factor, which was estimated from SED modeling of dust-free elliptical galaxies, must be correct within 10% for NGC 1316. Note that the scaling method does not subtract the AGN in since it is much weaker in than in .
In order to quantify the dust emission in NGC 1316 and compare to other estimates, we measured the flux density in the two elliptical regions defined by Lanz et al. (2010) and shown in Fig. 6 (right panel). Interestingly, the two regions have very comparable flux densities in : mJy in the NW region and mJy in the SE one. At 5.8 m and 8.0 m, Lanz et al. (2010) had measured mJy and 13.8 mJy in the NW region and mJy and 18.8 mJy in the SE region. Without a spectrum it is not possible to be certain that the higher 12 m to 8 m flux ratio in the NW region is due to a different 11.3 m to 8 m PAH flux ratio. The NW region is known to be about 2.5 times richer in molecular gas (Horellou et al., 2001). This is also where the inner jet ends abruptly and it may have affected the physical conditions of the interstellar medium.
The methods could not be applied successfully to the image of NGC 1316 because of the very bright nucleus that causes artifacts in the deconvolution in the form of negative regions and sidelobes. The global properties, however, were characterized and a total flux of about 342 mJy was estimated (Table 5). This is slightly lower that what Lanz et al. (2010) had measured in their Spitzer 24 m image ( mJy for the Sérsic component and mJy for the nuclear source). Since the image is of limited interest compared to the Spitzer 24 m image, it is not further discussed.
6.3 NGC 612
6.3.1 Starlight
| Sérsic | Sérsic | + | Exponential disk | |
|---|---|---|---|---|
| Image center (RA) | 01:33:57.634 | 01:33:57.618 | 01:33:57.637 | |
| (DEC) | –36:29:35.36 | –36:29:35.21 | –36:29:35.26 | |
| Integrated magnitude | 9.34 | 9.84 | 10.10 | |
| Flux density (mJy) | 56.3 | 35.5 | 28.0 | |
| Effective radius, (′′) | 9.8 | 22.1 | - | |
| Sérsic index | 2.75 | 1.68 | - | |
| Disk scale length (′′) | - | - | 3.2 | |
| Position angle, PA (∘) | –4.2 | –15.1 | –1.0 | |
| Axis ratio, | 0.49 | 0.73 | 0.34 | |
| Reduced chi-squared | 13.7 | 4.6 |
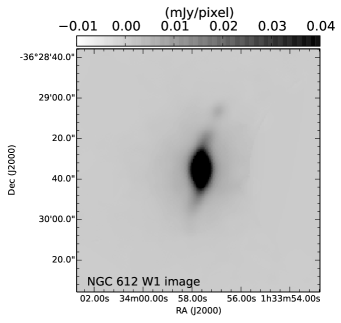
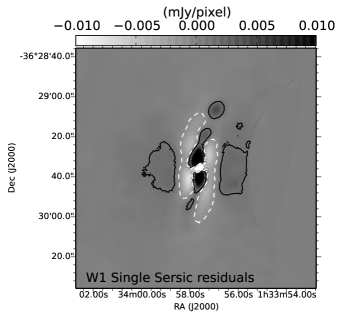
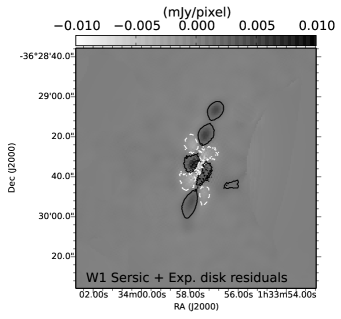
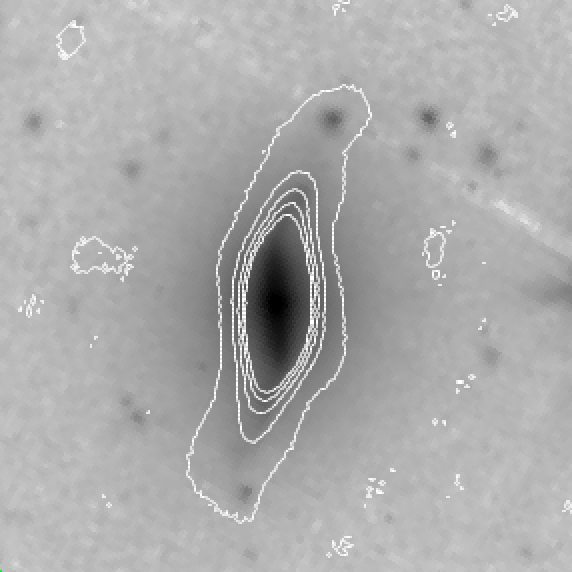
For NGC 612 we used a single Sérsic model and a Sérsic + exponential disk to represent the starlight. We also included a PSF to model a possible central source, but the fitting procedure did not identify such a component in any of the bands. The image of NGC 612 and the residuals of the fits are shown in Figure 7. The best-fit parameters are given in Table 5.
Adding an exponential disk to the Sérsic model increases the number of parameters from 10 to 16, for the same number of data points of 3502. The residual map and the chi-square are better for this two-component model. Note, however, that the warp in NGC 612 cannot be captured by those simple models.
The effective radius of NGC 612 in the single Sérsic model of the image is slightly lower than what was found in the -band ( (6 kpc) instead of ; Fasano et al. 1996, Govoni et al. 2000) and in the -band (; Véron-Cetty & Véron 2001). Our values can be compared more directly to those found in the -band by Inskip et al. (2010) who also included an edge-on disk and obtained an of for a fixed Sérsic index of 4 and a disk scale-length comparable to ours, (2 kpc).
6.3.2 Non-stellar emission
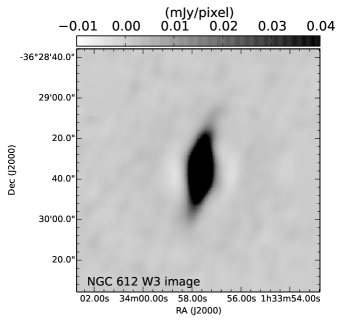
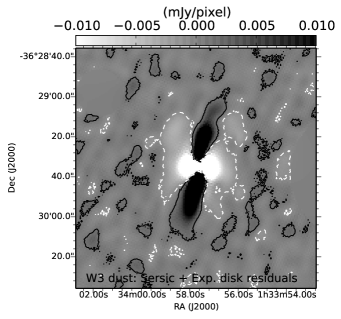
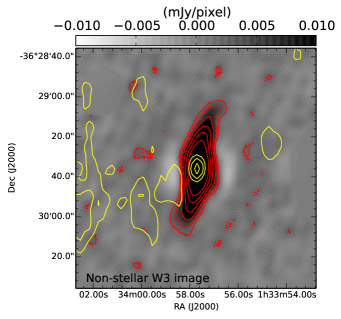
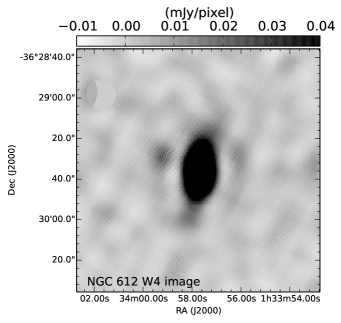
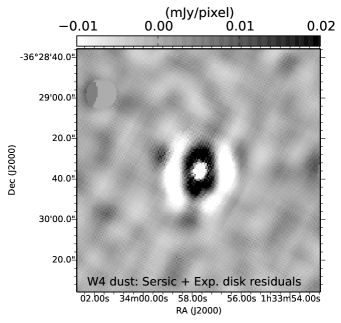
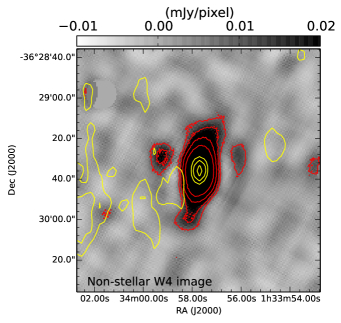
Figure 8 shows the and images (left panels) and the maps of the non-stellar emission obtained using both methods (fitting method in the middle panel and scaling method in the right panel). The WISE images of NGC 612 clearly reveal a warp, best seen in the scaled image. The structure of the dust lane is difficult to see in optical images such as the DSS image shown in Fig. 1. The warp, however, appears also in archival Spitzer images131313 Project 10098, ‘Warm Spitzer Imaging of NuSTAR fields’, PI Daniel Stern, as shown in the overlay of the scaled image on the Spitzer 4.5 m displayed in Fig. 9. It seems to extend to much larger radii, especially to the North, in the HI image of Emonts et al. (2008; their Fig. 7).
The two methods give different results: the fitting method removes much more flux than the scaling method: the fit to yielded a flux of 12.2 mJy for the Sérsic component, and of 99.8 mJy in the exponential disk; if we scale the components fitted in using our adopted scaling factor, then the fluxes from the stellar population in are only 5.6 mJy in the Sérsic and 4.4 mJy in the exponential disk. This is understandable because the dust in this galaxy, unlike in NGC 1316, follows the bulk of the stars. The dusty component is therefore largely included in the fit (especially in the exponential disk) and gets subtracted. The relative merits and limitations of both methods will be discussed in Sect. 8.3.
7 Colors, stellar masses and star formation rates
7.1 WISE colors
| Galaxy | ||||
|---|---|---|---|---|
| (mag) | (mag) | (mag) | (mag) | |
| NGC 1316 | ||||
| NGC 612 |
It is interesting to examine how the WISE colors of our two galaxies (presented in Table 14) compare to those of larger galaxy populations. The WISE - vs. - color diagram has been investigated by a number of authors to study statistically large galaxy populations and their evolutionary states (e.g. Jarrett et al. 2013, Cluver et al. 2014). The color-color diagram crudely separates morphological types, notably disk (star-forming) from elliptical (passive, or quenched) and from AGN-dominated. Assef et al. (2013) found that large - colors (larger than 0.8 mag) can be used to identify bright AGN. Alatalo et al. (2014) identified a clear transition zone in versus - diagrams between the loci of early-type galaxies and late-type galaxies. Sadler et al. (2014) saw a strong dichotomy in the WISE colors of FR I and FR II radio sources, the FR I being found in WISE early-type galaxies and the FR II in late-type galaxies (FR I radio galaxies have diffuse radio lobes with an outwards declining brightness and are typically fainter than FR II sources that have brighter edges with hot spots; Fanaroff & Riley 1974).
The two galaxies are found on different sides of the infrared transition zone. NGC 1316 has mid-infrared colors that are dominated by the old stellar population host galaxy, with only minimal signature of an AGN (and hence the colors are consistent with an evolved luminous population), while NGC 612 has very red W2-W3 colors, consistent with active star formation (as well as an AGN, noted by the warm - color) while also maintaining a bulge component (most pronounced in the near-infrared, exhibiting an S0 morphology).
In the WISE color-color diagram of local radio galaxies (Fig. 13 of Sadler et al. 2014), NGC 1316 appears in the group of FR I radio galaxies. NGC 1316 does not have significant radio hot spots and the radio lobes are not edge-brightened, so it can be classified as an FR I radio galaxy. NCC 612 is clearly outside the region dominated by FR I galaxies with its much redder - color, consistent with active star formation; with a - color of about 0.13 mag, NGC 612 appears at the lower end of the - distribution of FR II radio galaxies (note that the FR II galaxies spread over a large range of - colors, between about 0 and 1.2 mag): NGC 612 is not as red in its - color as most FR II galaxies, which are associated with spirals and quasi-stellar objects/Seyfert galaxies. Interestingly, NGC 612 has been assigned a hybrid radio morphology (both FR I and FR II): it has a bright hot spot in the eastern lobe but a diffuse western lobe, and its radio luminosity is near the dividing value between the two types (Gopal-Krishna & Wiita 2000).
The different locations of the galaxies in the WISE color-color diagram may reflect different evolutionary states. While NGC 612 is likely to be at an earlier evolutionary stage than NGC 1316 which has a more evolved galaxy population, it is unclear whether NGC 612 will move upwards first in the color-color diagram of Sadler et al. (2014; towards larger - values more typical of FR II radio sources hosted by ‘WISE late-type galaxies’) or move left (towards FR I sources hosted by ‘WISE early-type galaxies’).
7.2 Stellar masses
The WISE (3.4 m) band is sensitive to evolved luminous stars that dominate the bolometric luminosity of the host galaxy’s stellar component. Similar to the -band (2.2 m), it can be used as a measure of stellar mass for nearby () early-type galaxies (see Jarrett et al. 2013). Using stellar masses derived from Galaxy And Mass Assembly (GAMA; Taylor et al. 2011), Cluver et al. (2014) obtained the following relation for resolved low-redshift galaxies:
| (3) |
where is the luminosity in the band expressed in solar luminosities (), is the absolute magnitude of the galaxy in , , and reflects the WISE rest-frame color of the galaxy. A color correction appropriate to the morphological type and redshift of each galaxy was added to the observed colors (–0.006 mag for NGC 1316 and –0.033 mag for NGC 612), which were measured within the isophote of the images. The color correction refers to the cosmic reddening -correction appropriate for each band ( and , respectively) and was estimated using the spectral energy distribution of an old evolved galaxy for NGC 1316 and an S0 for NGC 612 (both SEDs from the library of Silva et al. 1998).
For NGC 1316, this yields a stellar mass estimate of for NGC 1316 within 589′′ (the one-sigma isophotal radius in , Table 5). From the kinematics of planetary nebulae, McNeil-Moylan et al. (2012) constrained the mass distribution in NGC 1316. They included a dark matter component, modeled as a pseudo-isothermal distribution. Using their best-fit parameters and after integration of the density profile, we obtain a dark matter mass of , or a stellar to total (stellar + dark matter) mass fraction of 23% within .
For NGC 612, the stellar mass is estimated to be within (the one-sigma isophotal radius in , Table 6). From observations of optical emission lines in the star-forming disk, Goss et al. (1980) had put an upper limit of within on the total mass of NGC 612 (after correction to our adopted distance). From HI line observations, Emonts et al. (2008) could estimate the mass within a larger radius, 115′′ (70 kpc), to be (where we assume that the inclination of the galaxy is ). Assuming a linear increase of the total mass with radius, this implies that the stellar mass represents about 10% of the total mass in NGC 612. The dark matter halo of NGC 612 seems therefore to be more significant than in NGC 1316. However, McNeil-Moylan et al. (2012) point out the complexity of the kinematics of NGC 1316 with a rise in the rotation curve in the outer parts, which could be a signature of outward transfer of angular momentum produced by the merger. A more sophisticated model such as a non-spherical distribution might be required to obtain a more precise and accurate representation of the mass distribution in this galaxy.
7.3 Star formation rates
Measurements in the Spitzer MIPS m band are commonly used to estimate star-formation rates (see Calzetti et al., 2005; Alonso-Herrero et al., 2006; Calzetti et al., 2007; Rieke et al., 2009; Rujopakarn et al., 2012). The WISE (22 m) band is similarly sensitive to warm dust continuum from young stars. The WISE (12 m) band is sensitive to the 11.3 m PAH emission feature, which is well correlated to the star formation rate (SFR) as traced by the extinction-corrected H luminosity (e.g. Shipley et al. 2016) and to dust heated by a combination of young and evolved stars.
We use the relations provided by Cluver et al. (2014) to estimate the star-formation rates:
| (4) |
| (5) |
Cluver et al. (2014) do not provide an estimate of the uncertainties in their scaling relations, but their figures indicate a standard deviation of about 0.3 in the log, which corresponds to a factor of 0.5 to 2 in the absolute value. This is the uncertainty that we attach to the inferred SFRs. An additional uncertainty of about 5% results from the uncertainties in the absolute calibration of 4.5% in and 5.7% in (Cutri et al., 2012), multiplied by the factors in the equations above. For NGC 1316, we obtain from the 12 m measurement and from the 22 m measurement (Table 5). For NGC 612, we get from the 12 m measurement and . from the 22 m measurement (Table 6). These estimates are consistent with the morphological classifications revealed by the band colors (see Sect. 7.1). Because of the uncertain contribution of heating by evolved stars in the 12 m band, the SFR estimates from the 22 m band are likely to be more accurate.
Far-infrared photometry can be used to obtain an independent estimate of the SFRs. Indeed, the SFR is roughly proportional to the total infrared (TIR) luminosity, , and the constant lies in the range of for stellar population models with solar metallicity and constant star formation over a timescale of more than 10 Myr, where is expressed in erg s-1 (Calzetti 2013; Starburst99, Leitherer et al. 1999). Using the TIR luminosities estimated in Sect. 5, we derive SFRs of 0.30 to 0.77 for NGC 1316 and of 7.3 to 18.8 for NGC 612. Although those various estimates of the SFRs have a large spread, they all indicate that the SFR of NGC 612 is higher of that of NGC 1316 by about one order of magnitude.
8 Discussion
8.1 Comparison of the two galaxies
The picture given by the WISE measurements is consistent with NGC 1316 being a massive elliptical galaxy, well represented by a double Sérsic model, with a low star formation rate and an irregular dust pattern likely due to the recent infall of a small gas-rich companion. A two-dimensional fit identifies a central component that may be associated with the AGN; however, at the resolution of the WISE images (250 to 500 pc), the complex dust distribution in the central region of NGC 1316 and the AGN cannot be safely separated. NGC 612 can be well represented by a bulge and an exponential disk. The fitting procedure does not identify a central point source in the WISE maps (resolution of 1.6–3.4 kpc). The -to- flux density ratio is significantly higher in NGC 1316 () than in NGC 612 (; Tables 5 and 6). The starlight from NGC 1316 contributes more strongly to the emission, while in NGC 612 the higher continuum in is very likely due to a stronger heating of the dust grains by ongoing star formation.
The core of NGC 612 is about 53 times stronger than that of NGC 1316 (Fornax A) in terms of radio power at 4.8 GHz151515 Power of the radio cores at 4.8 GHz: W Hz-1 for NGC 612 and W Hz-1 for NGC 1316, after correction to our adopted distances assuming that Morganti et al. (1993) used a distance of 32.7 Mpc for NGC 1316 and of 178 Mpc for NGC 612, consistent with the redshifts of the galaxies and their adopted value for the Hubble constant of km s-1 Mpc-1. . Those numbers are indications that the nucleus of NGC 612 is currently more active than that of NGC 1316. On the other hand, Fornax A has an inner radio jet, which shows that plasma is still being ejected; no inner jet is clearly seen in NGC 612, although some radio emission is seen in the eastern side (yellow contours in Figs. 1 and 8). Morganti et al. (1993) had pointed out a knotty jet in their lower-resolution observations leading to a hot spot in the eastern lobe. However, deeper radio observations would be required to establish whether the lobes of NGC 612 are still being fed via inner jets. From a comparison of X-ray and radio measurements, Iyomoto et al. (1998) argued that the nucleus of NGC 1316 has become dormant during the last 0.1 Gyr, and that the galaxy may have the appearance of a normal, inactive elliptical galaxy (with no sign of past nuclear activity) in the coming 0.1 Gyr. NGC 1316 does not possess much neutral gas that could fuel the AGN (about of molecular gas and very little HI gas, Horellou et al. 2001). It does have a small gas-rich companion (NGC 1317, to the North) but this galaxy appears undisturbed and not directly interacting with NGC 1316. NGC 612 contains a much larger reservoir of neutral gas (almost 1010 , where about 80% of it is molecular); it also has a neighbor galaxy, NGC 619, located about 400 kpc away with an HI disk that is even larger than its own (Emonts et al., 2008) and an HI bridge is seen between the two galaxies. The near environment of NGC 612 is thus extremely rich in neutral gas that may fuel the nucleus and sustain its activity, especially if the two galaxies were to merge in the future and the gas could lose angular momentum.
8.2 Challenges to models of galaxy evolution
The two galaxies, despite the similarity of their double-lobed radio morphologies, differ in several important ways and raise a number of questions about their formation and future evolution. Are they simply at different stages of a common evolution, or do they belong to two distinct source populations that evolve on separate tracks?
NGC 1316 fits rather well into the standard paradigm of a radio galaxy hosted by an early-type galaxy formed in a merger. NGC 612 is clearly more of a challenge to the current models of radio galaxy formation because of its unusual dusty star-forming disk, best revealed in infrared observations. Simulations are used to quantify how galaxies assemble their mass, via a combination of smooth accretion and mergers (e.g. L’Huillier et al. 2012) and there is evidence that smooth accretion leads to the formation of disks while mergers have a tendency to destroy disks (Welker et al., 2015). In those simulations, AGN feedback has been identified as a crucial ingredient to prevent massive galaxies from overcooling and growing excessively. Radio-mode feedback in particular affects the extended environment of galaxies by injecting energy via jets and lobes. The co-evolution of AGN and their host galaxies is impossible to model exactly because of the enormous range of scales but the nature of the AGN feedback is expected to be different if the surrounding medium is distributed spherically or in a disk (Wagner et al., 2016). The dichotomy of FR I and FR II radio galaxies observed by Sadler et al. (2014) in the WISE color-color diagram seems to indicate that the properties of a radio galaxy are related to those of the host galaxy. It would be interesting to know whether the radio properties are a direct consequence of the morphological types, or whether the radio and optical/mid-IR properties are separate consequences of more fundamental overarching processes such as accretion and mergers in a given environment. Are hybrid FR I/FR II radio galaxies such as NGC 612 a separate population and how do they form?
8.3 Comparison of the two methodologies
The two approaches that we have taken to analyze the WISE images are fundamentally heuristic in their nature. While it is clear that neither of them will yield a perfect result, they make it possible to gain some insight into the various physical components that make up the observed surface brightness distribution of the galaxies. In this section we discuss some of the merits and limitations of each method, and comment on potential ways to reduce these limitations and improve both methodologies.
The fitting method has the positive and negative aspects of any fitting approach: being model-dependent, it provides quantitative information on the underlying surface brightness distribution; at the same time, the selected models are necessarily a simplification of reality and do not capture the features that they do not include (for instance the warp in NGC 612). The method also requires a convolution with the PSF, which needs to be well determined. Any error in the PSF of the band, which was used to represent the starlight, will affect the fit to the image and the results of the subsequent fits to the other bands, since the geometrical parameters obtained in were kept constant. Obviously, errors in the adopted PSF of the other bands may also have an impact on the value of the best-fit amplitude. The method, however, does not require any smoothing of the actual images of the galaxies (only the models are convolved with a PSF), whereas the images are smoothed in the scaling method, as discussed below.
As in any fitting method, there is a danger for the method to converge to a wrong set of parameters, for example if the fit is driven by a “bad” region of the image. Human intervention can be used to inspect the original images and the residuals and help decide whether some regions should be masked (we did mask some nearby stars).
Another important issue is the use of a single number, the reduced , to determine the best-fit parameters. Aside from the fact that the noise may not be truly Gaussian, there might be a covariance between parameters, leading to degenaracies in the fit. We have not investigated this. A Baysesian inference approach based on Monte Carlo calculations would be more rigorous (see, e.g, the new galaxy image decomposition tool GALPHAT, Yoon et al. 2011).
In the longer-wavelength bands, the fitting method obviously tries to reach the lowest possible residuals across the image, in the chi-square sense. In reality, we know that there are features of interest (the dust) that are not included in the model. It would be difficult to model the dust distribution explicitely, especially in a merging galaxy like NGC 1316 where it is known to be very irregular. One could, however, devise a more sophisticated method to help the fit converge to a more physical solution, for instance in an interative approach by keeping the positive residuals of the image above a certain threshold, subtracting them from the original or images, and re-running GALFIT until the residual image is mostly Gaussian and homogeneous. Alternatively, independent information on the dust could be used as a prior, for example, from optical dust extinction maps.
If the dust emission follows the same spatial distribution as the starlight, the fitting method will not be able to recover it because its contribution would be included in the fitted amplitude to or . This might be more of an issue for the thermal dust that is likely to be associated with the old stellar population and dominate in ; in , some of the emission is due to PAHs that are excited by young stars.
Recovering the characteristics of the AGN requires high-resolution images and a high signal-to-noise ratio. In our analysis of the WISE images, the fitting method did not lead to the identification a point-like source in the center of NGC 612.
The scaling method is more empirical and therefore simpler. However, being model-independent, it does not provide the same quantitative insights into the distribution of the starlight. On the other hand, using the image rather than a fitted model to it might be a more accurate representation of the starlight. To test this, we have applied both methods to the image of NGC 1316 and examined the residuals. As mentioned earlier, the image is similar to the image and is expected to be also dominated by starlight. The fitting method yields a residual image that is similar to the one obtained for (right panel of Fig. 4). We have also run GALFIT on the image without using to constrain the structural parameters. Although the reduced chi-square is slightly better and the best-fit parameters slightly different, the residual image presents the same features. In the scaling method, however, the residual image is much more uniform around zero outside the central 30′′. In the inner region, we see a positive and negative residual suggestive of an offset of about three pixels (about 2′′) between the smoothed and the image. When studying the very central regions, additional work to obtain a more precise alignment of the images might lead to improvements.
The scaling method has two obvious sources of uncertainties. The first one is the value adopted for the scaling factor, which was taken from the SED of an old E-type galaxy to estimate the stellar contribution. By varying the scaling factor and examining the resulting images, we could demonstrate that it is accurate to better than 10% for the two galaxies considered.
The other uncertainty comes from smoothing the image to the angular resolution of the (or ) image. This was done by a simple convolution with a Gaussian of full width half maximum (FWHM) calculated as . The PSF in a given band is not exactly equal to the PSF of convolved with this particular Gaussian function. (The PSF in is more regular than the PSFs in and ).
Finally, the scaling method obviously provides the difference image between the (or ) image and the smoothed and scaled image, which can be regarded as an image of the non-stellar component that includes both the AGN and the dust. If the AGN contributes to , then the flux of the AGN in the final image is reduced by the corresponding amount. The scaling method therefore does not separate the dust from the AGN. (However, as mentioned earlier, this is difficult to achieve also in the fitting method given the resolution of the WISE images).
We have also considered an hybrid method, by scaling the best-fit model and subtracting it from or , using the scaling factors used in the scaling method. The resulting images were very similar to the ones obtained in the fitting method.
Both methods are sensitive to the background subtraction. An inclined plane was included in GALFIT, while in the scaling method the background was assumed to be flat. The inclination of the best-fit plane, however, was negligible.
Finally, the analysis was performed on enhanced-resolution images obtained using the MCM-HiRes method described and tested by Jarrett et al. (2012). Artifacts of the deconvolution and the accuracy of the determined PSFs are limiting factors in how far both methods can be applied.
9 Conclusions
We analyzed WISE observations of two nearby radio galaxies, NGC 1316 and NGC 612. Enhanced-resolution images were produced and photometric measurements were performed in the four WISE bands. We used GALFIT, a two-dimensional image decomposition software, and a scaling method to separate the stellar from the non-stellar emission and compare the non-stellar component to optical images that show the dust in extinction. The main results can be summarized as follows:
-
1.
The integrated flux density measurements of our enhanced-resolution WISE images of NGC 1316 compare very well with those from the corresponding Spitzer bands in Dale et al. (2005).
-
2.
A striking difference in the Spitzer IRS spectra of the central regions of the two galaxies is the strength of the 7.7 m PAH feature, which is suppressed relative to the 11.3 m PAH feature in NGC 1316, as observed in samples of dusty elliptical galaxies (Kaneda et al., 2008) and low-luminosity AGNs (Smith et al., 2007), but is strong in NGC 612.
-
3.
By testing different models, we found that the superposition of a double Sérsic is a reasonable representation of the starlight of NGC 1316, which dominates the emission in the band. For NGC 612, a better fit is obtained by the superposition of a Sérsic model and exponential disk. However, those models have their limitations, especially in the central regions, but also to represent the disk of NGC 612 that is strongly warped. Therefore, we also used a simple scaling model to separate the stellar from the non-stellar emission of the galaxies in the long-wavelength bands. Both methods reveal the morphology of the dust distribution in the galaxies. In NGC 1316, the m emission coincides with the dust patches seen in the HST image in two regions to the NW and SE of the nucleus and observed at 8 m with Spitzer (Lanz et al., 2010). In NGC 612, the m and m emission comes from a warped disk.
-
4.
The -to- flux density ratio is significantly higher in NGC 1316 than in NGC 612. This difference may be due to a larger fraction of starlight in the filter for the larger and more luminous galaxy NGC 1316. PAH emission at 11.3 m may also be stronger in NGC 1316, although this does not seem to be the case in the central region of the galaxies for which Spitzer IRS spectra exist. On the other hand, the dusty azimuthal arc in the NW of the nucleus of NGC 1316 shines brightly in , which might be due to enhanced PAH line emission. To our knowledge, no mid-IR spectra are available from that interesting region located just beyond the inner radio jet. The emission in is mostly due to heated dust; it is not surprising that it dominates in NGC 612 that has ongoing star formation thoughout the disk.
-
5.
The two galaxies fall at different locations in the WISE color-color diagram: NGC 1316 appears in the region of gas-poor early-type galaxies and FR I radio sources, whereas NGC 612 is in the region of more actively star-forming galaxies (it is a LIRG) and FR II sources. The star-formation rate of NGC 1316 derived from the measurements in the 22 m band is yr-1, while that of NGC 612 is ten times higher. NGC 612 has an even higher specific star formation rate (SFR normalized to the stellar mass), which indicates that it is still actively forming its stellar population.
-
6.
Those two bright radio-lobed galaxies with low-luminosity optical AGN have very different mid-IR properties, which are likely related to their formation processes and evolutionary stages. The dust in NGC 1316 is likely due to the recent infall of one or several small gas-rich companions, while in NGC 612, gas must have been accreted more continuously to settle in a rotating star-forming disk. Radio continuum measurements from the literature (Morganti et al., 1993) indicate that the nucleus of NGC 1316 is currently more dormant than that of NGC 612. While the nucleus of NGC 1316 may be momentarily revived if the dusty material from the NW and SE clumps makes it to the center, the galaxy is very likely to evolve into a completely passive elliptical within no sign of past activity within a few 0.1 Gyrs, when the synchrotron emission from the nucleus and the lobes will have faded away. NGC 612, on the other hand, because of its own larger reservoir of molecular and atomic gas and the nearby presence of a gas-rich companion (Emonts et al., 2008) may grow a larger star-forming disk and/or sustain a level of activity in its nucleus. Numerical simulations of the growth of galaxies through accretion and mergers and high-resolution observations of dust and gas in radio-loud galaxies will help shed light on the evolution of those fascinating sources.
Acknowledgements.
We are very grateful to the referee for an exceptionally thorough review and many constructive comments. We thank Michelle Cluver, John H. Black and Roy Booth for their interest in this study and their support. We also thank Zolt Levay and Paul Goudfrooij for making their HST image of NGC 1316 available to us; Raffaella Morganti and Björn Emonts for sending us their Australia Telescope Compact Array radio map of NGC 612; Chien Peng for the help with the GALFIT program; Lauranne Lanz for advice on GALFIT and for sending us her FITS image of the high resolution VLA map of NGC 1316. The first author acknowledges funding from the SKA (Square Kilometre Array) Africa Postgraduate Bursary Programme and from MIDPREP, an exchange programme between two organizations in Europe (Chalmers University of Technology in Sweden and ASTRON in the Netherlands) and three South African universities (University of Stellenbosch, Rhodes University and University of Cape Town). He thanks the Hartebeesthoek Radio Astronomy Observatory, Onsala Space Observatory, and the University of Cape Town for assistance during his regular visits. This research has made use of the NASA/IPAC Extragalactic Database (NED) which is operated by the Jet Propulsion Laboratory, California Institute of Technology, under contract with the National Aeronautics and Space Administration.References
- Alatalo et al. (2014) Alatalo, K., Cales, S. L., Appleton, P. N., et al. 2014, ApJ, 794, L13
- Allamandola et al. (1999) Allamandola, L. J., Hudgins, D. M., & Sandford, S. A. 1999, ApJ, 511, L115
- Alonso-Herrero et al. (2006) Alonso-Herrero, A., Rieke, G. H., Rieke, M. J., et al. 2006, ApJ, 650, 835
- Asmus et al. (2014) Asmus, D., Hönig, S. F., Gandhi, P., Smette, A., & Duschl, W. J. 2014, MNRAS, 439, 1648
- Assef et al. (2013) Assef, R. J., Stern, D., Kochanek, C. S., et al. 2013, ApJ, 772, 26
- Bagchi et al. (2014) Bagchi, J., Vivek, M., Vikram, V., et al. 2014, ApJ, 788, 174
- Barnes & Hernquist (1991) Barnes, J. E. & Hernquist, L. E. 1991, ApJ, 370, L65
- Bellovary et al. (2013) Bellovary, J., Brooks, A., Volonteri, M., et al. 2013, ApJ, 779, 136
- Brown et al. (2014) Brown, M. J. I., Jarrett, T. H., & Cluver, M. E. 2014, PASA, 31, 49
- Calzetti (2013) Calzetti, D. 2013, Star Formation Rate Indicators, ed. J. Falcón-Barroso & J. H. Knapen, 419
- Calzetti et al. (2005) Calzetti, D., Kennicutt, R. C., Engelbracht, C. C., & SINGS Team. 2005, in Bulletin of the American Astronomical Society, Vol. 37, American Astronomical Society Meeting Abstracts, 1192
- Calzetti et al. (2007) Calzetti, D., Kennicutt, R. C., Engelbracht, C. W., et al. 2007, ApJ, 666, 870
- Cantiello et al. (2013) Cantiello, M., Grado, A., Blakeslee, J. P., et al. 2013, A&A, 552, A106
- Carlqvist (2010) Carlqvist, P. 2010, Ap&SS, 327, 267
- Cluver et al. (2014) Cluver, M. E., Jarrett, T. H., Hopkins, A. M., et al. 2014, ApJ, 782, 90
- Cutri et al. (2012) Cutri, R. M., Wright, E. L., Conrow, T., et al. 2012, Explanatory Supplement to the WISE All-Sky Data Release Products, Tech. rep.
- Dale et al. (2012) Dale, D. A., Aniano, G., Engelbracht, C. W., et al. 2012, ApJ, 745, 95
- Dale et al. (2005) Dale, D. A., Bendo, G. J., Engelbracht, C. W., et al. 2005, ApJ, 633, 857
- de Vaucouleurs et al. (1991) de Vaucouleurs, G., de Vaucouleurs, A., Corwin, Jr., H. G., et al. 1991, Third Reference Catalogue of Bright Galaxies. Volume I: Explanations and references. Volume II: Data for galaxies between 0h and 12h. Volume III: Data for galaxies between 12h and 24h.
- Draine et al. (2007) Draine, B. T., Dale, D. A., Bendo, G., et al. 2007, ApJ, 663, 866
- Duah Asabere et al. (2014) Duah Asabere, B., Horellou, C., Winkler, H., Jarrett, T., & Leeuw, L. 2014, ArXiv e-prints [arXiv:1409.2474]
- Ekers et al. (1978) Ekers, R. D., Goss, W. M., Kotanyi, C. G., & Skellern, D. J. 1978, A&A, 69, L21
- Ekers et al. (1989) Ekers, R. D., Wall, J. V., Shaver, P. A., et al. 1989, MNRAS, 236, 737
- Emonts et al. (2008) Emonts, B. H. C., Morganti, R., Oosterloo, T. A., et al. 2008, MNRAS, 387, 197
- Fanaroff & Riley (1974) Fanaroff, B. L. & Riley, J. M. 1974, MNRAS, 167, 31P
- Fasano et al. (1996) Fasano, G., Falomo, R., & Scarpa, R. 1996, MNRAS, 282, 40
- Feldmeier et al. (2007) Feldmeier, J. J., Jacoby, G. H., & Phillips, M. M. 2007, ApJ, 657, 76
- Galametz et al. (2014) Galametz, M., Albrecht, M., Kennicutt, R., et al. 2014, MNRAS, 439, 2542
- Galametz et al. (2012) Galametz, M., Kennicutt, R. C., Albrecht, M., et al. 2012, MNRAS, 425, 763
- Geldzahler & Fomalont (1984) Geldzahler, B. J. & Fomalont, E. B. 1984, AJ, 89, 1650
- Gopal-Krishna & Wiita (2000) Gopal-Krishna & Wiita, P. J. 2000, A&A, 363, 507
- Goss et al. (1980) Goss, W. M., Danziger, I. J., Fosbury, R. A. E., & Boksenberg, A. 1980, MNRAS, 190, 23P
- Goudfrooij et al. (2004) Goudfrooij, P., Gilmore, D., Whitmore, B. C., & Schweizer, F. 2004, ApJ, 613, L121
- Govoni et al. (2000) Govoni, F., Falomo, R., Fasano, G., & Scarpa, R. 2000, A&A, 353, 507
- Grillmair et al. (1999) Grillmair, C. J., Forbes, D. A., Brodie, J. P., & Elson, R. A. W. 1999, AJ, 117, 167
- Hardcastle et al. (2007) Hardcastle, M. J., Evans, D. A., & Croston, J. H. 2007, MNRAS, 376, 1849
- Helou et al. (2004) Helou, G., Roussel, H., Appleton, P., et al. 2004, ApJS, 154, 253
- Holt et al. (2007) Holt, J., Tadhunter, C. N., González Delgado, R. M., et al. 2007, MNRAS, 381, 611
- Horellou et al. (2001) Horellou, C., Black, J. H., van Gorkom, J. H., et al. 2001, A&A, 376, 837
- Hota et al. (2011) Hota, A., Sirothia, S. K., Ohyama, Y., et al. 2011, MNRAS, 417, L36
- Hurley-Walker et al. (2015) Hurley-Walker, N., Johnston-Hollitt, M., Ekers, R., et al. 2015, MNRAS, 447, 2468
- Ichikawa et al. (2012) Ichikawa, K., Ueda, Y., Terashima, Y., et al. 2012, ApJ, 754, 45
- Inskip et al. (2010) Inskip, K. J., Tadhunter, C. N., Morganti, R., et al. 2010, MNRAS, 407, 1739
- Iyomoto et al. (1998) Iyomoto, N., Makishima, K., Tashiro, M., et al. 1998, ApJ, 503, L31
- Jarrett et al. (2011) Jarrett, T. H., Cohen, M., Masci, F., et al. 2011, ApJ, 735, 112
- Jarrett et al. (2012) Jarrett, T. H., Masci, F., Tsai, C. W., et al. 2012, AJ, 144, 68
- Jarrett et al. (2013) Jarrett, T. H., Masci, F., Tsai, C. W., et al. 2013, AJ, 145, 6
- Kaneda et al. (2007) Kaneda, H., Onaka, T., & Sakon, I. 2007, ApJ, 666, L21
- Kaneda et al. (2008) Kaneda, H., Onaka, T., Sakon, I., et al. 2008, ApJ, 684, 270
- Kennicutt et al. (2003a) Kennicutt, R. C., Bendo, G., Engelbracht, C., et al. 2003a, in Bulletin of the American Astronomical Society, Vol. 35, American Astronomical Society Meeting Abstracts, 1351
- Kennicutt et al. (2011) Kennicutt, R. C., Calzetti, D., Aniano, G., et al. 2011, PASP, 123, 1347
- Kennicutt et al. (2003b) Kennicutt, Jr., R. C., Armus, L., Bendo, G., et al. 2003b, PASP, 115, 928
- Knapp et al. (1989) Knapp, G. R., Guhathakurta, P., Kim, D.-W., & Jura, M. A. 1989, ApJS, 70, 329
- Lanz et al. (2010) Lanz, L., Jones, C., Forman, W. R., et al. 2010, ApJ, 721, 1702
- Ledlow et al. (2001) Ledlow, M. J., Owen, F. N., Yun, M. S., & Hill, J. M. 2001, ApJ, 552, 120
- Leitherer et al. (1999) Leitherer, C., Schaerer, D., Goldader, J. D., et al. 1999, ApJS, 123, 3
- L’Huillier et al. (2012) L’Huillier, B., Combes, F., & Semelin, B. 2012, A&A, 544, A68
- Mackie & Fabbiano (1998) Mackie, G. & Fabbiano, G. 1998, AJ, 115, 514
- Masci (2013) Masci, F. 2013, ICORE: Image Co-addition with Optional Resolution Enhancement, Astrophysics Source Code Library
- Masci & Fowler (2009) Masci, F. J. & Fowler, J. W. 2009, in Astronomical Society of the Pacific Conference Series, Vol. 411, Astronomical Data Analysis Software and Systems XVIII, ed. D. A. Bohlender, D. Durand, & P. Dowler, 67
- McNeil-Moylan et al. (2012) McNeil-Moylan, E. K., Freeman, K. C., Arnaboldi, M., & Gerhard, O. E. 2012, A&A, 539, A11
- Morganti et al. (1993) Morganti, R., Killeen, N. E. B., & Tadhunter, C. N. 1993, MNRAS, 263, 1023
- Nagar et al. (2001) Nagar, N. M., Wilson, A. S., & Falcke, H. 2001, ApJ, 559, L87
- Onaka et al. (2007) Onaka, T., Matsuhara, H., Wada, T., et al. 2007, PASJ, 59, 401
- Peng et al. (2002) Peng, C. Y., Ho, L. C., Impey, C. D., & Rix, H.-W. 2002, AJ, 124, 266
- Prandoni et al. (2012) Prandoni, I., Laing, R. A., de Ruiter, H. R., & Parma, P. 2012, Journal of Physics Conference Series, 372, 012067
- Ramos Almeida et al. (2012) Ramos Almeida, C., Bessiere, P. S., Tadhunter, C. N., et al. 2012, MNRAS, 419, 687
- Rieke et al. (2009) Rieke, G. H., Alonso-Herrero, A., Weiner, B. J., et al. 2009, ApJ, 692, 556
- Rujopakarn et al. (2012) Rujopakarn, W., Rieke, G. H., Papovich, C. J., et al. 2012, ApJ, 755, 168
- Sadler et al. (2014) Sadler, E. M., Ekers, R. D., Mahony, E. K., Mauch, T., & Murphy, T. 2014, MNRAS, 438, 796
- Sage & Galletta (1993) Sage, L. J. & Galletta, G. 1993, ApJ, 419, 544
- Sanders & Mirabel (1996) Sanders, D. B. & Mirabel, I. F. 1996, ARA&A, 34, 749
- Schweizer (1980) Schweizer, F. 1980, ApJ, 237, 303
- Schweizer (1981) Schweizer, F. 1981, ApJ, 246, 722
- Sérsic (1968) Sérsic, J. L. 1968, Atlas de galaxias australes
- Shi et al. (2007) Shi, Y., Rieke, G. H., Hines, D. C., Gordon, K. D., & Egami, E. 2007, ApJ, 655, 781
- Shipley et al. (2016) Shipley, H. V., Papovich, C., Rieke, G. H., Brown, M. J. I., & Moustakas, J. 2016, ArXiv e-prints [arXiv:1601.01698]
- Silva et al. (1998) Silva, L., Granato, G. L., Bressan, A., & Danese, L. 1998, ApJ, 509, 103
- Singh et al. (2015) Singh, V., Ishwara-Chandra, C. H., Sievers, J., et al. 2015, MNRAS, 454, 1556
- Smith et al. (2007) Smith, J. D. T., Draine, B. T., Dale, D. A., et al. 2007, ApJ, 656, 770
- Stickel et al. (2004) Stickel, M., Lemke, D., Klaas, U., Krause, O., & Egner, S. 2004, A&A, 422, 39
- Stritzinger et al. (2010) Stritzinger, M., Burns, C. R., Phillips, M. M., et al. 2010, AJ, 140, 2036
- Tadhunter et al. (2014) Tadhunter, C., Dicken, D., Morganti, R., et al. 2014, MNRAS, 445, L51
- Taylor et al. (2011) Taylor, E. N., Hopkins, A. M., Baldry, I. K., et al. 2011, MNRAS, 418, 1587
- Temi et al. (2005) Temi, P., Mathews, W. G., & Brighenti, F. 2005, ApJ, 622, 235
- Treister et al. (2012) Treister, E., Schawinski, K., Urry, C. M., & Simmons, B. D. 2012, ApJ, 758, L39
- Véron-Cetty & Véron (2001) Véron-Cetty, M. P. & Véron, P. 2001, A&A, 375, 791
- Wagner et al. (2016) Wagner, A. Y., Bicknell, G. V., Umemura, M., Sutherland, R. S., & Silk, J. 2016, Astronomische Nachrichten, 337, 167
- Welker et al. (2015) Welker, C., Dubois, Y., Devriendt, J., et al. 2015, ArXiv e-prints [arXiv:1502.05053]
- Wright et al. (2010) Wright, E. L., Eisenhardt, P. R. M., Mainzer, A. K., et al. 2010, AJ, 140, 1868
- Xilouris et al. (2004) Xilouris, E. M., Madden, S. C., Galliano, F., Vigroux, L., & Sauvage, M. 2004, A&A, 416, 41
- Yoon et al. (2011) Yoon, I., Weinberg, M. D., & Katz, N. 2011, MNRAS, 414, 1625