H-ATLAS: A Candidate High Redshift Cluster/Protocluster of Star-Forming Galaxies
Abstract
We investigate the region around the Planck-detected z=3.26 gravitationally lensed galaxy HATLAS J114637.9-001132 (hereinafter HATLAS12-00) using both archival Herschel data from the H-ATLAS survey and using submm data obtained with both LABOCA and SCUBA2. The lensed source is found to be surrounded by a strong overdensity of both Herschel-SPIRE sources and submm sources. We detect 17 bright (S7 mJy) sources at 4 closer than 5 arcmin to the lensed object at 850/870m. Ten of these sources have good cross-identifications with objects detected by Herschel-SPIRE which have redder colours than other sources in the field, with 350m flux 250m flux, suggesting that they lie at high redshift. Submillimeter Array (SMA) observations localise one of these companions to 1 arcsecond, allowing unambiguous cross identification with a 3.6 and 4.5 m source. The optical/near-IR spectral energy distribution (SED) of this source is measured by further observations and found to be consistent with , but incompatible with lower redshifts. We conclude that this system may be a galaxy cluster/protocluster or larger scale structure that contains a number of galaxies undergoing starbursts at the same time.
keywords:
galaxies:starburst; submillimetre:galaxies; galaxies:high redshift; galaxies:clusters1 Introduction
The early history of galaxy clusters is a poorly constrained aspect of galaxy and large scale structure formation. Hierarchical clustering models predict that massive elliptical galaxies will form in the cores of what will become the most massive galaxy clusters today, but the epoch of the bulk of star formation for these galaxies is unclear. Observations of high redshift clusters (z=1—1.5) by the ISCS project (IRAC Shallow Cluster Survey, Eisenhardt et al., 2008) suggest that this is at , and the presence of well defined red sequences of galaxies in clusters out to z2 (Andreon et al. 2011; Gobat et al. 2011; Santos et al. 2011; Pierini et al. 2012) supports this conclusion. Theoretical models by Granato et al. (2004) suggest that forming clusters will go through a phase in which multiple members will undergo near-simultaneous massive bursts of star formation. The spectral energy distribution of these objects would be dominated by the far-IR, as is the case for local massive starbursts (eg. Clements et al., 2010). A galaxy cluster or protocluster (we use the term protocluster to indicate a structure that has yet to become virialised) going through such a formative phase would appear as a clump of dusty protospheroidal galaxies, and might be detected by observations in the far-IR and submm bands. Hints of such objects may already have been found by Spitzer (Magliocchetti et al., 2007) and SCUBA (Ivison et al., 2000; Priddey et al., 2008; Stevens et al., 2010 and references therein). A recent study by Ivison et al. (2013) has uncovered a group of HLIRGs and ULIRGs at z=2.41 thought to be the progenitor of a 10 cluster. At still higher redshifts, the highest redshift protocluster currently known, at z5.3 (Capak et al., 2011; Riechers et al. 2010), and a group of objects associated with a z=5 quasar (Husband et al., 2013) both contain at least one submm luminous object, while the best studied group of high z submm-luminous sources to date is probably the four objects associated with a source in the GOODS-North field designated GN20, all lying at z=4 (Daddi et al., 2009; Carilli et al., 2011), though this group is extended over a broad range of redshifts .
Large area surveys with the Herschel Space Observatory (Pilbratt et al., 2010), SCUBA2 (Dempsey et al., 2013; Holland et al., 2013), or the Planck all sky survey (Planck Collaboration, 2011; Negrello et al., 2005) are capable of finding such objects. Several studies have been undertaken combining Planck and Herschel data to identify candidate high redshift clusters while others have used Herschel data (eg Valtchanov et al., 2013; Dannerbauer et al., 2014; Rigby et al., 2014) or SCUBA2 data (Ma et al., 2015; Casey et al., 2015) alone or in combination (Noble et al., 2013). Clements et al. (2014) found a number of candidate objects in the HerMES (Oliver at al., 2012) survey at z, while Herschel followup observations of Planck all sky sources (Planck Collaboration, 2015) have identified at least one z1.7 cluster of dusty galaxies and large numbers of candidates. The sources uncovered in HerMES include two clusters lying at and , confirmed by the presence of a red sequence, and two lying at and confirmed through photometric redshift analysis. Total star formation rates for these HerMES clusters, derived from the Herschel fluxes of their members, range from 1000 to 10000 . The highest redshift candidate cluster of dusty galaxies so far, though, has emerged from analysis of Planck sources seen in the first release of data from the H-ATLAS survey (Herranz et al., 2013). This paper describes the results of followup observations of this source.
In the next section we describe the H-ATLAS survey and the properties of the source HATLAS J114637.9-001132 (referred to in the rest of this paper as HATLAS12-00, after Fu et al., 2012) uncovered by Herranz et al. (2013) through matching the Planck Early Release Compact Source Catalog (ERCSC; Planck Collaboration, 2011) to the Phase 1 H-ATLAS maps and catalogs (Valiante et al., in prep). In Section 3 we describe the followup observations of this source, obtained using a variety of telescopes, together with the reduction and analysis of this data. The results of these observations are discussed in Section 4, while Section 5 discusses the nature of the sources found in these observations. Our conclusions are summarised in Section 6. Throughout this paper we assume a standard concordance cosmology with and .
2 H-ATLAS and the z=3.26 Lensed Source HATLAS12-00
2.1 The H-ATLAS Survey
The Herschel Astrophysical Terahertz Large Area Survey (H-ATLAS, Eales et al., 2010) uses the PACS (Poglitsch et al., 2010) and SPIRE (Griffin et al., 2010) instruments on the Herschel Space Observatory (Pilbrat et al., 2010) to survey a total of 616 sq. deg. of sky, making it the largest area extragalactic survey executed by Herschel. PACS observations are made at 100 and 160m while SPIRE covers the 250, 350 and 500m bands. The instrumental beams have full width half-maximum (FWHM) values of 8.7, 13.1, 18.1, 25.2 and 36.9 arcseconds respectively, from 100 to 500m, with 5 point source sensitivities of 132, 126, 32, 36 and 45 mJy, taking into account confusion (6-8mJy in the SPIRE bands) and instrumental noise. Map making and data reduction for the H-ATLAS survey are discussed in detail in Pascale et al. (2011) and Ibar et al. (2010), and source detection and catalogue generation are described in Rigby et al. (2011).
The fields covered by H-ATLAS include the Northern and Southern Galactic Poles (NGP and SGP) and three fields at DEC 0 that were selected to match the three fields of the Galaxy And Mass Assembly (GAMA, Driver et al., 2011) survey, which provides plentiful redshifts for z0.5 optically selected galaxies. The phase 1 H-ATLAS data release includes the GAMA fields (Valiante et al. in prep; Bourne et al., in prep.), while further data releases will cover the larger NGP and SGP survey areas. The maps that form the basis for this release are background subtracted and convolved with a matched filter (Chapin et al. 2011) calculated to produce the maximum signal-to-noise for sources that are unresolved in the un-smoothed images. Sources are then selected from these maps using the MADX algorithm (Maddox et al., 2010; Maddox et al. in prep). Comparison of the results of this process for the match-filtered phase 1 catalogs and the un-match-filtered SDP catalogs (Rigby et al., 2011) show clear but modest improvements in both S/N and positional accuracy (see Valiante et al., in prep, for more details of the data reduction methods and comparison with previous results).
2.2 The Lensed Source HATLAS12-00
Herranz et al. (2013) searched for cross identifications between Planck ERCSC (Planck Collaboration, 2011) and phase 1 release H-ATLAS sources (roughly 25% of the final 616 sq. deg.). 28 matches were found, most of which were associated with nearby quiescent galaxies detected in the optical (Herranz et al., 2013) or with extended cirrus dust structures in our own galaxy. One source, however, had no bright optical counterpart and showed no signs of cirrus contamination. The submm colours of this Planck ERCSC source are unusually red (see Fig 12 of Herranz et al. 2013) suggesting that it might lie at high redshift. Examination of the Herschel images from H-ATLAS show that it is associated with a clump of sources, several of which have red Herschel colours (ie. 350m flux 250m flux, see below), grouped around a single bright, optically unidentified Herschel source, designated HATLAS12-00, whose flux peaks at 350m.
HATLAS12-00 had already been identified as a candidate gravitationally lensed galaxy as a result of its high submm flux (i.e. mJy), red Herschel colours and the lack of a bright optical or radio counterpart (see eg. Negrello et al. 2010 for a discussion of the selection of lens candidates in H-ATLAS and other Herschel surveys). This source was therefore observed spectroscopically in the submm. A CO spectroscopic redshift of 3.26 was first suggested by Z-spec (Bradford et al., 2004) observations, then subsequently confirmed by observations by the CARMA interferometer (Leeuw et al., in prep) and the Zpectrometer instrument (Harris et al., 2007) on the Greenbank Telescope (Harris et al., 2012; see also Fu et al., 2012). Additional followup observations in the optical, near-IR, submm and other wavelengths were targeted at the lensed source and the foreground objects responsible for the lensing, resulting in detailed analyses of this lensing system by Fu et al. (2012) and Bussmann et al. (2013). Their conclusions are that the source HATLAS12-00 is subject to gravitational lensing, with a magnification of 9.60.5 in both the submm continuum and CO, and 16.70.8 in the K’ band, by two foreground galaxies, one at a spectroscopically determined redshift of 1.22, and another with photometry suggesting that it lies at a similar redshift. The submm photometry of HATLAS12-00 at 890m acquired with the Submillimeter Array (SMA) as part of this programme (Fu et al., 2012; Bussmann et al., 2013) is fully consistent with the 870m and 850m fluxes derived for this source from the LABOCA and SCUBA2 data to be presented here. The spectral energy distribution (SED) of the lensed source, after correcting for the lensing amplification, is well matched by the optically thick SED model for Arp220 from Rangwala et al. (2011), with a lensing-corrected far-IR luminosity of 1.2, and an implied star formation rate of 1400 300 yr-1. In many ways the unlensed properties of this object match those of the broader population of bright submm selected galaxies first discovered by the SCUBA submm imager (see eg. Chapman et al., 2005; Clements et al., 2008; Michałowski et al., 2010). The unlensed 870m flux of this object would be 7.7mJy.
3 Observations of the HATLAS12-00 Field
3.1 LABOCA Observations
We observed a field of diameter 600 arcsec around the position of the lensed source HATLAS12-00 with the LABOCA 870m imager on the APEX telescope (the Atacama Pathfinder EXperiment, Güsten et al., 2006), during ESO programme 088.A-0929. APEX is a 12m diameter submm telescope situated in the Atacama desert, Chile. LABOCA is a multichannel continuum bolometer array mounted on APEX (Siringo et al, 2009) used for continuum imaging at a central wavelength of 870m. It has 295 bolometer detectors arranged in concentric hexagons giving a total instantaneous field of view of 11.4 arcmin. The angular resolution is 18.6 arcsec (FWHM) and the channels are separated by 36 arcsec meaning that the field of view is undersampled by the array. We therefore adopted a standard spiral scanning pattern to produce a fully sampled map of the instrumental field of view.
Observations were carried out over five nights from 21 Nov. 2011 to 25 Nov. 2011. The target field was observed for a total integration time of 20 hours, in continuous scans of 7 minutes each. Atmospheric opacities for our observations ranged from 0.158 to 0.357, with a median . Standard calibrators were observed during the observing run, in-between scientific scans, and included the planets Mars and Uranus, and the stars CW Leonis, B13134 and N2071IR. The radio source J1058+016 was used as a pointing calibrator throughout the whole observing run.
Data reduction used the official data reduction package BoA111Bolometer Array Analysis Software: www3.mpifr-bonn.mpg.de/div/submmtech/software/boa/boa_main.html. This provides a dedicated pipeline for the processing of LABOCA data and includes automated flux calibration, flatfielding, opacity correction, noise removal, and despiking of the bolometer timestreams. In addition, BoA provides a number of scripts for different reduction schemes, with preset parameters that can be modified by the user. We ran BoA using a modified version of the default script reduce-map-weaksource.boa, where we modify the low-frequency filter window to allow less aggressive filtering: this proved necessary because of the presence of the bright lensed source HATLAS12-00 at the centre of the observed field, which generated significant negative lobes if too narrow a filter was used. We found iteratively that a filtering window from 0.25 to 0.4 (compared to the default 0.3-0.35 interval) provided a satisfactory result while efficiently filtering the low-frequency noise. These values are instrumental parameters related to the details of the data reduction software, and are discussed further in section 3.8.4 of the BoA manual (Schuller et al., 2010). The scans are then variance-weighted and coadded to provide final maps of flux density and noise. The final reduced map provides a useful field of 11 9 arcmin in size with typical 1 noise ranging from 1.4mJy to 2.5mJy.
Individual sources are extracted from the map using a source-finding algorithm which identifies peaks in a smoothed signal-to-noise map, produced by convolving the flux density map, weighted by the inverse of the variance, with the 18.6 arcsec full width half maximum (FWHM) beam. Peaks with a signal-to-noise ratio of at least 2.5 were selected as candidate sources, their flux (error) was then calculated as the value of the beam-convolved flux density (noise) map at the position of the peak. We detect seven peaks above a 4 threshold, four of which have S/N 5 (see Table 1). One of these, as expected, is the lensed source HATLAS12-00.
| Name | RA | Dec | F870 | S/N | Comments |
|---|---|---|---|---|---|
| Deg J2000 | Deg J2000 | mJy | |||
| LABOCA_1 | 176.658858 | -0.191142 | 79.4 2.5 | 32.1 | 5” from HATLAS12-00, lensed source |
| LABOCA_2 | 176.674044 | -0.226574 | 14.8 1.9 | 7.9 | 136” from lens; 5” from HATLASJ114641.4-001332 |
| LABOCA_3 | 176.679105 | -0.137993 | 10.3 1.6 | 6.6 | 207” from lens |
| LABOCA_4 | 176.598117 | -0.183549 | 10.8 2.1 | 5.1 | 220” from lens; 2” from HATLASJ114623.5-001058 |
| LABOCA_5 | 176.684167 | -0.145586 | 7.3 1.5 | 4.9 | 190” from lens; 6” from HATLASJ114644.6-000840 |
| LABOCA_6 | 176.608240 | -0.155709 | 8.6 2.1 | 4.2 | 223” from lens |
| LABOCA_7 | 176.742378 | -0.196203 | 9.4 2.3 | 4.0 | 301” from lens |
3.2 SCUBA2 Observations
A field of diameter 700 arcsec around the position of HATLAS12-00 was observed with the SCUBA2 850 & 450m imager (Holland et al., 2013) on the James Clerk Maxwell Telescope (JCMT) on Mauna Kea as part of a programme to observe candidate clusters of dusty galaxies detected through cross matching Planck and Herschel sources. SCUBA2 provides an angular resolution of 14.5 arcsec (FWHM) at 850m.
Observations for the programme were carried out over a five night period from 8 April 2013 to 12 April 2013, but the observations of HATLAS12-00 discussed here were taken only on 8th and 11th April. Since the target for these observations was the immediate region around the lensed source, we used the DAISY observing mode, which scans the detector arrays in a ‘spirograph’ pattern around the targeted position (in this case HATLAS12-00). This optimises the sensitivity in the central regions of the field, but provides reasonable sensitivity over a larger field. HATLAS12-00 was observed for four separate observing blocks, each of 30 minutes duration, for a total integration time of two hours. Three of these blocks were observed on 8th April, and one on 11th April. Observing conditions were good (grade 2 or upper grade 3, corresponding to 1 - 2mm of precipitable water vapour) for all of these observations. Standard observatory calibration observations were taken on both nights.
Data reduction used the standard SMURF package (Chapin et al. 2013) following the procedures outlined in the SCUBA2 Data Reduction Cookbook (Thomas, 2012). The separate scans were reduced using the dynamic iterative mapmaker makemap. These were then combined using a noise-weighted optimal method using the MOSAIC_JCMT_IMAGES recipe in the PICARD environment. Since we are interested in unresolved, faint point sources, we used the SCUBA2_MATCHED_FILTER recipe, which removed large angular scale variations in this final map by calculating a smoothed map with a 30 arcsec kernel, subtracting this, and then convolving the map with the 850m beam. The resulting image then had the higher-noise edge regions cropped, limiting it to a circular field with diameter 700 arcsec. Calibration from observed detector power to detected flux densities used the standard observatory determined flux calibration factor of 537 Jy/pW/beam at 850m. Noise in our final image ranged from 1=1.3mJy in the centre to 1=2.7mJy at the edges.
Individual sources were extracted from the map by identifying peaks in the S/N map calculated by dividing the final beam convolved map by the noise map. Applying a 4 threshold for detection, we find a total of fourteen 850m sources. Six of these, including the lensed source, have a S/N 5 (see Table 2).
Observing conditions were not good enough for the 450m data simultaneously taken with the 850m observations to be useful.
| Name | RA | Dec | F850 | S/N | Comments |
|---|---|---|---|---|---|
| Deg J2000 | Deg J2000 | mJy | |||
| SCUBA2_1 | 176.6068780 | -0.2351671 | 10.6 2.1 | 5.0 | Out of LABOCA field; 243” from lens; 4” from HATLAS_78812 |
| SCUBA2_2 | 176.6161110 | -0.1266438 | 9.6 2.3 | 4.2 | 281” from lens |
| SCUBA2_3 | 176.6811353 | -0.1372072 | 10.5 2.2 | 4.7 | 7.8” from LABOCA_3; 213” from lens |
| SCUBA2_4 | 176.6749951 | -0.1491695 | 8.6 2.0 | 4.2 | 165” from lens |
| SCUBA2_5 | 176.6860210 | -0.1568639 | 10.5 2.0 | 5.3 | 160” from lens |
| SCUBA2_6 | 176.5883331 | -0.1638748 | 9.9 2.5 | 4.0 | 273” from lens |
| SCUBA2_7 | 176.6155570 | -0.1716642 | 8.0 2.0 | 4.1 | 172” from lens |
| SCUBA2_8 | 176.6477698 | -0.1805539 | 7.0 1.4 | 5.0 | 57” from lens; 4” from HATLASJ114635.1-001048 |
| SCUBA2_9 | 176.6173862 | -0.1857557 | 10.6 1.8 | 6.0 | 151” from lens; 8” from HATLASJ114628.6-001114 |
| SCUBA2_10 | 176.6587577 | -0.1919366 | 80.0 1.3 | 59.7 | 2.9” from LABOCA_1; 0” from lens, lensed source |
| SCUBA2_11 | 176.6524809 | -0.2122232 | 6.4 1.5 | 4.4 | 76” from lens |
| SCUBA2_12 | 176.6415322 | -0.2196134 | 7.5 1.6 | 4.7 | 117” from lens |
| SCUBA2_13 | 176.6738450 | -0.2257691 | 10.0 1.7 | 5.8 | 3.0” from LABOCA_2; 133” from lens |
| SCUBA2_14 | 176.6661112 | -0.2338934 | 7.3 1.8 | 4.0 | 153” from lens |
3.3 Spitzer Observations
Spitzer-IRAC 3.6 and 4.5 m staring mode observations of the extended region covering the clump of sub-mm galaxies around HATLAS12-00 were carried out during the warm mission. In staring mode, simultaneous observations at 3.6 and 4.5 m are offset from each other by 6.8 arcminutes. Due to the offset, 0.05 deg2 of the targeted area has imaging data at both 3.6 and 4.5 m, and the remainder split between 3.6 and 4.5 m coverage. The total exposure time is 1600 seconds per pixel in each filter with the four-point dithered map taking over four hours to complete. Data reduction and mosaicking was performed on the Corrected Basic Calibrated Data (cBCD) provided by the Spitzer Science Center using MOPEX (MOsaicker and Point source EXtractor; Makovoz & Marleau, 2005). The final mosaicked images have 0.6 0.6 arcsecond pixels and the FWHM of the IRAC point spread function (PSF) at 3.6 and 4.5m is 1.66 and 1.72 arcseconds, respectively. Source detection is performed with SEXTRACTOR (Bertin & Arnouts 1996) and detected sources are required to comprise at least three contiguous pixels with fluxes at least 1.5 above the local background. Photometry was measured in 3.8 arcsecond diameter apertures with the APPHOT task in IRAF. The advantage of APPHOT is that the photometry is measured in fixed apertures at specified source positions. The measured aperture photometry was corrected to total fluxes, assuming point-source profiles, and using the calibration derived by the SWIRE team for IRAC data with multiplicative correction factors of 1.36 and 1.40 at 3.6 and 4.5 m, respectively (Surace et al. 2005).
3.4 Submillimetre Array Observations
Four regions around HATLAS12-00 were observed in track sharing mode at the Submillimeter Array on Mauna Kea in Compact configuration on 2013 April 7 UTC and 2013 May 16 UTC. The SIS receivers were tuned to an LO frequency of 270.0 GHz. Both observations were made in good conditions, with 0.07 and 10-25% humidity. An additional track in SubCompact configuration was obtained on 2013 May 13 UTC in slightly worse conditions (0.07 and only 6 antennas) but was combined with the other two tracks for a slight improvement in SNR and a final beam of about 2.7 x 2.3 arcsec. The targets for these observations were sources LABOCA_2, LABOCA_3, LABOCA_4 and LABOCA_5, with predicted 270GHz fluxes of 8, 4, 6 and 4mJy respectively.
The SMA data were calibrated using the MIR software package developed at Caltech and modified for the SMA. Gain calibration was performed using the nearby quasars 3c279 and 3c273. Absolute flux calibration was performed using realtime measurements of the system temperatures with observations of Titan to set the scale, and bandpass calibration was done using 3c279 and 3c84.
The data were imaged using MIRIAD (Sault et al., 1995), and further analysis carried out using the KARMA software package. The noise in the final co-added maps ranged from 1-1.3 mJy. A secure source, , was only detected in the map of LABOCA_2 with a flux of 4.2 1 mJy. It is also detected in both the individual (uncombined) Compact and SubCompact maps. The brightest sources in the SMA maps associated with the positions of the other LABOCA sources were 3.81.3, 4.31.3 and 3.11.1 mJy for LABOCA_3, LABOCA_4 and LABOCA_5 respectively, which are compatible with the fluxes predicted for the sources.
3.5 Optical and Near-Infrared Observations
Near-IR observations in the J and K’ bands were taken of a 150 x 150 arcsecond region around the position of the SMA-identified source LABOCA_2 (see above) using the ISAAC instrument on the VLT. J and K’ observations were taken on the 19th April 2013 and 12th March 2013 respectively. Observing conditions for both these observations were good with seeing measured at 0.7 and 0.6 arcseconds respectively. Total on-source integration times were 3240s at J and 1536s at K’. These observations were conducted in service mode. The data were reduced using the standard ESO processing pipeline, and the images were astrometrically and photometrically calibrated using cross identifications with 2MASS sources.
Optical observations using the ACAM imager on the William Herschel Telescope were used to provide a deep, white light (ie. filter free) image of the field around the HATLAS12-00 lens. These observations are discussed in detail in Fu et al. (2012) and reach a 5 detection limit comparable to .
4 Observational Results
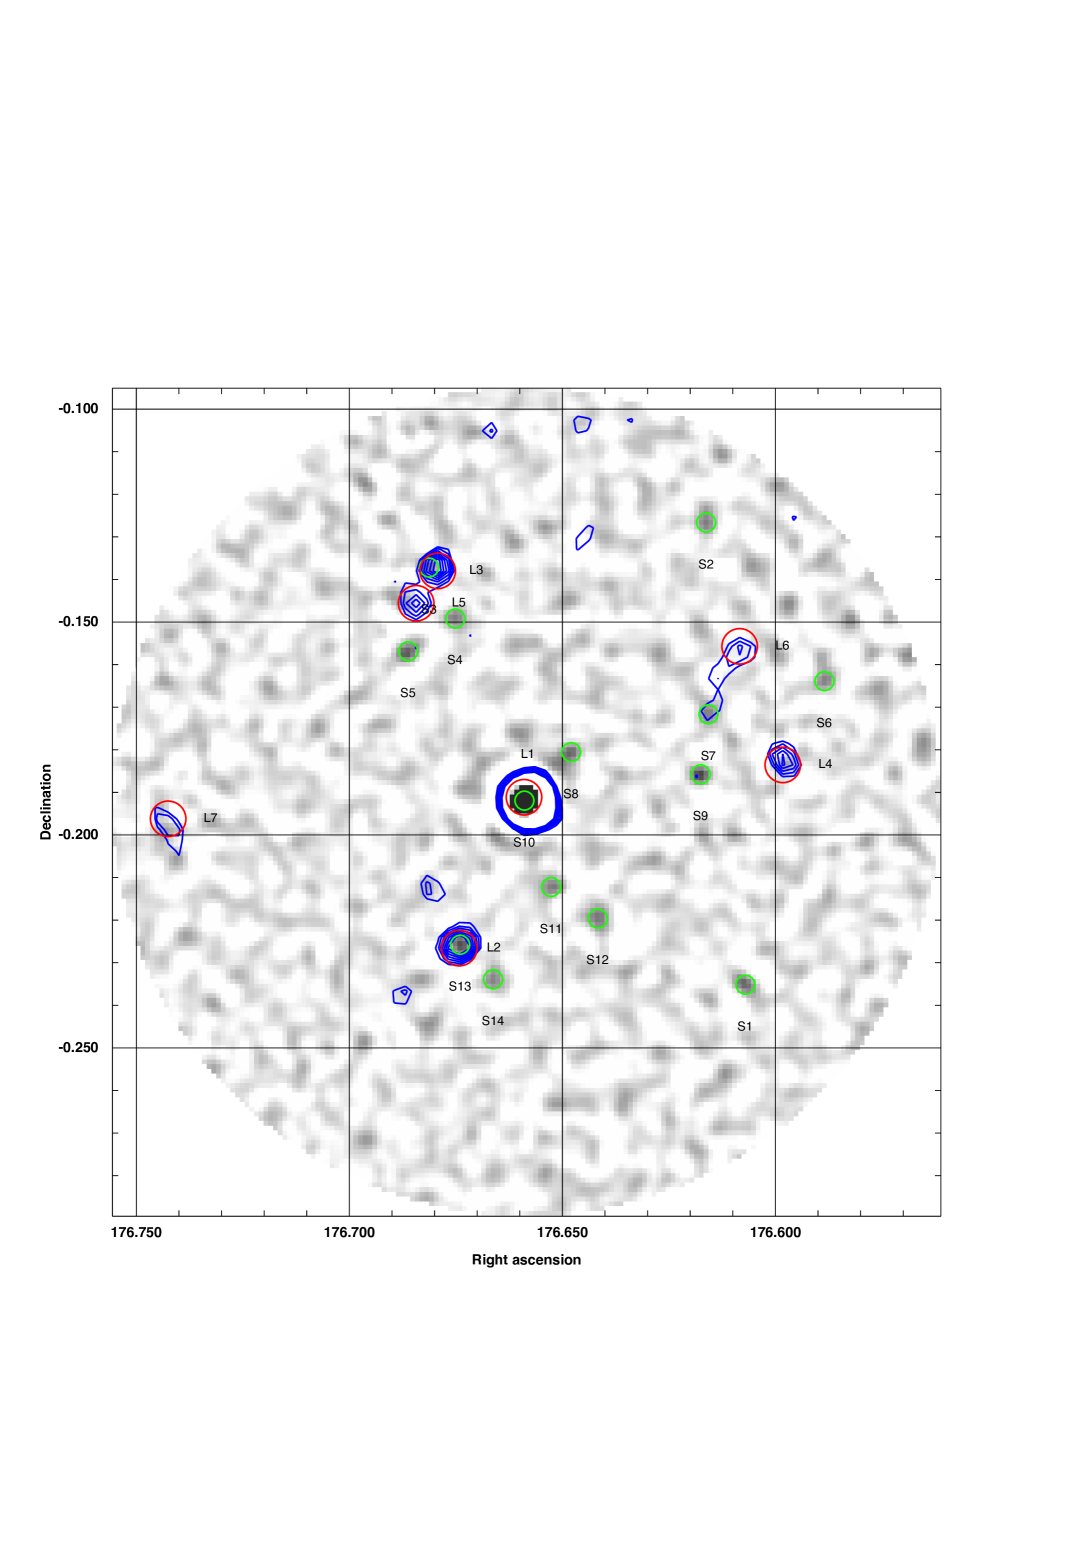
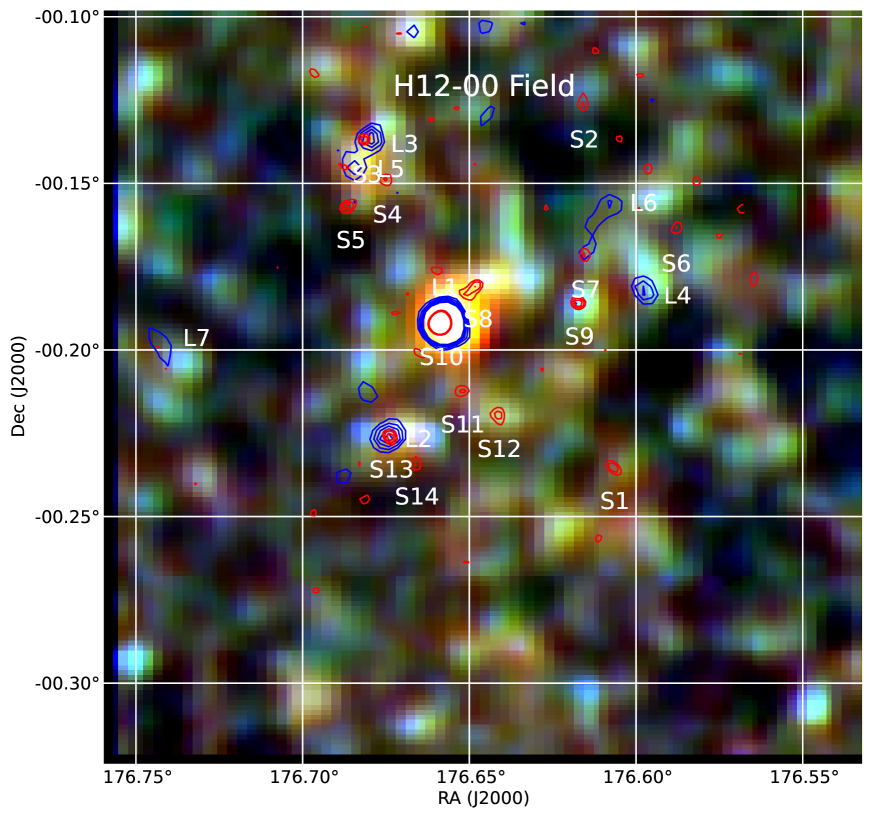
The SCUBA2 850m image is shown in Fig 1, with the LABOCA S/N contours overlaid. In Fig 2 we present a three colour SPIRE image of this field (blue for 250m, green for 350m and red for 500m) with the positions of the SCUBA2 and LABOCA detected sources indicated. The lensed source is clearly detected, and a total of 17 other LABOCA and/or SCUBA2 sources are also found with S/N .
4.1 Cross Identification with SPIRE Sources
To obtain cross identifications and SPIRE flux measurements for the sources found by LABOCA and SCUBA2 we examine both the SPIRE catalogs produced by the H-ATLAS team and the SPIRE maps themselves. We first compare the 850/870m sources identified by SCUBA2 and LABOCA to the officially released H-ATLAS source catalog (Valiante et al., in prep). This catalog includes sources detected at significance in at least one SPIRE band. This comparison yields six clear identifications, including the lensed source, with separations between the SPIRE and submm sources of 9 arcseconds or less (see Table 3), consistent with the expected combined positional uncertainties of these datasets of 10 arcseconds. The fluxes and H-ATLAS names for these sources are reported in Tables 1, 2 and 3 as appropriate. Given the density of 850m sources on the sky and our matching radius we expect only 0.07 false positive identifications of a SPIRE source with a submm source over the entire catalog of 18 submm sources. If we instead use the enhanced submm source density over the field that we find in this region (see Section 4.3) then the number of false positives predicted rises to 0.3. We can thus consider these identifications reliable.
We also compare the LABOCA and SCUBA2 source lists to a supplementary H-ATLAS catalog generated using the same MADX algorithm (Maddox et al., 2010; Maddox et al. in prep) as the main catalog but extending down to 3 significance detections rather than the 5 used for the main catalog. Cross matching with this extended catalog provides a further five SPIRE identifications for our LABOCA and/or SCUBA2 sources with separations of 9 arcseconds or less. Identifications with this supplementary catalog are indicated in Tables 1, 2 and 3 as appropriate. One further plausible cross identification, with a separation of 10.8 arcseconds is also found, for SCUAB2_2. For these supplementary identifications and for submm sources not directly associated with a catalogued SPIRE source, we estimate their SPIRE fluxes by extracting the fluxes at the LABOCA or SCUBA2 positions from the background-subtracted match-filtered SPIRE maps provided by H-ATLAS. Source fluxes from SPIRE, LABOCA and/or SCUBA2 are shown in Table 3.
One source, SCUBA2_3 (which is cross identified with LABOCA_3 and an H-ATLAS supplementary source) lies fairly close to a second SPIRE source (LABOCA_5) with a separation of 17”. This is comparable to the size of the SPIRE 250m beam and smaller than the 350 or 500m beams. The immediate neighbourhood of this source also encompasses the sources SCUBA2_5 and SCUBA2_4, all within an area of about 1 sq. arcmin. The source density in this region is thus substantially higher than the usual one source per 20 beams criterion for confusion (Hewish, 1961). We might thus expect problems with flux estimation in this region. To address this issue we extract far-IR fluxes from the H-ATLAS maps at 250, 350 and 500m for this confused region using the positions of the submm detected objects, as noted above, as priors. We also perform a simultaneous fit to the maps using four gaussians, with FWHMs corresponding to the instrumental beams at the appropriate wavelength, and with positions corresponding to those of the submm detected objects, to a section of the images around these sources using the image fitting tool Imfit (Erwin, in prep)222http://www.mpe.mpg.de/erwin/code/imfit/. The gaussians are fitted simultaneously to, in effect, deblend the sources. We found that this deblending procedure produces fluxes which are consistent with those extracted directly from the maps. The deblended fluxes are those given in Table 3.
4.2 Comparison of LABOCA and SCUBA2 Source Lists
A combination of both the LABOCA and SCUBA2 source catalogs provides a list of 18 distinct sources, with three sources, including the lens HATLAS12-00, appearing in both, and a total of twelve sources cross identified between one (or both) of the submm source lists and the H-ATLAS SPIRE catalog. This raises the question of the reality of those submm sources detected by one set of observations and not the other. This issue is complicated by the fact that the noise in the two submm data sets is not uniform, by confusion, by different beamsizes, and by the differences in the data reduction methods used by the two bolometer array instruments. To address this further, we have extracted the SPIRE fluxes of each of the submm sources as described above. Where sources are not explicitly detected by both submm instruments, the submm fluxes from the complementary submm map are also extracted. These are given in Table 3.
We assess the reliability of our submm detected sources by comparing the S/N with which they are detected in the five bands observed by the three instruments. Sources detected by SCUBA2 and/or LABOCA are considered good if they are detected in a total of at least three bands from SPIRE (250, 350 and 500m), LABOCA and SCUBA2. In this context, detection in a SPIRE band is considered to be a S/N 3, whether this comes from the H-ATLAS catalogue or is measured from the H-ATLAS maps. Marginal sources are those detected by only one complementary band, and unreliable sources are those not detected in any complementary passbands. On this basis we have 10 good detections, including the lensed source, 5 marginal detections, and 3 unreliable detections.
As can be seen from the table notes, three of the SCUBA2 sources are found in parts of the LABOCA map where there are problems with the data reduction. One of these, SCUBA2_8, is close to the bright lensed source HATLAS12-00, and is affected by negative ringing in the LABOCA map production process. Nevertheless, it is clearly detected by SPIRE, so its reality is not in doubt. Two other SCUBA2 sources lie in a region where there is a large-scale gradient in the LABOCA map. We attempt to remove the effects of this gradient by smoothing the LABOCA map with a Gaussian with a 1 of 1 arcminute, subtracting this from the LABOCA map, and then searching for flux at the positions of these sources. In neither case does this suggest the presence of a source detected by LABOCA at 3, but the presence of this gradient suggests that the LABOCA data in this area may be of a lower quality than the gaussian noise suggests. The lack of LABOCA confirmation for SCUBA2_12, a source clearly detected by SPIRE at in all three bands is thus unlikely to be a problem.
| Name | F250 | F350 | F500 | FLABOCA | FSCUBA2 | Comments | Status |
|---|---|---|---|---|---|---|---|
| (mJy) | (mJy) | (mJy) | (mJy) | (mJy) | |||
| LABOCA_1 | 2906 | 3567 | 2958 | 79.4 2.5 | 801.4 | HATLAS12-00, also SCUBA2_10 | Good |
| LABOCA_2 | 516 | 54 7 | 508 | 14.8 1.9 | 101.7 | HATLASJ114641.4-001332, also SCUBA2_13 | Good |
| LABOCA_3& | 246 | 377 | 388 | 10.3 1.6 | 10.52.2 | HATLAS supplementary; SCUBA2_3 | Good |
| LABOCA_4 | 406 | 427 | 148 | 10.8 2.1 | 6.42.1 | HATLASJ114623.5-001058 | Good |
| LABOCA_5& | 266 | 477 | 468 | 7.3 1.5 | 7.32.2∗ | HATLASJ114644.6-000840 | Good |
| LABOCA_6# | 116 | 167 | 78 | 8.6 2.1 | 0.62.3 | Unreliable | |
| LABOCA_7# | 106 | 107 | 48 | 9.4 2.3 | 8.22.7! | Marginal | |
| SCUBA2_1# | 126 | 187 | 188 | 10.6 2.1 | HATLAS supplementary; | Marginal | |
| Outside LABOCA field; | |||||||
| SCUBA2_2# | 186 | 87 | -28 | 02 | 9.6 2.3 | Possible HATLAS supplementary ID | Marginal |
| SCUBA2_4& | 166 | 187 | 268 | 3.31.5 | 8.6 2.0 | HATLAS supplementary | Marginal |
| SCUBA2_5& | 186 | 237 | 278 | 4.31.4 | 10.5 2.0 | HATLAS supplementary | Good |
| SCUBA2_6# | 36 | 57 | -68 | 02.5 | 9.9 2.5 | Unreliable | |
| SCUBA2_7# | 216 | 237 | 158 | 72.0 | 8.0 2.0 | HATLAS supplementary | Good |
| SCUBA2_8 | 556 | 657 | 518 | -2.52.4% | 7.0 1.4 | HATLASJ114635.1-001048; | Good |
| Poor LABOCA data | |||||||
| SCUBA2_9 | 566 | 607 | 318 | 62 | 10.6 1.8 | HATLASJ114628.6-001114 | Good |
| SCUBA2_11# | 56 | 117 | 248 | 02.3 | 6.4 1.5 | Gradient affecting LABOCA flux | Marginal |
| SCUBA2_12# | 226 | 307 | 248 | 02.2 | 7.5 1.6 | HATLAS supplementary; | Good |
| Gradient affecting LABOCA flux; | |||||||
| SCUBA2_14# | 46 | 87 | 148 | 01.8 | 7.3 1.8 | Unreliable |
4.3 Source Overdensities Around HATLAS12-00
Our observations of the region around HATLAS12-00 have uncovered a number of potentially associated sources at both submm wavelengths, as found by SCUBA2 and LABOCA, and in the Herschel data themselves. These results are not dissimilar to the submm source overdensities uncovered by Stevens et al. (2010) around quasars, the Herschel source overdensities found by Rigby et al. (2014) around some high redshift radio galaxies, the overdensity of Herschel and LABOCA sources associated with the Spiderweb galaxy (Dannerbauer et al., 2014), or the Herschel and SCUBA2 overdensity found behind the RCS 231953+00 supercluster by Noble et al. (2013). We here quantitatively asses the source overdensities of both submm and Herschel sources around HATLAS12-00.
The analysis here, of both SPIRE and submm source densities, compares the source densities associated with our sources to the density of individual field sources at all redshifts down to the relevant flux limits. The possibility that our clumps might be the result of line of sight alignments of several weak, physically unassociated, overdensities, as has been seen, for example, in the optical for Abell clusters (Sutherland & Efstathiou, 1991), is discussed in Section 5.2.
4.3.1 SPIRE Source Density
To determine the level of SPIRE source overdensity around HATLAS12-00 we compare the SPIRE source density around HATLAS12-00 with that in randomly selected positions in the H-ATLAS GAMA12 field, which covers approximately 25 square degrees (Valiante et al. in prep). For a SPIRE source to be considered real in this comparison we require a detection in at least one SPIRE band. The furthest good companion source to HATLAS12-00 lies 220 arcseconds away so we initially assess the source density within a 220 arcscond radius region for our 10,000 comparison fields. Fourteen sources are detected by SPIRE at in the 220 arcseconds around HATLAS12-00. Only 5 of our 10,000 comparison positions have a similar or greater source density. The HATLAS12-00 region can thus be regarded as having a probability of only of arising by chance. We also look at the level of overdensity in this field on a range of scales. We find that within 2, 2.5, 3, 4, 5, and 10 arcminute radii the H12-00 region is overdense at the , (ie. no other region in our 10000 comnparison fields has a similar SPIRE source density), , , and levels. This confirms the presence of a significant overdensity of SPIRE sources on scales matching the Planck beam (2.5 arcmin radius).
If we restrict our analysis to sources detected at 350m rather than those detected in any SPIRE band then regions within 2, 2.5, 3, 4, 5 and 10 arcminutes of H12-00 are overdense at the , (ie. no other region in our 10000 comparison fields has a similar 350m source density), , , and levels, suggesting the possible presence of an overdensity on larger scales than the Planck beam, up to a radius of 10 arcmin. While this would certainly be a large structure in terms of physical size, amounting to about 10Mpc in diameter if it lies at the same redshift as HATLAS12-00, it is comparable to the scale of the z3 candidate supercluster identified by Noble et al. (2013), through a combination of SPIRE and SCUBA2 data, and a number of other known protoclusters (Casey, 2016). Examination of the progenitors of massive clusters in the Millennium Simulation (Diener et al., 2015) suggests that they can be as large as 20Mpc across at , consistent with the sizes of these overdensities identified in the far-IR/submm.
4.3.2 Submm Source Density
At submm wavelengths, 850 and 870m, we do not have anything comparable to the large GAMA 12 field observed in the same way as the region around HATLAS12-00 to use as a direct comparison. We thus apply two alternative approaches to the determination of any overdensity of submm sources associated with HATLAS12-00. The first uses the density of submm sources in the field determined by blank field surveys. The largest of these currently available by far is the SCUBA2 Cosmology Legacy Survey (CLS, Geach et al., 2016) which covers a total area of about 5 square degrees in a variety of different fields. For sources classified as good we find 9 submm companions to the lens, the maximum separation from which is 220 arcseconds. Where possible, we combine the 850 and 870 m fluxes for these sources to get a combined noise weighted average flux. The faintest combined submm flux for a good source is 6.3 mJy for SCUBA2_5. The fluxes for all the other sources are 7mJy. Conservatively, since the sources are not spread uniformly through this area, we use this to define a circular region of radius 220 arcseconds within which the observed source density can be compared to the field source density at the same flux limits. The SCUBA2 CLS (Geach et al., 2016) measure counts for their survey to be 130 deg-2 at 6.5 mJy and 208 deg-2 at 5.5 mJy. Linear interpolation between these two values gives an estimate for the counts at 6.3 mJy to be 145 deg-2. This corresponds to 1.7 sources that would be found in this area at the field density, assuming they are distributed randomly. We find 9 sources, so the probability of the observed number of companions arising randomly is then 6 .
Real submm sources are, however, not distributed purely randomly, though the clustering between them in the linear regime is unlikely to be sufficient to substantially reduce the significance of the source overdensity we have found compared to the field (see eg. Noble et al., 2013). Nevertheless, to be certain that this is not a problem we use a similar method to that used in Section 4.3.1 for SPIRE sources as a second approach to determine the significance of the submm source overdensity. For this we use the SCUBA2 CLS observations of the COSMOS field, covering 0.65 sq. deg., and the UDS field, covering 1 sq. deg, as comparisons since these are the two largest contiguous fields in the survey, and, once again, compare the number of good sources found in regions of a specific size around HATLAS12-00 to 10,000 randomly selected reference positions in the field. We do this for regions with 2, 2.5, 3 and 4 arcminutes of H12-00. We find that within 2, 2.5, 3, and 4 arcminute radii the H12-00 region is overdense at the , , , and levels. This confirms the presence of a significant overdensity of submm sources. It should be noted that the comparison fields for this analysis are small in size compared to the 25 sq. deg. comparison field used for SPIRE. There is thus a possibility for some cosmic variance effects, but they are unlikely to substantially reduce the significance of this overdensity. These will also be somewhat ameliorated by combining the results, as we have done above, for the UDS and COSMOS fields.
We also compared the density of good sources around HATLAS12-00 to the SCUBA2 source overdensity discovered by Noble et al. (2013), suggested, on the basis of Herschel to SCUBA2 colours, to be a protocluster at 3. Both SCUBA2 maps have roughly equal 1 sensitivities of 1.5mJy. Around HATLAS12-00, we detect a total of 9 good sources over an area covering approximately 100 square arcminutes. This corresponds to a source density of 324 sources per square degree. This compares to the 16 sources detected by Noble et al. over approximately 470 square arcminutes, which gives a surface density of 122 sources per square degree. From this, we infer that HATLAS12-00 is one of the strongest overdensities of 850m sources currently known, with a surface density 2.5 that of the structure detected by Noble et al. (2013).
4.4 Herschel-submm Colours
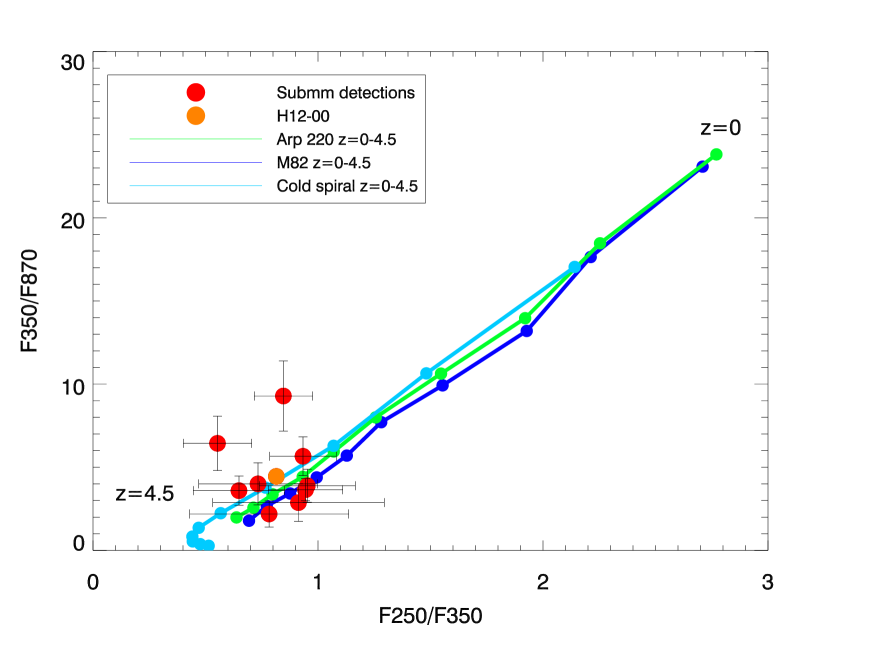
The use of SPIRE colour-colour diagrams to constrain redshifts is well established (eg. Schulz et al., 2010; Amblard et al., 2010; Negrello et al., 2010; Wardlow et al., 2013; Herranz et al., 2013; Noble et al., 2013; Clements et al., 2014) though their interpretation can be uncertain. The observed colours of sources are compared to the colours, as a function of redshift, of the spectral energy distributions (SEDs) of known low redshift template objects, such as the starburst galaxy M82 or the nearest ULIRG, Arp220. We have 10 good sources associated with HATLAS12-00, including the lens, for which reasonable quality SPIRE and submm data are available. The SPIRE colours for these sources are shown in Fig. 3, together with the SPIRE colours for the 32 SPIRE-detected sources with S/N 2 in all bands that lie in the submm fields that were not detected at in the submm. We extend this to the submm in Fig. 4, plotting SPIRE 250-to-350m colour against 350-to-850m. We have also included the SED of a cold spiral galaxy to illustrate the effects of the dust temperature-redshift degeneracy, whereby a source with colder dust can have similar far-IR-submm colours to those of a higher redshift higher dust temperature object. The dust temperature for this cold galaxy template is T=20K, and the SED is comparable to that of the local spiral M100 (Cortese et al., 2014).
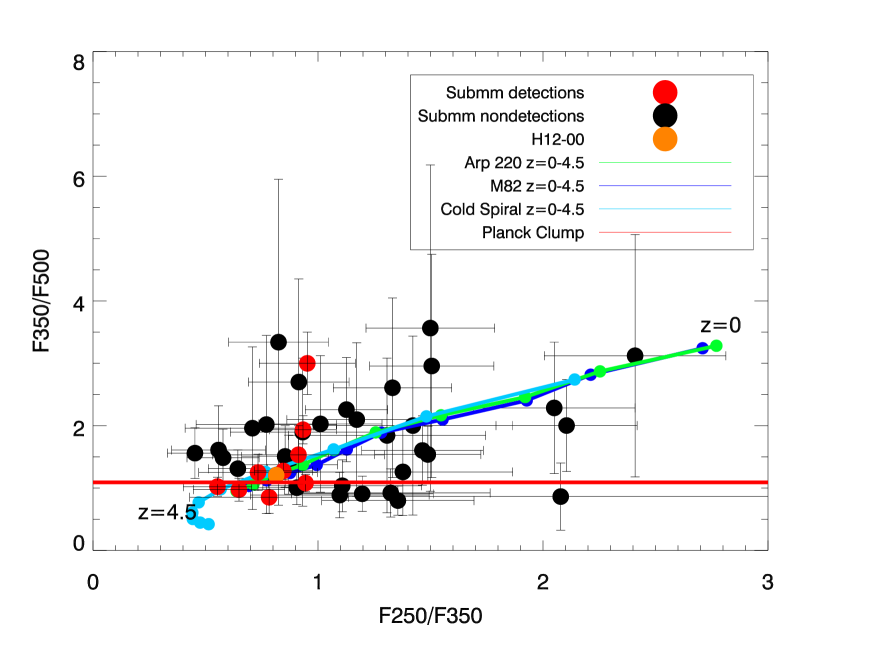
The Herschel and Herschel-submm colours of our submm detected sources are all quite similar to the colours of the lensed source. There is thus a temptation to conclude that the submm companions of HATLAS 12-00 all lie at a similar redshift. However, there is also the possibility that the clump of sources, while at high redshift, is not physically associated with the lensed source, as well as the possibility that some, or maybe all, of the companions are cooler objects at a significantly lower redshift. If we take the 20K dust temperature of the cold spiral SED as a likely lower limit to the dust temperature of a galaxy - something that appears to be the case for the vast majority of local galaxies but with a small number of exceptions (Rowan-Robinson & Clements, 2015) - then the likely lower redshift limit for these sources is z1 and for most z. These limits largely come from the Herschel-submm colours.
It is also worth noting that eight of the nine good companions to HATLAS12-00 have F250/F350 1 ie. their SEDs peak in the 350m band of SPIRE. The remaining source has an an SED rising to 500m. Tens of ‘350-peaker’ sources now have spectroscopic redshifts as a result of followup observations aimed at candidate lenses and other samples (eg. Wardlow et al., 2013; Harris et al., 2012; Bussmann et al., 2013; Casey et al., 2012a, 2012b). The vast majority of those with secure colours and reliable redshifts have redshifts 2. Thus, despite the redshift-temperature degeneracy, an SED peaking at 350m seems observationally to be a very good indication of high redshift.
4.5 Multiwavelength Cross Identifications
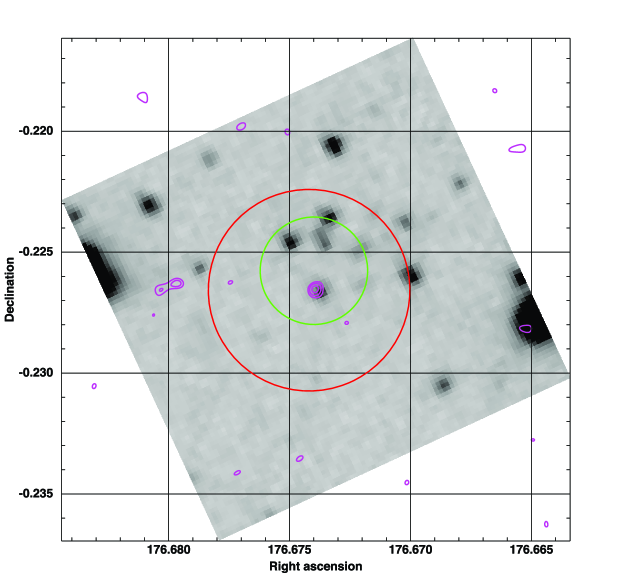
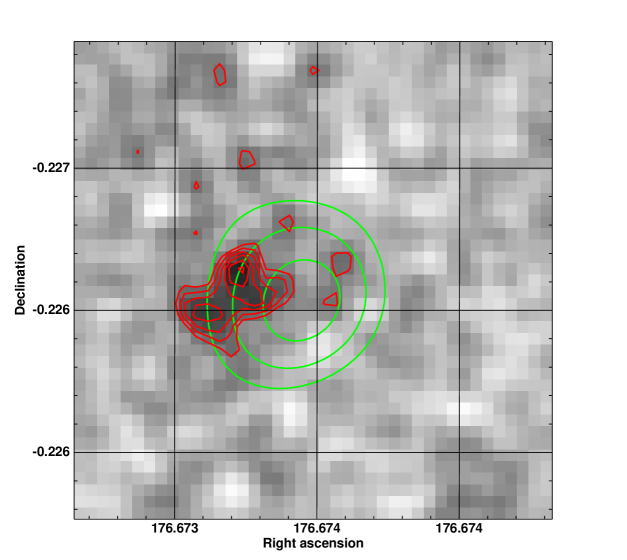
SMA observations of sources LABOCA_2, 3, 4 & 5 have found a source corresponding to LABOCA_2, with a flux of 4.21mJy (a 4.2 detection). The location of this SMA source is well matched to the LABOCA and SCUBA2 positions (see Fig. 5). The non-detections for LABOCA_3, LABOCA_4 and 5 are compatible with their expected fluxes based on their colours and SED template fitting - we would at best only have expected to detect them at 3 given the noise achieved at the SMA, and indeed some marginal detections at this level are found (see Section 3.4).
The position for the SMA counterpart to LABOCA_2 is coincident with a source in our Spitzer 3.6 and 4.5 m images of this field (see Fig. 5 Left). The properties of this cross identification are summarised in Table 5. Examination of SDSS images at the position of this source fails to find any optical counterpart, implying that the -band magnitude of the source is fainter than the 21.3 magnitude -band limit of SDSS. Deeper optical observations of this source obtained with white light (ie. filterless) observations at the WHT also fail to find an optical counterpart. The 5 detection limit for these observations is estimated to be (Fu et al., 2012). This source is detected in our ISAAC J and K’ observations of a 150x150 arcsec field around the position of LABOCA_2. J and K’ magnitudes for this source were extracted with apertures matching those of the IRAC photometry, and found to be Jvega = 22.60.15 and Kvega = 20.30.15. The colours of this source would classify it as a Distant Red Galaxy (DRG; Franx et al., 2003), a class of object already known to often be the near-IR counterparts of high redshift () submm sources (Dannerbauer et al., 2004).
In Fig. 6 we plot the observed optical/near-IR SED of LABOCA_2, including the IRAC and ISAAC detections and the WHT upper limit. We perform a photometric redshift analysis of these fluxes using the template SEDs derived by Berta et al. (2013) for Herschel sources and the wider range of optical/near-IR templates provided by Bruzual & Charlot (2003). A variety of templates can fit the data and provide a range of acceptable redshifts from 2.8 to 3.9 for the Berta templates and at for the Bruzual & Charlot models. None of the templates, however, provides an acceptable match to the observed SED at redshifts 1. We thus conclude that the companion source LABOCA_2, at least, is much more likely to lie at a redshift comparable to that of the lensed source than that of the lower redshift lens. In Fig. 6 we illustrate this by comparing the best fit Berta template SEDs for , matching that of the lensed source and representing a high redshift solution, with that for , matching the redshift of the foreground lensing sources and representing a low redshift solution. We also show the values for these fits. The high redshift SED is clearly the better fit, with a reduced of 3.9 compared to 23.6 for the low redshift solution, though the J band flux is somewhat higher than the template would suggest. Combining the optical/near-IR data with the far-IR/submm fluxes and fitting with the same Berta et al. (2013) templates provides a similar result.
Examination of the ISAAC images shows that LABOCA_2 appears to be extended on scales of a few arcseconds (see Fig. 5 Right). The source seems to have a bimodal flux distribution, suggestive of a merger-like morphology though other interpretations are possible. However, deeper observations are required to confirm this.

| Source | RA | Dec | F1100 | Optical | J | K’ | [3.6] | [4.5] |
| Deg J2000 | Deg J2000 | mJy | AB | Vega | Vega | Vega | Vega | |
| LABOCA_2 | 176.6736 | -0.2266 | 4.21.1 | 22.60.18 | 20.30.15 | 18.260.04 | 17.420.04 |
5 Discussion
5.1 The Number of Sources in the Overdensity
We have found a significant overdensity of both SPIRE and SCUBA2 sources in the region around the z=3.26 gravitationally lensed far-IR luminous galaxy HATLAS12-00. While the overdensity is highly significant, the underlying field source counts are sufficiently high that it is unlikely that all of the sources around HATLAS12-00 are members of the overdensity. The probability that a given number of objects are part of the overdensity, as opposed to being from the field population, can be calculated from the field source counts using Poisson statistics, under the assumption that field sources are distributed at random. The probability that there are overdensity sources out of detected sources is thus:
| (1) |
where is the number of field sources that would be predicted in the region of consideration on the basis of the source counts.
To illustrate this for the current case we use the CLS field counts from SCUBA2, and restrict ourselves to examining the nine good companion sources which lie within a 220 arcsecond distance from HATLAS12-00. The field counts would predict 1.7 sources in such a region. The resulting probabilities for the number of overdensity sources is shown as a histogram in Fig. 7. As can be seen, the predicted number of overdensity sources is fairly uncertain, with the most likely numbers ranging from 6 to 9.

5.2 The Nature of the Overdensity
The foregoing analysis suggests that a significant fraction of the sources we have detected around HATLAS12-00 are likely to lie in an overdensity of objects. It is a natural step from this result to think that these objects are part of a single coherent physical structure, possibly a cluster or protocluster of galaxies. Similar arguments have been applied to the Herschel and submm source overdensities found by others, including Stephens et al. (2010), Noble et al. (2013), Valtchanov et al. (2013), and Dannerbauer et al. (2014). The similarity of the SPIRE and submm colours of these sources lends credence to this suggestion, but we must be careful since there is a long history of apparent overdensities being identified with single structures when they are in fact chance superpositions of two or more weaker overdensities that just happen to lie along the line of sight (eg. Sutherland & Efstathiou, 1991). We can assess this possibility by looking at the expected number of clusters that would lie in the volume observed in this study. The cluster X-ray luminosity function down to ergs s-1cm-2, appropriate for poor clusters or galaxy groups (Koens et al. (2013)), is known out to with reasonable accuracy. Since this is expected to decline to higher redshifts it can be used to calculate conservative upper limits to the expected number of clusters found in any survey. If we were to assume that the HATLAS 12-00 field was selected at random, then the total volume along the line of sight that we have observed out to is 3.8Mpc3 and we would predict an average of 0.38 poor clusters or groups to lie in this volume. Assuming Poisson statistics, one group/cluster would be found with a probability of 0.26, two with 0.05 and three or more structures with 0.007. There is thus a small (6%) but non-negligible chance that our overdensity might be enhanced by a superposition effect.
Obtaining spectroscopic redshifts for the Herschel and submm sources we have uncovered is necessary for properly understanding this overdensity. Unfortunately such data is not yet available, but we can get some hints as to what might be going on by applying far-IR photometric redshift techniques, similar to those used by Noble et al. (2013) in studying a submm source overdensity at a suggested redshift of which they uncovered behind the supercluster RCS 231953+00. This process produces a similar result to that found by comparing the colour tracks of template sources to the observed colours of our sources: the higher luminosity, higher dust temperature templates imply redshifts 3, with implied luminosities of for the sources we classify as good, while the lower temperature, lower luminosity templates imply redshifts closer to with luminosities . Noble et al. (2013) argued that lower temperature, lower redshift solutions were not compatible with the empirical temperature-luminosity relation derived by Roseboom et al. (2012) for Herschel selected sources. However, further work since then (eg. Casey et al. 2012b) has shown that there is a significant amount of scatter in this relation. This weakens any conclusion that can be drawn from such an analysis. While higher redshifts for our sources are still somewhat favoured by the T-L relation in Casey et al. (2012b) the possibility that some of our sources are cool outliers in this relation cannot be discounted. Our analysis of the optical/near-IR SED of the one source where we have a clear identification, LABOCA_2 (see Section 4.5), seems to favour higher redshifts, but without enough precision to differentiate between and .
6 Conclusions
The lensed dusty starburst galaxy HATLAS12-00 was found to be associated with a Planck ERCSC source by Herranz et al. (2013), leading to the suggestion that it is part of a galaxy cluster or protocluster, several of whose members are undergoing a starburst. The presence of a number of Herschel sources near to HATLAS12-00 with similarly red SPIRE colours to the lens supports this idea. We obtained submm observations of an 11 arcmin diameter field around HATLAS12-00 using both the LABOCA and SCUBA2 submm mappers. As well as detecting the lensed source itself, we detect 17 other submm sources in this field at 4 significance or greater, with fluxes from 6.4 to 15mJy at 850 and/or 870m. The number of such submm sources found in this field represents a significant overdensity, one that would occur at random in the field with a probability ranging from 7.6 to 3.8, depending on the reliability of the sources included in the calculation. There is also an overdensity of Herschel sources around HATLAS12-00 which has a probability of 5 of arising at random. These low probabilities argue for a physical association between these sources, suggesting that they are lie in a cluster, a proto-cluster or some other large scale structure at similar redshifts. Whether this structure is related to the lensed source is unclear. The Herschel and submm colours of the sources are red, suggesting that the sources are either warm high luminosity systems at or cooler systems at a redshift closer to 1. Multiwavelength followup observations identify one of the companions to HATLAS12-00 with a source detected by Spitzer at 3.6 and 4.5 m, and in subsequent near-IR imaging using the VLT. Photometric redshift analysis of the optical/NIR SED of this source indicates a redshift , potentially similar to that of HATLAS12-00 but not compatible with redshifts 1. Further followup observations including optical/near-IR imaging and spectroscopy are needed to firmly establish the nature of the overdensity we have found and to examine the tantalising possibility that this might be a galaxy cluster/protocluster at z3.26.
Acknowledgements
The Herschel-ATLAS is a project with Herschel, which is an ESA space observatory with science instruments provided by European-led Principal Investigator consortia and with important participation from NASA. The H-ATLAS website is http://www.h-atlas.org/. Based in part on observations obtained with Planck (http://www.esa.int/Planck), an ESA science mission with instruments and contributions directly funded by ESA Member States, NASA, and Canada. This publication is also based in part on data acquired with the Atacama Pathfinder Experiment (APEX). APEX is a collaboration between the Max-Planck-Institut fur Radioastronomie, ESO, and the Onsala Space Observatory. The James Clerk Maxwell Telescope has historically been operated by the Joint Astronomy Centre on behalf of the Science and Technology Facilities Council of the United Kingdom, the National Research Council of Canada and the Netherlands Organisation for Scientific Research. The Submillimeter Array is a joint project between the Smithsonian Astrophysical Observatory and the Academia Sinica Institute of Astronomy and Astrophysics and is funded by the Smithsonian Institution and the Academia Sinica. This work is based in part on observations made with the Spitzer Space Telescope, which is operated by the Jet Propulsion Laboratory, California Institute of Technology under a contract with NASA. Based in part on observations made with ESO Telescopes at the La Silla Paranal Observatory under programme ID 290.A-5043. Support for this work was provided by NASA through an award issued by JPL/Caltech.The Italian co-authors acknowledge financial support from ASI/INAF agreement 2014-024-R.0. The Spanish co-authors acknowledge financial support by the Ministerio de Ciencia e Innovacion, AYA2012-39475-C02-01, and Consolider-Ingenio 2010, CSD2010-00064. J.G.N. acknowledges financial support from the Spanish MINECO for a Ramon y Cajal fellowship and from the Spanish CSIC for a JAE-DOC fellowship, co-funded by the European Social Fund. E. Ibar acknowledges funding from CONICYT/FONDECYT postdoctoral project N∘:3130504. This work was also supported in part by funding from STFC. LD, RJI, IO and SJM acknowledge support from the European Research Council (ERC) in the form of Advanced Investigator Program, COSMICISM. The Dark Cosmology Centre is funded by the Danish National Research Foundation.
DLC would like to thank Douglas Scott and Andrew Jaffe for useful discussions.
References
- [\citeauthoryearAmblard et al.2010] Amblard A., et al., 2010, A&A, 518, L9
- [\citeauthoryearAndreon2011] Andreon S., 2011, A&A, 529, L5
- [\citeauthoryearBertin & Arnouts1996] Bertin E., Arnouts S., 1996, A&AS, 117, 393
- [Bradford et al.(2004)] Bradford, C. M., et al. 2004, Proceeedings of the SPIE, 5498, 257
- [\citeauthoryearBerta et al.2013] Berta S., et al., 2013, A&A, 551, AA100
- [\citeauthoryearBruzual & Charlot2003] Bruzual G., Charlot S., 2003, MNRAS, 344, 1000
- [\citeauthoryearBussmann et al.2013] Bussmann R. S., et al., 2013, ApJ, 779, 25
- [\citeauthoryearCapak et al.2011] Capak, P.L., et al., 2011, Nature, 470, 233
- [\citeauthoryearCarilli et al.2011] Carilli C. L., Hodge J., Walter F., Riechers D., Daddi E., Dannerbauer H., Morrison G. E., 2011, ApJ, 739, L33
- [\citeauthoryearCasey et al.2012a] Casey C. M., et al., 2012a, ApJ, 761, 139
- [\citeauthoryearCasey et al.2012b] Casey C. M., et al., 2012b, ApJ, 761, 140
- [\citeauthoryearCasey et al.2015] Casey C. M., et al., 2015, ApJ, 808, L33
- [\citeauthoryearCasey2016] Casey C. M., ApJ, submitted
- [\citeauthoryearChapin et al.2011] Chapin E. L., et al., 2011, MNRAS, 411, 505
- [\citeauthoryearChapin et al.2013] Chapin E. L., Berry D. S., Gibb A. G., Jenness T., Scott D., Tilanus R. P. J., Economou F., Holland W. S., 2013, MNRAS, 430, 2545
- [\citeauthoryearChapman et al.2005] Chapman S. C., Blain A. W., Smail I., Ivison R. J., 2005, ApJ, 622, 772
- [\citeauthoryearClements et al.2008] Clements D. L., et al., 2008, MNRAS, 387, 247
- [\citeauthoryearClements, Dunne, & Eales2010] Clements D. L., Dunne L., Eales S., 2010, MNRAS, 403, 274
- [\citeauthoryearClements et al.2014] Clements D. L., et al., 2014, MNRAS, 439, 1193
- [\citeauthoryearCortese et al.2014] Cortese L., et al., 2014, MNRAS, 440, 942
- [\citeauthoryearDaddi et al.2009] Daddi E., et al., 2009, ApJ, 694, 1517
- [\citeauthoryearDannerbauer et al.2004] Dannerbauer H., Lehnert M. D., Lutz D., Tacconi L., Bertoldi F., Carilli C., Genzel R., Menten K. M., 2004, ApJ, 606, 664
- [\citeauthoryearDannerbauer et al.2014] Dannerbauer H., et al., 2014, A&A, 570, AA55
- [\citeauthoryearDempsey et al.2013] Dempsey J. T., et al., 2013, MNRAS, 430, 2534
- [\citeauthoryearDiener et al.2015] Diener C., et al., 2015, ApJ, 802, 31
- [\citeauthoryearDriver et al.2011] Driver S. P., et al., 2011, MNRAS, 413, 971
- [\citeauthoryearEales, et al.2010] Eales, S.A., et al., 2010, PASP, 122, 499
- [\citeauthoryearEisenhardt2008] Eisenhardt, P.R.M., Brodwin, M., Gonzalez, A.H., Stanford, S.A., Stern, D., Barmby, P., Brown, M.J.I., Dawson, K., et al., 2008, ApJ, 684, 905
- [\citeauthoryearFranx et al.2003] Franx M., et al., 2003, ApJ, 587, L79
- [\citeauthoryearFu et al.2012] Fu, H., et al., 2012, ApJ., 753, 134
- [\citeauthoryearGeach et al.2016] Geach J. E., et al., 2016, MNRAS, submitted
- [\citeauthoryearGobat et al.2011] Gobat, R., et al., 2011, A&A, 526, 133
- [\citeauthoryearGranato et al.2004] Granato, G.L., De Zotti, G., Silva, L., Bressan, A., Danese, L., 2004, ApJ., 600, 580
- [\citeauthoryearGriffin et al.2010] Griffin, M.J., et al., 2010, A&A, 518, L3
- [\citeauthoryearGüsten et al.2006] Güsten R., Philipp S. D., Weiß A., Klein B., 2006, A&A, 454, L115
- [\citeauthoryearHarris et al.2007] Harris A. I., et al., 2007, ASPC, 375, 82
- [\citeauthoryearHarris et al.2012] Harris A. I., et al., 2012, ApJ, 752, 152
- [\citeauthoryearHerranz et al.2013] Herranz D., et al., 2013, A&A, 549, A3
- [\citeauthoryearHewish1961] Hewish A., 1961, MNRAS, 123, 167
- [\citeauthoryearHolland et al.2013] Holland W. S., et al., 2013, MNRAS, 430, 2513
- [\citeauthoryearHusband et al.2013] Husband K., Bremer M. N., Stanway E. R., Davies L. J. M., Lehnert M. D., Douglas L. S., 2013, MNRAS, 432, 2869
- [\citeauthoryearIbar et al.2010] Ibar E., et al., 2010, MNRAS, 409, 38
- [\citeauthoryearIvison et al.2013] Ivison R. J., et al., 2013, ApJ, 772, 137
- [\citeauthoryearIvison et al.2000] Ivison R. J., Dunlop J. S., Smail I., Dey A., Liu M. C., Graham J. R., 2000, ApJ, 542, 27
- [\citeauthoryearKoens et al.2013] Koens L. A., Maughan B. J., Jones L. R., Ebeling H., Horner D. J., Perlman E. S., Phillipps S., Scharf C. A., 2013, MNRAS, 435, 3231
- [\citeauthoryearMa et al.2015] Ma C.-J., et al., 2015, arXiv, arXiv:1504.06630
- [\citeauthoryearMaddox et al.2010] Maddox S. J., et al., 2010, A&A, 518, L11
- [\citeauthoryearMagliocchetti et al.2007] Magliocchetti, M., Silva, L., Lapi, A., de Zotti, G., Granato, G.L., Fadda, D., Danese, L., 2007, MNRAS, 375, 1121
- [\citeauthoryearMakovoz & Marleau2005] Makovoz D., Marleau F. R., 2005, PASP, 117, 1113
- [\citeauthoryearMichałowski, Hjorth, & Watson2010] Michałowski M., Hjorth J., Watson D., 2010, A&A, 514, A67
- [\citeauthoryearNegrello et al.2005] Negrello, M., Gonzalez-Nuevo, J., Magliocchetti, M., Moscardini, L., De Zotti, G., Toffolati, L., Danese, L., 2005, MNRAS, 358, 869
- [\citeauthoryearNegrello et al.2010] Negrello, M., et al., 2010, Science, 330, 800
- [\citeauthoryearNoble et al.2013] Noble A. G., et al., 2013, MNRAS, 436, L40
- [\citeauthoryearOliver et al.2012] Oliver S. J., et al., 2012, MNRAS, 424, 1614
- [\citeauthoryearPascale et al.2011] Pascale E., et al., 2011, MNRAS, 415, 911
- [\citeauthoryearPierini2012] Pierini, D., Suhada, R., Fassbender, R., Nastasi, A., Böhringer, H., Salvato, M., Pratt, G.W., Lerchster, M., et al. 2012, A&A, 540, 45
- [\citeauthoryearPilbratt et al.2010] Pilbratt, G.L., et al., 2010, A&A, 518, L1
- [\citeauthoryearPlanck Collaboration2011a] Planck Collaboration, 2011, A&A, 536, 7
- [\citeauthoryearPlanck Collaboration et al.2015] Planck Collaboration, et al., 2015, arXiv, arXiv:1503.08773
- [\citeauthoryearPoglitsch et al.2010] Poglitsch, A., et al., 2010, A&A, 518, 2
- [\citeauthoryearPriddey, Ivison, & Isaak2008] Priddey R. S., Ivison R. J., Isaak K. G., 2008, MNRAS, 383, 289
- [\citeauthoryearRangwala et al.2011] Rangwala N., et al., 2011, ApJ, 743, 94
- [\citeauthoryearRigby et al.2011] Rigby E. E., et al., 2011, MNRAS, 415, 2336
- [\citeauthoryearRigby et al.2014] Rigby E. E., et al., 2014, MNRAS, 437, 1882
- [\citeauthoryearRiechers et al.2010] Riechers D. A., et al., 2010, ApJ, 720, L131
- [\citeauthoryearRowan-Robinson & Clements2015] Rowan-Robinson M., Clements D. L., 2015, MNRAS, 453, 2050
- [\citeauthoryearRoseboom et al.2012] Roseboom I. G., et al., 2012, MNRAS, 419, 2758
- [\citeauthoryearSantos2011] Santos, J., Fassbender, R., Nastasi, A., Böhringer, H., Rosati, P., Suhada, R., Pierini, D., Nonino, M., et al. 2011, A&A, 531, L15
- [\citeauthoryearSault, Teuben, & Wright1995] Sault R. J., Teuben P. J., Wright M. C. H., 1995, ASPC, 77, 433
- [\citeauthoryearSchuller2010] Schuller, F., Nord, M., Vlahakis, C., Albrecht, M., Beelen, A., Bertoldi, F., Mueller, S., Schaaf, R., BoA User and Reference Manual, pub. European Southern Observatory, 2010
- [\citeauthoryearSchulz et al.2010] Schulz B., et al., 2010, A&A, 518, L32
- [\citeauthoryearSiringo et al.2009] Siringo G., et al., 2009, A&A, 497, 945
- [\citeauthoryearStevens et al.2010] Stevens, J.A., Jarvis, M.J., Coppin, K.E.K., Page, M.J., Greve, T.R., Carrera, F.J., Ivison, R.J., 2010, MNRAS, 405, 2623
- [\citeauthoryearSurace et al.2005] Surace J. A., Shupe D. L., Fang F., Evans T., Alexov A., Frayer D., Lonsdale C. J., SWIRE Team, 2005, AAS, 37, 1246
- [\citeauthoryearSutherland & Efstathiou1991] Sutherland W., Efstathiou G., 1991, MNRAS, 248, 159
- [\citeauthoryearThomas2012] Thomas, H., 2012, The SCUBA2 Data Reduction Cookbook, Starlink Cookbook 21.0, Joint Astronomy Centre, http://www.jach.hawaii.edu/JCMT/continuum/sc21.pdf
- [\citeauthoryearValtchanov et al.2013] Valtchanov I., et al., 2013, MNRAS, 436, 2505
- [\citeauthoryearWardlow et al.2013] Wardlow J. L., et al., 2013, ApJ, 762, 59