Vibrational renormalisation of the electronic band gap in hexagonal and cubic ice
Abstract
Electron-phonon coupling in hexagonal and cubic water ice is studied using first-principles quantum mechanical methods. We consider 29 distinct hexagonal and cubic ice proton-orderings with up to 192 molecules in the simulation cell to account for proton-disorder. We find quantum zero-point vibrational corrections to the minimum electronic band gaps ranging from to , which leads to improved agreement between calculated and experimental band gaps. Anharmonic nuclear vibrations play a negligible role in determining the gaps. Deuterated ice has a smaller band-gap correction at zero-temperature of to . Vibrations reduce the differences between the electronic band gaps of different proton-orderings from around to less than , so that the electronic band gaps of hexagonal and cubic ice are almost independent of the proton-ordering when quantum nuclear vibrations are taken into account. The comparatively small reduction in the band gap over the temperature range 0–240 K of around does not depend on the proton ordering, or whether the ice is protiated or deuterated, or hexagonal or cubic. We explain this in terms of the atomistic origin of the strong electron-phonon coupling in ice.
I Introduction
Ice is a key constituent of the Earth’s crust and mantle Weingärtner and Franck (2005); Liebscher (2010), while on its surface and in its atmosphere it plays a crucial role in the water cycle and in determining climate Bartels-Rausch et al. (2012); Baker and Peter (2008); Young (1993). Accordingly, ice is one of the experimentally and computationally most extensively studied condensed matter systems and its properties have been investigated across a wide range of temperatures and pressures Bartels-Rausch et al. (2012).
The electronic bandstructure of ice plays an important role, e.g., in the redox reactions of atmospheric chemistry George et al. (2014); Betterton and Anderson (2001); Grannas et al. (2007); Heger et al. (2005); Takenaka and Bandow (2007); Takenaka et al. (1992); Park et al. (2010); Boxe et al. (2006); Kahan and Donaldson (2007); Klanova et al. (2003), in glaciers Bishop et al. (2011), Earth’s interior Liebscher (2010); Chandler (1998); Marcus (1956), and in structural determinations using electrochemical scanning tunnelling microscopy in aqueous environments Cucinotta et al. (2012). The insulator to metal transition induced by band gap closure Hama et al. (1990); Cavazzoni et al. (1999); Mattsson and Desjarlais (2006); Hermann et al. (2012); Pickard et al. (2013); Pan et al. (2014) in high pressure ice phases is thought to be important in astrophysical contexts such as in the sources of the magnetic fields of Uranus and Neptune Ness et al. (1986).
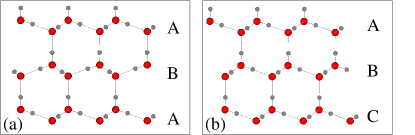
At the pressures found on Earth’s surface only stable hexagonal (Ih) and meta-stable cubic ice (Ic) Engel et al. (2015) (see Fig. 1) occur naturally. The latter typically contains many stacking faults. While experimental estimates of the zero-temperature electronic quasi-particle band gap, , in Ih of exist (see Refs. Hahn et al. (2005); Fang et al. (2015); Warren (1984); Minton (1971); Painter et al. (1969); Seki et al. (1981); Shibaguchi et al. (1977) and references therein), reliable values for Ic do not, since high purity samples of Ic have not been synthesised.
First-principles electronic structure calculations can be used to study electronic band structures, and quasiparticle and excitonic band gaps. However, density functional theory (DFT) using semi-local functionals – the workhorse of modern day electronic structure calculations – normally underestimates band gaps. Much progress has been made in calculating electronic band gaps using more accurate but computationally demanding hybrid functionals Paier et al. (2006), screened exchange functionals Clark and Robertson (2010), perturbation theories such as the approximation Hedin (1965); Hedin and Lundqvist (1969); Hybertsen and Louie (1985); Godby et al. (1988); Aulbur et al. (2000), and quantum chemical Cramer (2002); Shavitt and Bartlett (2009) and quantum Monte Carlo techniques Ceperley and Alder (1980); Foulkes et al. (2001); Needs et al. (2010); Drummond et al. (2005); Williamson et al. (1998). calculations for proton-ordered hexagonal ice (XIh), for example, reproduce the experimentally observed optical absorption spectra of Ih reasonably well in comparison to semi-local DFT Hahn et al. (2005); Fang et al. (2015). However, results for hexagonal ice of Hahn et al. (2005); Fang et al. (2015) overestimate by around .
Nuclear vibrations and proton-ordering are often neglected in studying band gaps of water and ice, but these effects have remarkable consequences for the electronic bandstructure (Pan et al. (2014); Monserrat et al. (2015) and this work). Measurements of band gaps of water provide strong experimental evidence for the importance of nuclear vibrations Sanchez-Valle et al. (2013). In liquid water, depends strongly on temperature which indicates large thermal vibrational effects and suggests large zero-point (ZP) quantum vibrational effects Sanchez-Valle et al. (2013); Pan et al. (2014); Monserrat et al. (2014). This observation motivates us to investigate whether vibrational effects could play a significant role in explaining the discrepancy between the values of obtained within the approximation and experiment. We have previously reported strong electron-phonon coupling in various molecular crystals, amongst them a proton-ordering of Ih with symmetry Monserrat et al. (2015). Benchmarking computational models against experimentally accessible systems, such as ice under ambient pressure, is essential. Ice displays a range of important and interesting phenomena related to configurational disorder and strong effects from nuclear vibrations due to the light hydrogen nuclei, which must both be included to obtain accurate atomistic simulations.
In this work we focus on vibrational corrections to the electronic band gaps of Ih and Ic, accounting for quantum nuclear vibrations and thermal effects (Sec. III). We investigate the effects of replacing the hydrogen atoms in Ih and Ic by heavier deuterons (Sec. IV), evaluate the role of vibrational anharmonicity (Sec. V), and determine the atomistic origins of the strong electron-phonon coupling (Sec. VI).
II Computational Model
II.1 Stacking faults and proton-disorder
It was long believed that ice at ambient pressure occurs in the hexagonal (Ih) and cubic (Ic) forms shown in Fig. 1. Both Ih and Ic consist of tetrahedrally coordinated water molecules satisfying the “Bernal-Fowler ice rules” Bernal and Fowler (1933). Ih and Ic have very similar free energies Engel et al. (2015) and their structures differ only in the stacking of the atomic layers (see Fig. 1). Thermodynamically stable Ih occurs naturally in abundance and plays a key role in determining Earth’s climate Bartels-Rausch et al. (2012); Baker and Peter (2008); Young (1993). The metastable, ideal Ic form König (1944) was also thought to play a role in nature, but to be very rare Murray et al. (2005); Shilling et al. (2006). However, real “cubic ice” typically contains many stacking faults and is therefore now referred to as stacking-disordered ice (Isd). Isd refers to the infinite set of possible stacking sequences, which smoothly connects Ih as one end member to Ic as the other. Isd is a highly complex material Malkin et al. (2015); Kuhs et al. (2012); Carr et al. (2014) and is thought to play a key role in ice nucleation, a process central to climate. A full understanding of Isd will require knowledge of the properties of Ih and Ic, which we limit ourselves to in this study.
Ih and Ic are proton-disordered systems with an extensive ground-state degeneracy that leads to Pauling’s residual configurational entropy Pauling (1935); Tajima et al. (1982); Jackson and Whitworth (1997). Atomistic simulations of Ih and Ic treat the hydrogen atoms explicitly and are based on representative sets of energetically quasi-degenerate, proton-ordered structures. The number of such structures allowed by the ice rules increases exponentially with the size of the simulation cell. For large systems, the configurational entropies of Ih and Ic are found to be almost identical Nagle (1966); Herrero and Ramírez (2014), and therefore they do not affect the relative stability.
We consider 16 distinct proton-ordered eight-molecule Ih configurations as constructed by Hirsch and Ojamäe Hirsch and Ojamäe (2004), and distinct proton-ordered eight-molecule Ic configurations Raza et al. (2011). We also consider the “conventional” hexagonal, 12-molecule Ih and quasi-cubic, eight-molecule Ic structures (numbers and in Figs. 5 (a) and (b), respectively). We calculate differences in static lattice energies for these sets of Ih and Ic proton-orderings which are in good agreement with those in Refs. Hirsch and Ojamäe (2004); Lekner (1998). More importantly, the variations in static lattice energies across the Ih proton-orderings agree with those calculated using first principles methods in Ref. Singer et al. (2005) for a much larger set of 16 8-molecule orthorhombic, 14 12-molecule hexagonal and 63 48-molecule orthorhombic Ih proton-orderings. These results strongly suggest that our sets of proton-orderings provide a good representation of proton-disordered Ih and Ic.
II.2 Static lattice calculations
While DFT with semi-local exchange-correlation functionals underestimates static electronic band gaps, it performs well in evaluating phonon spectra and vibrational band-gap corrections in ice, see Supplementary Section V sup for details. We performed electronic structure calculations using plane-wave pseudopotential DFT as implemented in the castep code Clark et al. (2005) (version 7.02). We employed the Perdew-Burke-Ernzerhof (PBE) Perdew et al. (1996); Santra et al. (2013) semilocal generalised gradient approximation functional, and on-the-fly generated ultrasoft pseudopotentials Vanderbilt (1990) with core radii of and for the hydrogen and oxygen atoms, respectively. We used a plane-wave energy cut-off of and Monkhorst-Pack electronic reciprocal space grids of spacing less than for the total energy calculations and geometry optimisations involved in the vibrational calculations described in Section II.3. The resulting energy differences between frozen-phonon configurations are converged to within , the atomic positions are converged to within , and the residual forces to within . We used a lower plane-wave energy cut-off of for the band structure calculations of frozen-phonon structures, which is sufficient for accurate electron-phonon coupling calculations as described in Section II.4.
II.3 Vibrational calculations
We obtained the harmonic vibrational normal modes, which define the normal phonon coordinates and the harmonic vibrational frequencies of a vibrational mode , using a finite displacement method Kunc and Martin (1982). and denote the branch index and vibrational Brillouin Zone wavevector of the vibrational mode, respectively. The phonon coordinates denote the atomic displacements along the vibrational mode . Anharmonic vibrations were calculated using the method described in Ref. Monserrat et al. (2013). We investigate the 3-dimensional BO energy surface (where is the number of atoms in the simulation cell) by mapping 1D subspaces along the harmonic normal mode axes. Using 11 equally spaced sampling points for each 1D subspaces was found to lead to converged results. Large maximum amplitudes of four times the harmonic root-mean-square (RMS) displacements were chosen to accurately describe the BO energy surface where anharmonicity is important. We then construct the 3-dimensional BO surface from the 1D subspaces which were fitted using cubic splines Engel et al. (2015). The anharmonic vibrational Schrödinger equation was solved within a vibrational self-consistent field (VSCF) framework. The anharmonic vibrational wave function was expanded as a Hartree product,
| (1) |
of single-particle anharmonic eigenstates, , with energy . denotes the vibrational eigenstate whose elements label the states of the vibrational modes . In practice, we expand the anharmonic states in a basis of simple harmonic oscillator eigenstates. The inclusion of 25 simple harmonic oscillator states for each degree of freedom was found to lead to converged results (see Supplementary Section I).
II.4 Electron-phonon coupling
Within the Born-Oppenheimer approximation, the vibrationally corrected band gap, , at temperature may be written as
| (2) |
where
| (3) |
is the partition function, is the gap for a frozen phonon structure with atomic positions , and is the harmonic or (where explicitly stated) anharmonic vibrational eigenstate with energy . The summation over vibrational eigenstates includes the vibrational ground-state and vibrationally excited states. The above theory provides a semiclassical approximation to the change in the band gap arising from nuclear motion Patrick and Giustino (2014).
In this work we use a quadratic approximation to , which allows us to asses the importance of individual vibrational modes, to investigate microscopic mechanisms, and a Monte Carlo sampling method to calculate accurate numerical values of . In the quadratic approximation is approximated as
| (4) |
The harmonic vibrational wave function is symmetric and odd terms in the polynomial expansion of vanish when evaluating the expectation value. Hence, the quadratic term is the first non-zero correction to the static band gap and errors are of . We calculate the diagonal quadratic coefficients, , using a frozen phonon method, displacing the atoms by along phonon modes, and setting . We note that Eq. (4) is equivalent to the Allen-Heine-Cardona theory including off-diagonal Debye-Waller terms Gonze et al. (2011).
Although the quadratic approximation is valuable in obtaining atomistic insights, it does not produce accurate values of for Ih and Ic. This arises because is generally not well described by a quadratic form, which also implies that the widely used Allen-Heine-Cardona theory is insufficient for studying electron-phonon coupling in ice. Examples of vibrational modes with particularly non-quadratic behaviour are shown in Fig. 2.
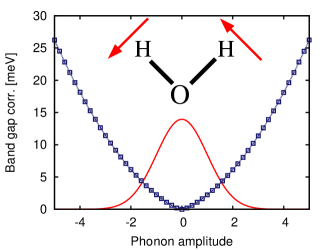
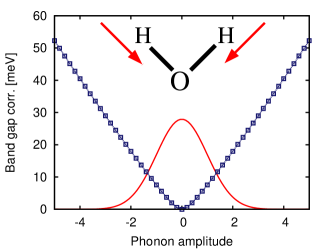
Note that the non-quadratic dependence of the band gap on the atomic displacements is distinct from anharmonicity in nuclear vibrations and we therefore treat them independently.
Instead of using the quadratic approximation to , we therefore evaluate accurate values of using Monte Carlo sampling, with frozen phonon structures, , randomly drawn from the vibrational density, as , which gives
| (5) |
is typically larger than . The Monte Carlo approach includes all higher-order terms in neglected in the quadratic approximation and, unlike the quadratic approximation, remains valid for an anharmonic nuclear wavefunction.
In order to obtain finite temperature band-gap corrections we resample band-gap corrections using the finite temperature nuclear density with its wider tails.
To obtain the band gap correction due to anharmonic nuclear vibrations, on the other hand, we employ a reweighting approach as in Ref. Monserrat et al. (2014), which is efficient and accurate for ice, since anharmonicity leads to a narrower, more localised nuclear density distribution. We reuse the band gap samples, , drawn from the harmonic vibrational density, , to calculate the band gap correction due to anharmonic nuclear vibrations as
| (6) |
where the weights, , are calculated from the harmonic and anharmonic nuclear probability densities
| (7) |
As shown in Section V, including vibrational anharmonicity changes the vibrational band-gap correction, , by only around 2 and 5 % in Ih and Ic, respectively, and (even up to the melting temperature) predominantly via the ZP band-gap correction. Hence, unless stated otherwise, all results were obtained using the harmonic approximation for the nuclear vibrations.
The same Monte Carlo approach could be employed to calculate vibrationally renormalised optical absorption spectra as demonstrated, for example, in Ref. Zacharias et al. (2015). For ice, excitonic effects would have to be included, for example, using the Bethe Salpeter equation Bethe and Salpeter (1951), to obtain accurate optical absorption spectra. A first approximation at a much reduced computational cost could be obtained by simply adding the vibrational shift, , calculated in this work to the static lattice optical absorption spectra of Refs. Hahn et al. (2005) and Fang et al. (2015). Vibrationally renormalised optical absorption spectra of ice have not been calculated before, although they have been reported for other materials Marini (2008); Noffsinger et al. (2012); Patrick and Giustino (2014).
The absolute sizes of the vibrational corrections, , for different proton-orderings converge very slowly with the size of the simulation cell or, equivalently, with the density of the Brillouin Zone sampling (Figs. 3 (a) and (b), main panels). However, the differences in between structures converge rapidly (Figs. 3 (a) and (b), insets).
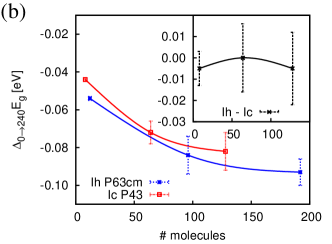
The relative of various orthorhombic, 8-molecule proton-orderings are converged to better than around . Despite the difference in shape and size of the simulation cell, the of the hexagonal, 12-molecule Ih proton-ordering is converged to within relative to the orthorhombic, 8-molecule proton-orderings. This justifies the use of 8-molecule simulation cells in obtaining accurate relative band-gap corrections between different proton-orderings and between Ih and Ic. Supplementary Fig. S12 provides further support for this observation. We use simulation cells with up to 192 molecules to converge the absolute with respect to simulation cell size to within .
III Vibrational Band Gap Renormalisation
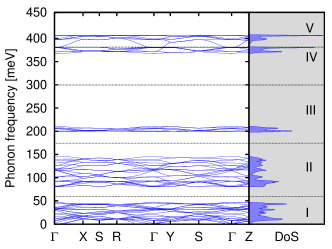
The vibrational density of states (DoS) of Ih (shown in Fig. 4) and Ic splits into five regimes: pseudo-translation modes (I), librational modes (II), molecular bending modes (III) and molecular (anti-) symmetric O-H stretching modes (IV and V). In Ref. Monserrat et al. (2015) we showed that crystal modes (pseudo-translation and librational modes) and molecular modes (bending and O-H stretching modes) each contribute around half of the large band-gap correction in Ih of around (0) obtained for a 192-molecule simulation cell.
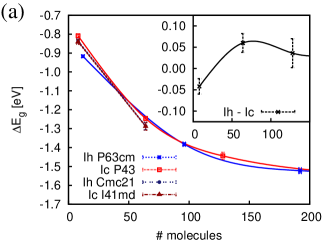
Figs. 5 (a) and (b) show (0) for protiated and deuterated 8-molecule proton-ordered Ih and Ic structures. The band-gap corrections are very similar in Ih and Ic.
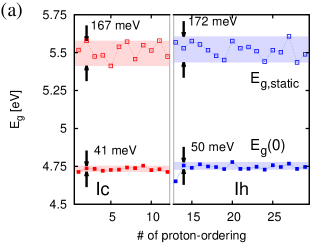
While the vibrational corrections, , shown in Fig. 5 (a) obtained for the 8-molecule unit cells are only converged to simulation cell size errors of around , the relative of the proton-orderings are converged to less than (see Section II and, in particular, Fig. 3), which is sufficient to distinguish between different proton-orderings.
Figs. 5 (a) and (b) show that nuclear vibrations largely average out differences in the band gaps obtained with different proton-orderings, reducing variations across proton-orderings in (0) by almost 3/4, i.e., from around to . This occurs because the protons are effectively smeared out by vibrational motion. The root-mean-square (RMS) vibrational displacements of the protons of around correspond to about 1/3 of the difference in the bond length of an O-H covalent bond and an OH hydrogen bridge bond. While we did not remark on this in our earlier publication Engel et al. (2015), this smearing effect also occurs in the free energies of proton-orderings, albeit in a far less striking way than for the band gaps. See Supplementary Section III sup and Fig. S5 in particular for further details.
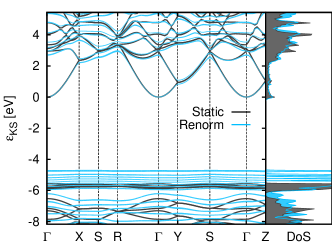
The full static lattice and vibrationally renormalised bandstructures for 8-molecule Ih are shown in Fig. 6.
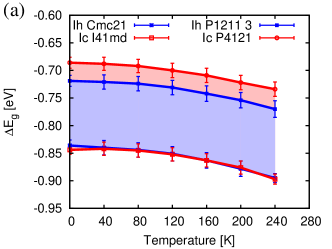
We find that the temperature dependence of is almost independent of the proton-ordering. Fig. 7 (a) shows the temperature dependence of for 8-molecule simulation cells of the Ih and Ic proton-orderings with the smallest and largest (0), respectively. In ice, even up to the melting temperature of K, only the lowest frequency crystal vibrational modes (up to ) are thermally activated. These are long-wavelength modes that do not probe the differences between proton-orderings. As can be seen in Fig. 8, these low-energy crystal modes contribute less than one tenth of the ZP band-gap correction and accordingly the thermal correction up to melting at 273 K of around is less than one tenth of the quantum ZP band-gap correction, (0). Notably, Ref. Shibaguchi et al. (1977) reports the experimental observation of a shift in the (excitonic gap) of upon heating from 103 K to 254 K, which is in reasonable agreement with our calculated value of around obtained for the 192-molecule Ih simulation cell (see Fig. 7).
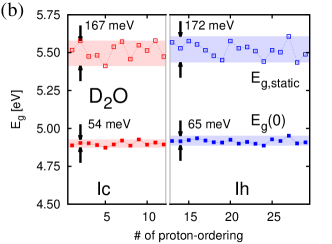
IV Deuterated Ice
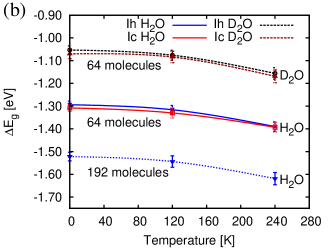
Deuteration of ice leads to a significant softening of all but the low frequency crystal vibrational modes. The resulting vibrational DoS is shown in panel (a) of Supplementary Fig. S8. The larger nuclear mass of deuterons in comparison to protons leads to smaller vibrational displacements. This isotope effect leads to a smaller ZP (0), as shown in Fig. 5 (b) for 64-molecule simulation cells. At the same time, the smaller deuteron vibrational displacements result in a smaller smearing out of the deuteron positions and thus a clearer distinction in (0) between different proton-orderings. The variations across proton-orderings increase from around 41–50 meV in protiated ice to 54–65 meV in deuterated ice. The thermal contribution to , (0) in deuterated ice, however, is of comparable size to that in protiated ice (see Fig. 7 (b)). This follows from the very similar forms of the low frequency DoS of protiated and deuterated ice shown in panel (c) of Supplementary Fig. S8. The low frequency crystal modes up to frequencies of , which become thermally activated at temperatures below 273 K, are collective modes for which the effect of the heavier deuterons is masked by the even heavier oxygen atoms. At high temperatures one might expect the higher ZP (0) in protiated ice to be reflected in a larger temperature dependence, but the crossover point at which all modes are thermally activated is far above melting.
V The Role of Vibrational Anharmonicity
In Ref. Engel et al. (2015) we showed that the effect of (typically quartic) anharmonicity in the Born-Oppenheimer energy surface is to localise the nuclear wavefunctions by 1.5% and 2.5% with respect to the harmonic wavefunctions of Ih and Ic, respectively. This can be understood as a reduction of the anharmonic vibrational displacements, , with respect to the harmonic vibrational displacements, , by a factor and for Ih and Ic, respectively: . Since the dependence of the band gap on is typically well approximated by (see Fig. 2) we expect the anharmonic band-gap correction in Ih, , to be between of the harmonic value, , if to of the harmonic value if . Correspondingly, we expect anharmonic corrections to the band gap of +1.5% to +2.25% of the . Similarly we expect corrections in Ic of +2.5% to +6.25% of the harmonic . The harmonic band-gap correction is around for Ih and Ic, which translates into expected zero-temperature band-gap corrections due to anharmonicity of around 20–35 meV and 40–90 meV for Ih and Ic, respectively. Using the reweighting procedure described in Section II.4, we calculate anharmonic corrections to (0) of + and + for Ih and Ic, respectively, in good agreement with the estimates given above. We use the 96-molecule Ih and the 64-molecule Ic simulation cells.
We note that the band gap corrections due to vibrational anharmonicity in Ih and Ic, and different proton-orderings, only differ by around . Hence the variations in across proton-orderings remain small at around , independent of whether anharmonic nuclear motion is included.
VI Atomistic Insights
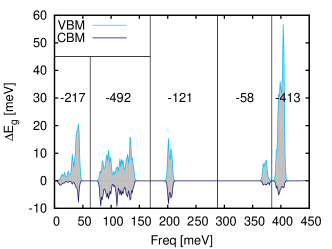
As shown in Fig. 8, the pseudo-translations (0–50 meV), molecular bending modes (195–214 meV) and anti-symmetric O-H bond stretching modes (363–384 meV) together contribute less than of (0) (the individual contributions are around 16%, 10% and 4%, respectively). Librational modes (76–150 meV) and symmetric O-H bond stretching modes (387–411 meV) give large contributions of around and , respectively.
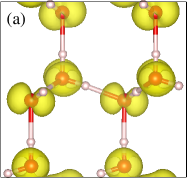
Overall, the vibrational motion of the nuclei predominantly couples to the valence band maximum (VBM), as shown in Fig. 6, in which the peaks corresponding to the valence band states are strongly renormalised and broadened, while the peaks corresponding to the conduction band states remain relatively sharp and distinct. The electron density corresponding to the VBM sits in distorted oxygen lone pair orbitals (see Fig. 9 (a)).
Consequently, the electronic density corresponding to the VBM is significantly distorted by displacements of the protons along their O-H covalent and OH bridge bonds. Such displacements arise, in particular, from the symmetric O-H bond stretching modes, which therefore strongly affect the Kohn-Sham (KS) energy of the VBM.
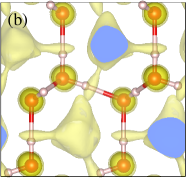
Librational modes also couple to the VBM, albeit less strongly. Unlike the O–H bond stretching modes, librational modes additionally couple significantly to the conduction band minimum (CBM). The electron density corresponding to the CBM is predominantly localised in orbitals of anti-bonding character centered on the oxygen nuclei (see Fig. 9 (b)). These are almost identical for different proton-orderings, due to their practically identical oxygen sublattices (up to a difference in stacking of layers between Ih and Ic). Consequently the electron density corresponding to the CBM is very similar for all proton-orderings. Unlike the O-H bond stretching modes, the librational modes distort the oxygen sublattice with respect to the static configuration, momentarily (though not on average) breaking the tetrahedral coordination of the oxygen atoms and affecting the electron density forming the CBM. Nonetheless, the coupling of the vibrational motion of the nuclei to the CBM is weak due to the atomic-like nature of the electron density of the CBM.
Besides leading to the largest contribution to (0), O–H stretching modes also play the predominant role in smearing out the distinction between proton-orderings, thereby making the VBM energies of different proton-orderings more similar. This effect of reducing differences in (0) between proton-orderings is clearly shown in Fig. 5. While the strong renormalisation of the KS energy of the VBM leads to strong vibrational renormalisation of , the free energy (which corresponds to the sum over all vibrationally renormalised occupied KS bands) is much less affected. Consequently the narrowing of the distribution of lattice free energies of different proton-orderings is far less pronounced than for the band gaps (see Supplementary Section III).
VII Conclusions
Accurate static lattice electronic band gaps can be calculated using theoretical methods such as DFT with semi-local or hybrid functionals, the method, or highly accurate quantum chemical methods. However, it is important to account for vibrational effects when benchmarking calculated electronic band gaps against experiment. We have found vibrational corrections to the static electronic band gaps of water ice of to , which are significant on the scale of the differences between results obtained with these methods and compared to the size of the experimental gap.
Proton-disorder, on the other hand, does not play an important role in determining the electronic bandstructure of Ih and Ic. The use of different proton-orderings in an atomistic simulation affects the energetics of Ih and Ic on the scale of the difference in free energy between Ih and Ic. However, when vibrations are accounted for, the renormalised zero and finite temperature electronic bandstructures of different proton-ordered Ih and Ic structures are very similar. Hence, atomistic simulations of band gaps and optical absorption spectra depend only weakly on the proton-ordering when vibrations are taken into account. The similarity of the vibrationally renormalised electronic bandstructures of different Ih and Ic proton-orderings also implies that measurements of the band gaps or optical absorption spectra of ice samples are not capable of distinguishing between proton-orderings or between Ih, Isd and Ic. Comparing experimental band gaps of protiated and deuterated ice would provide a straightforward means of accessing quantum zero-point effects. Such measurements might allow the resolution of the predicted difference in the band gaps of protiated and deuterated ice of around .
Non-quadratic behaviour plays a crucial role in water ice. For example, accurate vibrationally renormalised electronic band gaps can only be calculated by carefully accounting for the strongly non-quadratic dependence of the band gap on the vibrational displacements. In fact, if accuracies of tens of meV for electronic band gaps are to be achieved, vibrational anharmonicity must be accounted for as well. Anharmonic nuclear vibrations are crucial in understanding the relative stability of Ih and Ic Engel et al. (2015) and many other phenomena. It would be of great interest to study the role of anharmonicity at ice surfaces and in the presence of impurities or other defects.
Acknowledgements. We acknowledge financial support from the Engineering and Physical Sciences Research Council of the UK [EP/J017639/1]. B. M. also acknowledges Robinson College, Cambridge, and the Cambridge Philosophical Society for a Henslow Research Fellowship. The calculations were performed using the Cambridge High Performance Computing Service facility and the Archer facility of the UK’s national high-performance computing service (for which access was obtained via the UKCP consortium [EP/K013564/1]).
References
- Weingärtner and Franck (2005) H. Weingärtner and E. Franck, Angew. Chem. Int. Ed., 44, 2672 (2005).
- Liebscher (2010) A. Liebscher, Geofluids, 10, 3 (2010).
- Bartels-Rausch et al. (2012) T. Bartels-Rausch, V. Bergeron, J. H. E. Cartwright, R. Escribano, J. L. Finney, H. Grothe, P. J. Gutiérrez, J. Haapala, W. F. Kuhs, J. B. C. Pettersson, S. D. Price, C. I. Sainz-Díaz, D. J. Stokes, G. Strazzulla, E. S. Thomson, H. Trinks, and N. Uras-Aytemiz, Rev. Mod. Phys., 84, 885 (2012).
- Baker and Peter (2008) M. B. Baker and T. Peter, Nature, 451, 299 (2008).
- Young (1993) K. C. Young, Microphysical Processes in Clouds. (Oxford University Press, New York, 1993).
- George et al. (2014) C. George et al., Atmospheric and Aerosol Chemistry, edited by V. F. McNeill and P. A. Ariya (Springer, 2014).
- Betterton and Anderson (2001) E. A. Betterton and D. J. Anderson, J. Atmos. Chem., 40, 171 (2001).
- Grannas et al. (2007) A. M. Grannas et al., Atmos. Chem. Phys., 7, 4329 (2007).
- Heger et al. (2005) D. Heger, J. Jirkovsky, and P. Klan, J. Phys. Chem. A, 109, 6702 (2005).
- Takenaka and Bandow (2007) N. Takenaka and H. Bandow, J. Phys. Chem. A, 111, 8780 (2007).
- Takenaka et al. (1992) N. Takenaka, A. Ueda, and Y. Maeda, Nature, 358, 736 (1992).
- Park et al. (2010) S.-C. Park, E.-S. Moon, and H. Kang, Phys. Chem. Chem. Phys., 12, 12000 (2010).
- Boxe et al. (2006) C. S. Boxe, A. J. Colussi, M. R. Hoffmann, I. M. Perez, J. G. Murphy, and R. C. Cohen, J. Phys. Chem. A, 110, 3578 (2006).
- Kahan and Donaldson (2007) T. F. Kahan and D. J. Donaldson, J. Phys. Chem. A, 111, 1277 (2007).
- Klanova et al. (2003) J. Klanova, P. Klan, J. Nosek, and I. Holoubek, Environ. Sci. Technol., 37, 1568 (2003).
- Bishop et al. (2011) M. P. Bishop et al., Encyclopedia of Snow, Ice and Glaciers, edited by V. P. Singh, P. Singh, and U. K. Haritashya (Springer, 2011).
- Chandler (1998) D. Chandler, Classical and Quantum Dynamics in Condensed Phase Simulations., edited by B. J. Berne, G. Ciccotti, and D. F. Coke (World Scientific, 1998).
- Marcus (1956) R. A. Marcus, J. Chem. Phys., 24, 966 (1956).
- Cucinotta et al. (2012) C. S. Cucinotta, I. Rungger, and S. Sanvito, J. Phys. Chem. C, 116, 22129 (2012).
- Hama et al. (1990) J. Hama, Y. Shiomi, and K. Suito, J. Phys. Condens. Matter, 2, 8107 (1990).
- Cavazzoni et al. (1999) C. Cavazzoni et al., Science, 283, 44–46 (1999).
- Mattsson and Desjarlais (2006) T. R. Mattsson and M. P. Desjarlais, Phys. Rev. Lett., 97, 017801 (2006).
- Hermann et al. (2012) A. Hermann, N. Ashcroft, and R. Hoffmann, Proc. Natl Acad. Sci., 109, 745–750 (2012).
- Pickard et al. (2013) C. J. Pickard, M. Martinez-Canales, and R. J. Needs, Phys. Rev. Lett., 110, 245701 (2013).
- Pan et al. (2014) D. Pan, Q. Wan, and G. Galli, Nature Commun., 5, 3919 (2014a).
- Ness et al. (1986) N. F. Ness et al., Science, 233, 85 (1986).
- Engel et al. (2015) E. A. Engel, B. Monserrat, and R. J. Needs, Phys. Rev. X, 5, 021033 (2015).
- Zacharias et al. (2015) M. Zacharias, C. E. Patrick, and F. Giustino, Phys. Rev. Lett., 115, 177401 (2015).
- Hahn et al. (2005) P. H. Hahn, W. G. Schmidt, K. Seino, M. Preuss, F. Bechstedt, and J. Bernholc, Phys. Rev. Lett., 94, 037404 (2005).
- Fang et al. (2015) C. Fang, W.-F. Li, R. S. Koster, J. Klimeš, A. van Blaaderen, and M. A. van Huis, Phys. Chem. Chem. Phys., 17, 365 (2015).
- Warren (1984) S. G. Warren, Applied Optics, 23, 1206 (1984).
- Minton (1971) A. P. Minton, J. Phys. Chem., 75, 1162 (1971).
- Painter et al. (1969) L. R. Painter, R. D. Birkhoff, and E. T. Arakawa, J. Chem. Phys., 51, 243 (1969).
- Seki et al. (1981) M. Seki, K. Kobayashi, and J. Nakahara, J. Phys. Soc. Jap., 50, 2643 (1981).
- Shibaguchi et al. (1977) T. Shibaguchi, H. Onuki, and R. Onaka, J. Phys. Soc. Jap., 42, 152 (1977).
- Paier et al. (2006) J. Paier, M. Marsman, K. Hummer, G. Kresse, I. C. Gerber, and J. G. Ángyán, J. Chem. Phys., 124, 154709 (2006).
- Clark and Robertson (2010) S. J. Clark and J. Robertson, Phys. Rev. B, 82, 085208 (2010).
- Hedin (1965) L. Hedin, Phys. Rev., 139, 796 (1965).
- Hedin and Lundqvist (1969) L. Hedin and S. Lundqvist, Solid State Physics., edited by F. Seitz, D. Turnbull, and H. Ehrenreich (Academic Press, 1969).
- Hybertsen and Louie (1985) M. S. Hybertsen and S. G. Louie, Phys. Rev. Lett., 55, 1418 (1985).
- Godby et al. (1988) R. W. Godby, M. Schlüter, and L. J. Sham, Phys. Rev. B, 37, 10159 (1988).
- Aulbur et al. (2000) W. G. Aulbur, L. Jonsson, and J. W. Wilkins, Solid State Physics, 54, 1 (2000).
- Cramer (2002) C. J. Cramer, Essentials of Computational Chemistry (Wiley & Sons, Inc., 2002) pp. 191–232.
- Shavitt and Bartlett (2009) I. Shavitt and R. J. Bartlett, Many-Body Methods in Chemistry and Physics: MBPT and Coupled-Cluster Theory (Cambridge University Press, 2009).
- Ceperley and Alder (1980) D. M. Ceperley and B. J. Alder, Phys. Rev. Lett., 45, 566 (1980).
- Foulkes et al. (2001) W. M. C. Foulkes, L. Mitas, R. J. Needs, and G. Rajagopal, Rev. Mod. Phys., 73, 33 (2001).
- Needs et al. (2010) R. J. Needs, M. D. Towler, N. D. Drummond, and P. López Ríos, J. Phys.: Cond. Mat., 22, 023201 (2010).
- Drummond et al. (2005) N. D. Drummond, A. J. Williamson, R. J. Needs, and G. Galli, Phys. Rev. Lett., 95, 096801 (2005).
- Williamson et al. (1998) A. J. Williamson, R. Q. Hood, R. J. Needs, and G. Rajagopal, Phys. Rev. B, 57, 12140 (1998).
- Monserrat et al. (2015) B. Monserrat, E. A. Engel, and R. J. Needs, Phys. Rev. B: Rapid Commun., 92, 140302(R) (2015).
- Sanchez-Valle et al. (2013) C. Sanchez-Valle, D. Mantegazzi, J. Bass, and E. Reusser, J. Chem. Phys., 138, 054505 (2013).
- Monserrat et al. (2014) B. Monserrat, G. J. Conduit, and R. J. Needs, Phys. Rev. B, 90, 184302 (2014a).
- Bernal and Fowler (1933) J. D. Bernal and R. H. Fowler, J. Chem. Phys., 1, 515 (1933).
- König (1944) H. König, Z. Kristallogr., 105, 279 (1944).
- Murray et al. (2005) B. J. Murray, D. A. Knopf, and A. K. Bertram, Nature, 434, 202 (2005).
- Shilling et al. (2006) J. E. Shilling, M. A. Tolbert, O. B. Toon, E. J. Jensen, B. J. Murray, and A. K. Bertram, Geophys. Res. Lett., 33, L17801 (2006).
- Malkin et al. (2015) T. L. Malkin, B. J. Murray, C. G. Salzmann, V. Molinero, S. J. Pickering, and T. F. Whale, Phys. Chem. Chem. Phys., 17, 60 (2015).
- Kuhs et al. (2012) W. F. Kuhs, C. Sippel, A. Falenty, and T. C. Hansen, Proc. Nat. Acad. Sci. U.S.A., 109, 21259 (2012).
- Carr et al. (2014) T. H. G. Carr, J. J. Shephard, and C. G. Salzmann, J. Phys. Chem. Lett., 5, 2469 (2014).
- Pauling (1935) L. Pauling, J. Am. Chem. Soc., 57, 2680 (1935).
- Tajima et al. (1982) Y. Tajima, T. Matsuo, and H. Suga, Nature, 299, 810 (1982).
- Jackson and Whitworth (1997) S. M. Jackson and R. W. Whitworth, J. Phys. Chem. B, 101, 6177 (1997).
- Nagle (1966) J. F. Nagle, J. Math. Phys., 7, 1484 (1966).
- Herrero and Ramírez (2014) C. P. Herrero and R. Ramírez, J. Chem. Phys., 140, 234502 (2014).
- Hirsch and Ojamäe (2004) K. Hirsch and L. Ojamäe, J. Phys. Chem. B, 108, 15856 (2004).
- Raza et al. (2011) Z. Raza, D. Alfè, C. G. Salzmann, J. Klimeš, A. Michaelides, and B. Slater, Phys. Chem. Chem. Phys., 13, 19788 (2011).
- Lekner (1998) J. Lekner, Physica B: Cond. Mat., 252, 149 (1998).
- Singer et al. (2005) S. J. Singer, J. Kuo, T. K. Hirsch, C. Knight, L. Ojamäe, and M. L. Klein, Phys. Rev. Lett., 94, 135701 (2005).
- (69) See Supplemental Material at http://… for more information on the convergence of the band gap corrections with the simulation cell size, the failure of the quadratic approximation for the electronic band gap in ice, vibrational averaging over proton-orderings, the atomistic picture, the choice of the exchange-correlation functional and the effects of unit cell expansion, correlated sampling for the temperature dependence of the band gap, and the effects of large vibrational displacements on band gap measurements.
- Clark et al. (2005) S. J. Clark, M. D. Segall, C. J. Pickard, P. J. Hasnip, M. I. J. Probert, K. Refson, and M. C. Payne, Z. Kristallogr., 220, 567 (2005).
- Perdew et al. (1996) J. P. Perdew, K. Burke, and M. Ernzerhof, Phys. Rev. Lett., 77, 3865 (1996).
- Santra et al. (2013) B. Santra, J. Klimeš, A. Tkatchenko, D. Alfè, B. Slater, A. Michaelides, R. Car, and M. Scheffler, J. Chem. Phys., 139, 154702 (2013).
- Vanderbilt (1990) D. Vanderbilt, Phys. Rev. B, 41, 7892 (1990).
- Kunc and Martin (1982) K. Kunc and R. M. Martin, Phys. Rev. Lett., 48, 406 (1982).
- Monserrat et al. (2013) B. Monserrat, N. D. Drummond, and R. J. Needs, Phys. Rev. B, 87, 144302 (2013).
- Patrick and Giustino (2014) C. E. Patrick and F. Giustino, J. Phys.: Cond. Mat., 26, 365503 (2014a).
- Gonze et al. (2011) X. Gonze, P. Boulanger, and M. Côté, Ann. Phys., 523, 168 (2011).
- Monserrat et al. (2014) B. Monserrat, R. J. Needs, and C. J. Pickard, J. Chem. Phys., 141, 134113 (2014b).
- Bethe and Salpeter (1951) H. Bethe and E. Salpeter, Phys. Rev., 84, 1232 (1951).
- Marini (2008) A. Marini, Phys. Rev. Lett., 101, 106405 (2008).
- Noffsinger et al. (2012) J. Noffsinger, E. Kioupakis, C. G. Van de Walle, S. G. Louie, and M. L. Cohen, Phys. Rev. Lett., 108, 167402 (2012).
- Patrick and Giustino (2014) C. E. Patrick and F. Giustino, J. Phys.: Cond. Matt., 26, 365503 (2014b).
- Schöherr et al. (2014) M. Schönherr and B. Slater and J. Hutter and J. VandeVondele, J. Phys. Chem. B, 118, 590 (2014b).