Advantages of EEG phase patterns for the detection of gait intention in healthy and stroke subjects
Abstract
One use of EEG-based brain-computer interfaces (BCIs) in rehabilitation is the detection of movement intention. In this paper we investigate for the first time the instantaneous phase of movement related cortical potential (MRCP) and its application to the detection of gait intention. We demonstrate the utility of MRCP phase in two independent datasets, in which 10 healthy subjects and 9 chronic stroke patients executed a self-initiated gait task in three sessions. Phase features were compared to more conventional amplitude and power features. The neurophysiology analysis showed that phase features have higher signal-to-noise ratio than the other features. Also, BCI detectors of gait intention based on phase, amplitude, and their combination were evaluated under three conditions: session specific calibration, intersession transfer, and intersubject transfer. Results show that the phase based detector is the most accurate for session specific calibration (movement intention was correctly detected in 66.5% of trials in healthy subjects, and in 63.3% in stroke patients). However, in intersession and intersubject transfer, the detector that combines amplitude and phase features is the most accurate one and the only that retains its accuracy (62.5% in healthy subjects and 59% in stroke patients) w.r.t. session specific calibration. Thus, MRCP phase features improve the detection of gait intention and could be used in practice to remove time-consuming BCI recalibration.
Index Terms:
EEG, BCI, gait intention, MRCP, intersession transfer, intersubject transfer, instantaneous phaseI Introduction
Brain computer interfaces (BCIs) as a rehabilitaton tool have been used to restore functions in patients with gait impairments by actively involving the central nervous system to trigger prosthetic devices according to the detected intention to walk [1]. One of the most investigated neural correlates of movement intention, as imaged by electroencephalogram (EEG), is the movement related cortical potential (MRCP) [2, 3]. The relation between MRCP and movement intention has been extensively studied with EEG-based BCIs in the context of self-paced lower limb movements and gait [4, 5, 6, 7, 8, 9, 10].
All studies that used MRCP information for the detection of movement intention explored the amplitude representation of the neural correlate [11, 12, 13, 14, 15, 9, 16, 17]. In particular, the amplitude of the MRCP has been used to detect gait intention in healthy subjects within session [9] and between sessions [16]. In the frequency domain, the neural correlate of movement intention is the event related (de)-synchronization (ERD/S) in mu and beta bands [18, 19, 20, 21, 22, 23]. An improvement in performance within session and between sessions was obtained by combining the two motor intention neural correlates [24, 25, 16, 17]. Recent work has been carried out to eliminate or to diminish the time required for BCI calibration in intersession and intersubject transfer learning [26, 27, 28, 29, 30, 31, 32, 33, 15, 34, 35, 16, 17, 36, 37].
Although phase patterns have been investigated before in the context of event related-potentials in theta and alpha band, the MRCP phase representation ( Hz delta oscillations) has not been explored yet. Oscillatory activity in theta and alpha bands revealed that instantaneous phase patterns can contain information about the response to external stimuli (visual or auditory event-related potentials) [38, 39]. Furthermore, they found that the information that can be discriminated by firing rates can also be discriminated by phase patterns, but not by power. In the delta frequency band, in which the MRCP is also observed, recent studies [40, 41] have reported that the phase patterns are linked to the anticipation of visual and auditory stimuli. However, it remains unknown whether the phase patterns of the slow oscillations in the delta band are as discriminable as the amplitude patterns, as shown before for faster oscillations [38, 39]. In studies about movement related neural correlates, phase patterns have been investigated mainly in the mu band as a metric of connectivity between brain areas [42, 43, 44, 45, 46, 47].
In this paper we present first, the decomposition of MRCP amplitude into instantaneous phase and power, and second, we present three detectors of gait intention based on (a) MRCP amplitude, (b) MRCP instantaneous phase and (c) a combination of MRCP amplitude and MRCP instantaneous phase. We performed our analysis on two independent datasets recorded previously in separate studies, one in healthy subjects [16] and another in chronic stroke patients [17]. The group of healthy subjects is not a control group for the patients. Both groups of subjects underwent three self-paced walking sessions with one week between them. We show the applicability of the detectors of walking intention in three cases: within session, between sessions and between subjects, without recalibration.
Our findings indicate that MRCP instantaneous phase shows higher signal-to-noise ratio than amplitude and instantaneous power. This characteristic of phase yields higher detection accuracy of pre-movement state within session, as well as an earlier detection of movement intention compared to the MRCP amplitude based detector. Previous work [48] has shown that the latency of the detection of movement intention has an important effect on neuroplasticity and relearning. Small detection latencies relative to the movement onset aid functional recovery in rehabilitation therapies. Furthermore, patients are fatigue-prone in prolonged and repetitive therapy sessions. Thus, it would be beneficial to remove the need for session- and subject-specific BCI recalibration. By combining MRCP amplitude and phase information, without recalibration, we attained a detector with a more robust performance between sessions and subjects, outperforming the detectors that use only one type of information.
II Materials and methods
II-A Description of the datasets
Two previously recorded datasets from two separate studies [16, 17] have been used in the current analysis. More information about the demographic and clinical information of the participants, the experimental procedure and the data acquisition can be found in the Supplementary Materials.
II-A1 Dataset 1
Ten volunteers (six males and four females, mean age = 26.4 years, SD = 4.8 years) participated in the experiment described in [16]. All subjects were healthy without any known neurological anomalies and musculo-skeletal disorders.
II-A2 Dataset 2
Nine chronic stroke patients (six males and three females, mean age = 59.7 years, SD = 11.3 years) participated in the experiment presented in [17]. Demographic and clinical information of the participants can be found in [17].
The experimental protocol in the two datasets was approved by the ethical committee of the HYPER project (approval number 12/104) 111This project is part of the Spanish Ministry of Science Consolider Ingenio program, HYPER (Hybrid Neuroprosthetic and Neurorobotic Devices for Functional Compensation and Rehabilitation of Motor Disorders) - CSD2009-00067. and all subjects gave written informed consent before participating in the experiments. Figure 1 illustrates the structure of one trial of the experimental protocol.

In each of the datasets, the experimental protocol was performed in three sessions with one week between them. Each session had a total of 100 trials. In each trial, subjects were instructed with visual cues (in the healthy subjects) or auditory cues (in the stroke patients) to relax for the first s, then start walking whenever they wanted, but not before waiting at least s after the instruction cue. After each ten trials there were break intervals with a duration adjusted to the need of the participants. The experimental protocol was slightly modified in the second dataset, for the stroke group, to accommodate flexible pauses for patients to regain balance.
In the two datasets EEG data was recorded using 30 EEG water based electrodes (from TMSi, Enschede, The Netherlands) located according to the 10/10 international system [49]. The ground was placed on the right wrist and two sensors located on the ear lobes have been used for average linked ears reference. Electromyographic (EMG) activity and footswitch presses were recorded during the experiment with healthy subjects and only the EMG activity, during the recordings with patients.
II-B Data processing
EEG data was filtered with a Butterworth second order zero-phase shift band-pass filter at Hz. EMG data was filtered at Hz using a Butterworth second order zero-phase shift band-pass filter. For the data in the first dataset, the onset of motion was computed as being half a second before the footswitch release. For the second dataset, EMG data was used for the computation of movement onset, since the acquisition of the footswitch activity was impractical in the experiment with stroke patients due to different levels of mobility impairments. The EMG data was Hilbert transformed and a threshold of 10% of the highest value from the averaged EMG power across trials was computed. The onset of motion was defined as ms before the threshold crossing. The trials in which the onset of motion was detected before the preparation of movement cue were rejected as considered artifactual due to erroneous execution of the experimental protocol. No trials have been rejected in the first dataset. After trial rejection, in the second dataset, there were in average across subjects and sessions 96 remaining trials, in a range between 86 and 100 trials.
In both datasets, the remaining trials were segmented into s long epochs according to the movement onset (each epoch lasted from to s relative to the movement onset). EEG data in dataset 1 was processed with FastICA [50] for artifact correction, as described in [16]. For the EEG data in dataset 2, trials that were contaminated by large, infrequent artifacts were removed using the joint probability function from EEGLAB 13.3.2 toolbox [51]. Next the remaining trials were processed with FastICA.
Movement related cortical potentials (MRCP) were analyzed as EEG neural correlates of gait intention. For the analysis, EEG data was band-pass filtered with a zero-phase shift Butterworth second order filter at Hz. As shown in [52], this low-frequency filter has reliable characteristics for the analysis of MRCPs.
The MRCP amplitude signals were decomposed into instantaneous amplitude and instantaneous phase using the analytic representation 222Note that the MRCP amplitude signals are the original signals before Hilbert transform, while the instantaneous amplitude is a component of the MRCP signals obtained after Hilbert transform.
| (1) |
where HT() is the Hilbert transform of the signal , defined as
| (2) |
where P.V. denotes Cauchy principal value. Therefore, the analytic signals were obtained for each electrode. The instantaneous amplitude is expressed by and the instantaneous phase by . A convenient mathematical representation of phase angles as vectors with unit length is given by Euler’s formula (). To characterize the inter-trial phase consistency between narrow-band signals, phase locking value (PLV) is frequently used,
| (3) |
where N represents the total number of trials [53]. This measurement is performed by averaging the vectors (not their phase angles) and taking the length of the average vector as a measure of uniformity in the polar space. PLV ranges between zero and one, where zero indicates completely uniformly distributed phase angles and one indicates completely identical phase angles [54].
II-C Neurophysiological analysis
We conducted the neurophysiological analysis at two levels, using the first session of the two datasets. First, at a scalp level, we performed a temporal analysis to investigate three types of features:
-
1.
MRCP amplitude features of the signal filtered in Hz frequency band;
-
2.
MRCP phase features: instantaneous phase features obtained with Hilbert transform, and PLV as a summary statistic for single-trial instantaneous phase features;
-
3.
MRCP (instantaneous) power features obtained with Hilbert transform as the logarithm of squared instantaneous amplitude values and multiplied by 10 to yield the decibels scale.
Second, for channel Cz, which exhibits relevant patterns related to gait intention over the motor areas [9, 16], we conducted a statistical analysis to assess the signal-to-noise ratio of the features. Therefore, we computed the effect size for each type of feature relative to the baseline interval (between and s relative to the movement onset). More precisely, we computed the average of the three features over trials, for each subject. Next we calculated the baseline mean and standard deviation. Finally we quantified the effect size, for each feature type, by subtracting from the grand average activity (over subjects) the grand average baseline, and dividing by the standard deviation of the baseline.
We performed for each of the datasets, a statistical analysis at neurophysiological level, using pairwise Wilcoxon signed rank tests. For the analysis we used the absolute values of the effect sizes of the three features (amplitude, instantaneous phase and power) in channel Cz. We used a non-parametric test to avoid inappropriate assumptions about the distribution of the features. We chose to compare the absolute values of the effect size due to the differences in sign between them. Next we corrected for multiple comparisons using Bonferroni-Holm correction [55]. We evaluated the statistical significance between the effect sizes of the three representations in the intention of motion interval (s).
II-D Feature extraction and classification
At the classification level, we studied the MRCP amplitude and instantaneous phase features. The instantaneous phase features were decomposed into sine and cosine features according to Euler’s formula. Features for both processes were extracted from ten electrodes with a one second long sliding window in steps of ms. The ten electrodes (F3, Fz, F4, FC1, FC2, C3, Cz, C4, CP1 and CP2) were located over the precentral, central and postcentral motor and sensorimotor cortex. Windows between and s were labeled as relaxation state and those from to s as pre-movement state. We analyzed a total of 41 windows per trial out of which the last 8 belonged to the pre-movement class. Before training the classifier, features were normalized to unit Euclidean length.
For the classification we used a support-vector machine (SVM) with radial basis function (RBF) kernel. This method has two hyperparameters: the RBF parameter and the regularization parameter C. We used this method due to the nonlinear nature of the instantaneous phase features.
Three detection models were built based on different sets of features: (1) Amplitude model, a single-view detection model based on low-frequency MRCP amplitude features, (2) Phase model, a single-view detection model based on MRCP instantaneous phase features, and (3) Amplitude + Phase model, a multi-view detection model. The first layer of the multi-view model contains, as features, the outputs of the two single-view detectors, Amplitude model and Phase model, while in the second layer we used linear discriminant analysis to combine the two single-view models.
Model selection and artifact cleaning procedures were performed on each fold inside a -fold nested chronological cross-validation [56]. During model selection, the SVM hyperparameters, RBF parameter and regularization parameter C, were selected using a grid search in the inner loop of the cross-validation. The search range for both parameters was between and . The probability threshold was automatically selected in the inner loop of the cross-validation as the one that maximizes the performance on the validation set of the inner loop. In the outer loop we computed the classification performance.
II-E Evaluation
We assessed the performance of the detection models in intra- and intersession conditions. In the intrasession condition, we evaluated the detection models in a -fold chronological cross-validation using subject-specific data within a session. In the intersession transfer condition we trained the detection models with data from one session and tested on all the data of a subsequent session, respecting the chronological order of the sessions in each of the datasets.
For the assessment of the three detection models (Amplitude model, Phase model and Amplitude + Phase model) in the intra- and intersession conditions, we used two metrics of performance: at the level of window and at the level of trial (sequence of sliding windows).
At the window level we measured the performance of correctly classified windows using receiver operating characteristic (ROC) curves. We conducted this analysis for all the models in intrasession and intersession conditions. In order to asses the performance while taking into account the empirical chance level, we have also used the Cohen’s kappa [57].
At the trial level we assessed the performance of the models, in all the conditions as the percentage of correctly classified trials [16]. This metric is dependent on the labeling sequence of the sliding windows. Pre-movement class ( s to the onset of movement, equivalent to the last 8 sliding windows) was defined as the positive class. Thus a correct trial is defined according to the following logical expression:
| (4) |
where FP and TP are the false and the true positive windows, respectively, and i represents the index of the window. The symbol stands for the logical product, while the symbol stands for the logical sum of the windows. In other words, the logical expression defines as correct a trial in which there are no false positive windows and there is at least one true positive window. This metric gives a conservative estimate of performance compared to the accuracy computed at the level of windows. Furthermore, this metric is more meaningful in rehabilitation scenarios, in which neural plasticity and implicitly functional recovery are determined by the correctly detected self-initiated (attempts of) movement of the participants [1].
We conducted statistical tests of the trial-based performance using repeated measures two-way ANOVA, with factors “detection model type” (amplitude, phase, combined amplitude and phase) and “evaluation type” (intra- and intersession), in which the averaged performance across sessions for individual subjects are the repeated measures. We tested for the sphericity of the data using the Mauchly’s test. We evaluated the difference between intra- and intersession conditions using pairwise -tests. We corrected for multiple comparisons using the Bonferroni-Holm correction.
In addition to the transfer between sessions we performed the intersubject evaluation in a leave-one subject out cross-validation within each session using the trial-based metric. In each dataset, we trained the models with the data of all but one subject and evaluated on the data of the left out subject. We repeated the procedure, evaluating for each subject of the two groups. The intrasubject evaluation was equivalent with the intrasession evaluation.
We evaluated the difference between intra- and intersubject conditions using a pairwise Wilcoxon signed rank test. We corrected for multiple comparisons using the Bonferroni-Holm correction.
Furthermore, we performed the analysis of the detection time (latency) for the intrasession condition based on the probability outputs of the correctly classified trials, for all the detection models and subjects. The detection time was computed as the time point of the first true positive window (first window correctly classified as movement intention). We performed a pairwise Wilcoxon signed rank statistical test of the detection time between the three detection models, for each dataset and corrected for multiple comparisons using Bonferroni-Holm correction.
The statistical analysis was conducted in R [58], while the rest of the analysis was performed in Matlab R2011a (MathWorks, Massachusetts, US).
III Results
III-A Neurophysiological analysis of healthy subjects
Figure 2 shows the low-frequency EEG correlates of gait intention in healthy subjects (dataset 1). Figure 2A presents the MRCP features in grand average over subjects. On the first panel the MRCP amplitude pattern is observed as a negative deflection in the activity recorded by electrodes located over the motor cortex, starting s prior to the movement onset. The middle panel shows the PLV or the phase synchronization. An increase in PLV over the motor cortex electrodes indicates a higher synchronization in the phases patterns starting s prior to the movement onset. The bottom panel presents the evolution of low-frequency power across time. In the proximity of movement onset there is a slight increase in power.
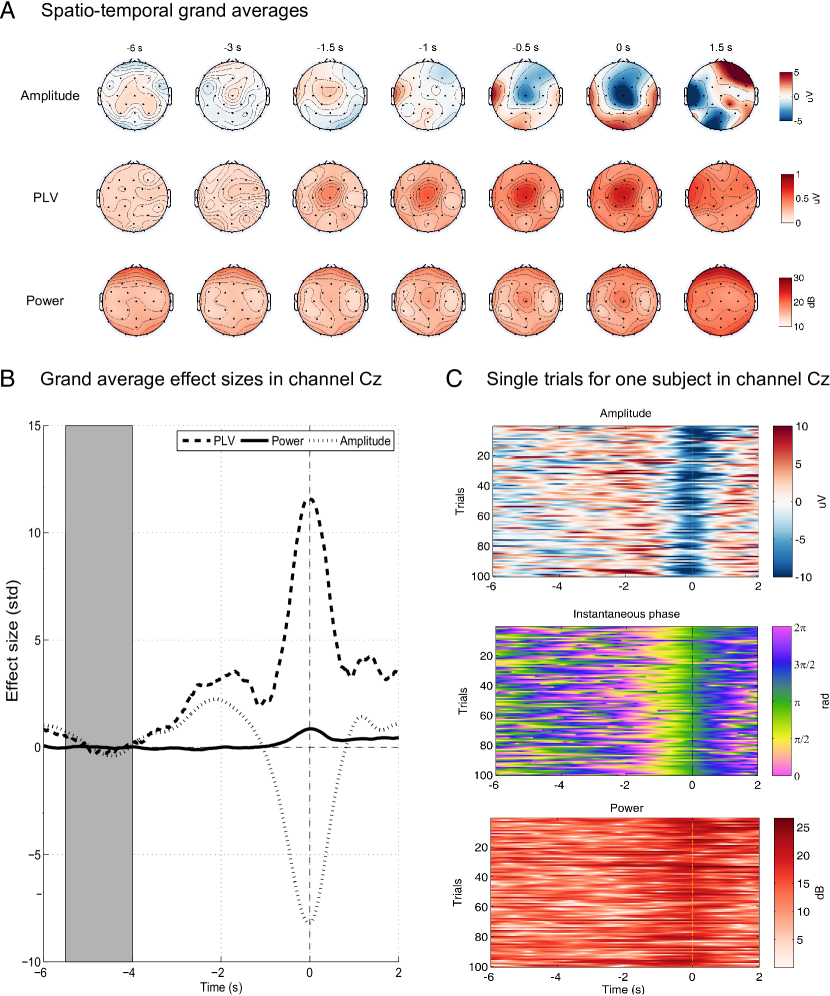
Figure 2B presents the size of the effect of the movement intention on the three features across channel Cz. This channel is chosen because it presents a relevant pattern over motor areas for all types of features [9, 16]. The estimation of the effect size was done relative to the baseline interval () s with respect to the movement onset. In the intention of motion interval () s, PLV has the largest average effect size (5.25 standard deviations), while the amplitude of the MRCP has a lower average effect size (3.23 standard deviations). Power shows the smallest effect size (0.26 standard deviations).
We evaluated the statistical significance between the absolute value of the averaged effect size of the three representations (amplitude, instantaneous phase and power) in the intention of motion interval () s using a pairwise Wilcoxon test. After the Bonferroni-Holm correction we found a statistically significant difference between instantaneous phase and power ( = 0.002), as well as between amplitude and power ( = 0.027). However, the difference between instantaneous phase and amplitude was not statistically significant ( = 0.556).
Figure 2C illustrates the behavior of the three types of features in single trials over the central channel Cz for one representative subject. The course of the MRCP amplitude feature across trials is shown in the top panel. A decrease in amplitude is visible s before the onset of motion. The middle panel presents a synchronization of instantaneous phase across trials. After s prior to the movement onset, there is an ascending trend in phase from /2 to . Next, in the bottom panel power shows a less robust pattern across trials compared to the MRCP instantaneous phase or amplitude representations.
III-B Evaluation of detection models in healthy subjects
III-B1 Intra- and intersession evaluation
We evaluated the detection performance in healthy subjects during the intra- and intersession conditions using two metrics: window-based and trial-based.
Window-based performance
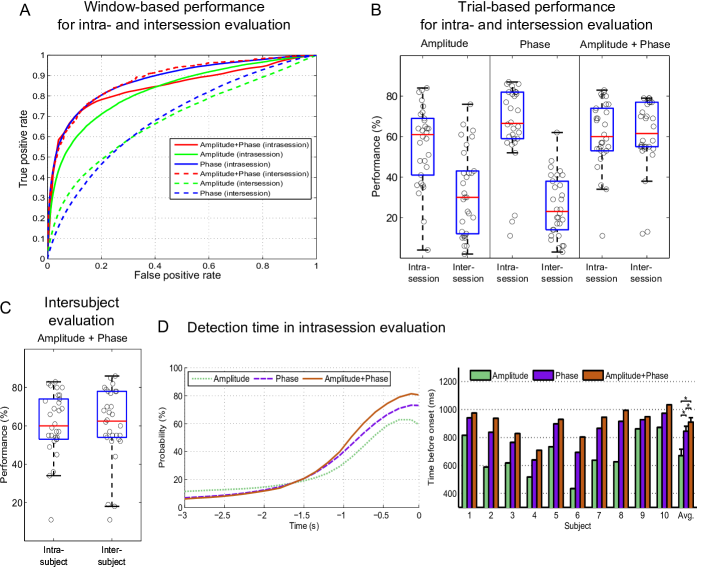
Figure 3A presents the averaged ROC curves across subjects for the three detection models, in two evaluation conditions, intrasession and intersession. To quantify the window-based performance in our unbalanced experimental design, we computed the area under the curve (AUC) as a summary statistic of the presented ROC curves. During intrasession the highest averaged AUC was attained for the Phase model ( = 0.88, = 0.09), while the lowest AUC was obtained using the Amplitude model ( = 0.82, = 0.09). For the intersession, the highest AUC was obtained using the multi-view model ( = 0.87, = 0.09), and the lowest AUC was attained using the Amplitude model ( = 0.69, = 0.16). We attained the average empirical chance level of 592%, with Cohen’s = 0.680.1. From these findings we conclude that in the group of healthy subjects, the Phase model is the most reliable in intrasession, while in intersession the Amplitude + Phase model attains higher performance relative to the other detection models.
 |
Trial-based performance
Figure 3B shows the performance of the three detection models at trial level, as percentage of correctly classified trials, in intrasession and intersession conditions.
In intrasession evaluation the Phase model attains the highest percentage of correctly classified trials ( = 66.5%, range = 11% - 87%), followed by the Amplitude model ( = 61%, range = 4% - 84%) and by the Amplitude + Phase model ( = 60%, range = 11% - 83%).
During the intersession transfer condition, the multi-view model attained similar performance ( = 61%, range = 12% - 79%) to the intrasession evaluation. The intersession transfer performance attained with the Amplitude model and with the Phase model shows a large decrease in performance.
These findings indicate similar results to the ones observed at window-level. Hence, using the Phase model we attained the largest percentage of correct trials in intrasession, whereas in intersession the Amplitude + Phase detector was the most reliable. In addition, the performance obtained using the Amplitude + Phase detector in intersession was similar to the one obtained in intrasession.
We present next the results of the repeated measures two-way ANOVA for the trial-based performance of the three detection models in the two evaluation conditions.
In healthy subjects, Mauchly’s test indicated that the assumption of sphericity was not violated neither for the model type factor, nor for the evaluation type factor.
All effects are reported as significant at 0.05. There was a significant main effect of the factor “type of the detection model” on performance, (2, 18) = 20.21, 0.001. There was also a significant main effect of the factor “type of evaluation” on performance, (1, 9) = 93.20, 0.001. Furthermore, we found a significant interaction effect between the type of detection model and the type of evaluation used, (2, 18) = 42, 0.001. This indicates that the type of evaluation had different effects on the attained performance, depending on which type of detection model was used. Comparing intrasession with intersession performance within each model, the post-hoc Bonferroni corrected -tests showed that the Amplitude model and the Phase model performed significantly worse in intersession than in intrasession ( 0.001 for both models), whereas the performance of the Amplitude + Phase model was not significantly different between the two conditions. Similarly, comparing different models in the intersession condition, we found that the Amplitude + Phase model was significantly better than both the Amplitude model ( = 0.001) and the Phase model ( 0.001). Taken together, these results show the advantage of the Amplitude + Phase model in the transfer between sessions.
III-B2 Intersubject evaluation
For the intersubject transfer, we report in Figure 3C similar trial-based performance using the Amplitude + Phase model (62.5%) relative to the intrasession evaluation. However, using the single-view models the attained performance was below both intrasession and intersession evaluations. The robustness of the multi-view model to session- and subject-specific variability is due to a better discrimination between the movement intention and rest classes provided by the output combination of the single-view classifiers. We found no statistically significant difference according to a pairwise Wilcoxon signed rank test between intra- and intersubject evaluations using the Amplitude + Phase model in this group of healthy subjects. We provide all the performance results for all the conditions in healthy subjects in the Supplementary Materials.
III-B3 Detection time evaluation
Next, we performed the analysis of the detection time in intrasession for the three detection models. Based on the neurophysiological results presented in section III-A, we surmised that the phase-based model will detect earlier the intention of walking compared to the amplitude-based model.
Figure 3D presents for the healthy subjects, the output of three detection models as a probability of belonging to the intention of walking class, as well as the subject-specific detection time for the three detection models. All the models show an increase in the probability of gait intention before the onset of motion.
For all the subjects the multi-view model had the earliest detection time ( ms before the movement onset). Moreover, for the Phase model and for the multi-view model we observe longer time intervals between the detection of gait intention and the actual movement onset compared to the Amplitude model. In average we measured a difference of ms between the output of the multi-view model and the single-view Amplitude model, and a difference of ms between the Phase model and the Amplitude model. Furthermore, according to the paired signed rank Wilcoxon test and after Bonferroni-Holm correction for multiple comparisons, we found statistically significant differences between the latencies of the models ( = 0.0078 between the Amplitude + Phase model and the Amplitude model, and = 0.0117 for the other two model comparisons).
III-C Neurophysiological analysis of stroke patients
In Figure 4 we present the MRCP features in stroke patients (dataset 2). First, in Figure 4A we observe these features in grand average over subjects. The MRCP amplitude shows a decrease in voltage, while the PLV presents an increase in magnitude over the motor cortex area with a large spread towards precentral and frontal areas. The power shows a slight increase in the proximity of movement onset.
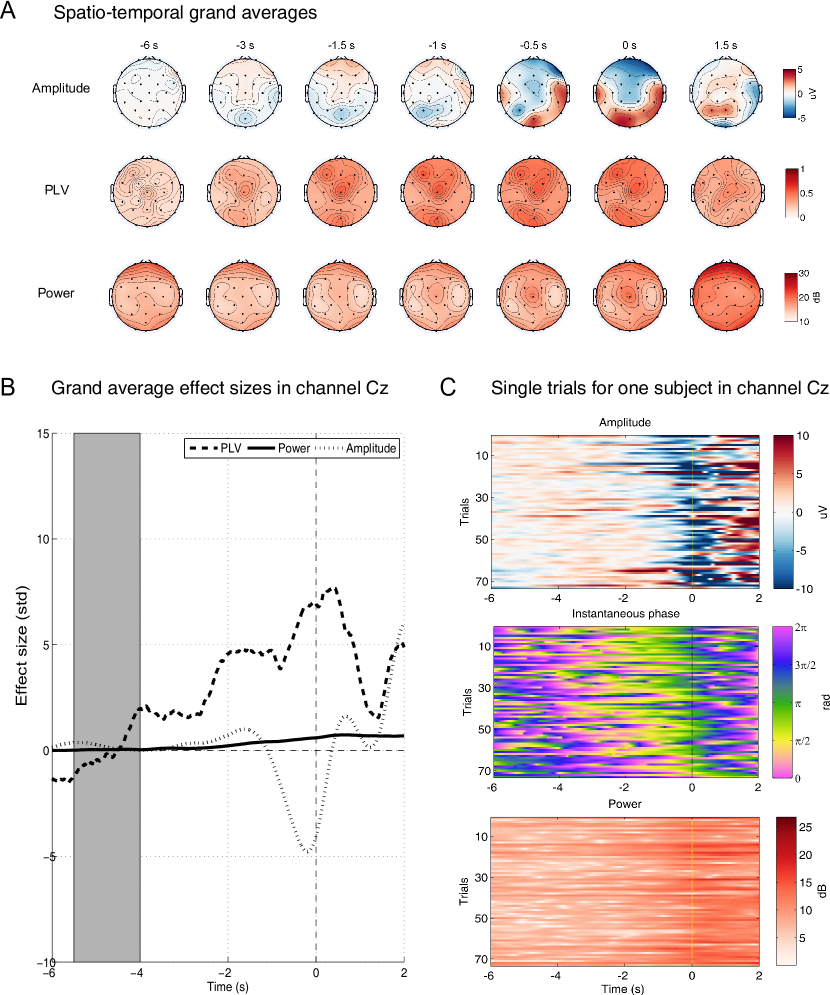
In Figure 4B, we computed the grand average effect sizes of the three features relative to the baseline interval () s. During the intention of motion interval () s, PLV has the largest average effect size (5.23 standard deviations), amplitude has a lower effect size (3.25 standard deviations) and power shows the smallest effect size (0.47 standard deviations). We evaluated the statistical significance between the absolute value of the averaged effect size of three representations (amplitude, instantaneous phase and power) in the intention of motion interval () s using a pairwise Wilcoxon test. After the Bonferroni-Holm correction we found a statistically significant difference between instantaneous phase and power ( = 0.004), as well as between amplitude and power ( = 0.039). However, the difference between instantaneous phase and amplitude was not statistically significant ( = 0.734).
The illustration of the behavior in single trials of the three features is depicted in Figure 4C over the central channel Cz, for one representative patient. The top panel shows the MRCP amplitude features aligned relative to the movement onset. A negative deflection is found starting s relative to the onset. We observe a large inter-trial variation in amplitude and in instantaneous phase. We found a slight increase in power starting s before the movement onset and lasting during the movement.
III-D Evaluation of detection models in stroke patients
III-D1 Intra- and intersession evaluation
As in the case of healthy subjects, we analyze first the performance in the intra- and inter-session conditions using the two metrics of performance.
Window-based performance
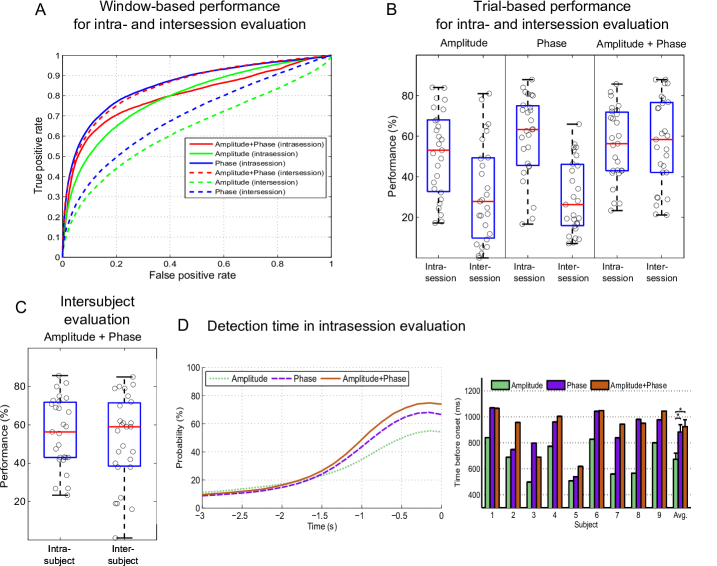
In Figure 5A the performance is presented as averaged ROC curves across patients for the three detection models, in two evaluation conditions, intrasession and intersession. We report the area under the curve (AUC) as a summary statistic of the presented ROC curves. During intrasession the highest averaged AUC was attained for the Phase model ( = 0.85, = 0.12), while the lowest AUC was obtained using the Amplitude model ( = 0.79, = 0.09). For the intersession, the highest AUC was obtained using the multi-view model ( = 0.84, = 0.12), and the lowest AUC was attained using the Amplitude model ( = 0.63, = 0.12). We attained the average empirical chance level of 582%, with Cohen’s = 0.630.12. We conclude that in the group of stroke patients, the Phase model attains the highest performance in intrasession, while in intersession the Amplitude + Phase model is the most reliable for the window-based classification relative to the other detection models.
 |
Trial-based performance
Figure 5B shows the performance of the three detection models at trial level, as percentage of correctly classified trials, in intra- and intersession conditions.
In stroke patients, during intrasession condition, the Phase model attains the highest trial-based performance ( = 63.3%, range = 16.6% - 88%), followed by the Amplitude + Phase model ( = 56.3%, range = 23.3% - 85.8%) and by the Amplitude based model ( = 53.1%, range = 17.2% - 84%).
During the intersession transfer condition, the multi-view model attained similar performance ( = 58.3%, range = 21.1% - 87.9%) compared to the intrasession evaluation. The intersession transfer performance attained with the Amplitude model and with the Phase model shows a large decrease in performance.
We conducted the same statistical analysis using repeated measures two-way ANOVA, as previously described in healthy subjects. For the stroke patients, Mauchly’s test indicated that the assumption of sphericity was not violated for neither of the effects of the type of model (Amplitude, Phase or Amplitude + Phase) nor for the effects of the type of evaluation (intra- or intersession).
There was a significant main effect of the factor “type of the detection model” on performance, (2, 16) = 15.57, 0.001. There was also a significant main effect of the factor “type of evaluation” on performance, (1, 8) = 35.17, 0.001 and a significant interaction effect between the type of detection model and the type of evaluation used, (2, 16) = 9.89, 0.001. This indicates that the type of evaluation had different effects on the attained performance, depending on which type of detection model was used. Bonferroni-Holm corrected -tests revealed significant differences between intrasession and intersession evaluations for the Amplitude model ( = 0.010) and for the Phase model ( = 0.034), but not for the Amplitude + Phase model. For the intersession evaluation, significant differences have been found between the Amplitude + Phase model and the Amplitude model ( = 0.002) and differences close to significance between the Amplitude + Phase model and the Phase model ( = 0.058). These findings suggest that the Amplitude + Phase model is robust to intersession variability and it attains the highest scores compared to the single-view models.
III-D2 Intersubject evaluation
For the intersubject transfer we obtained similar trial-based performance using the multi-view model (59%) relative to the intrasession evaluation, as shown in Figure 5C. The attained accuracy for single-view models was below the accuracy of both intrasession and intersession evaluations. The multi-view model has a lower sensitivity to the specific threshold obtained in cross-validation and, consequently, is less sensitive to changes in the features distributions. We found no statistically significant difference according to a Wilcoxon signed rank test between intra- and intersubject evaluations using the Amplitude + Phase model. We provide all the performance results for all the conditions in stroke patients in the Supplementary Materials.
III-D3 Detection time evaluation
In addition, we performed the detection time analysis of the three detection models in the intrasession evaluation. Figure 5D presents for the stroke patients, the output of the detection models as a probability of belonging to the intention of walking class, as well as the subject-specific detection time for the three detection models. All the models show an increase in the probability of gait intention before the onset of motion. For all the subjects the multi-view model had the earliest detection time ( ms before the movement onset). We found statistically significant differences according to a signed rank Wilcoxon test and after Bonferroni-Holm correction, between the detection time of the Phase model and Amplitude model, as well as between the multi-view model and the Amplitude model detection time ( = 0.0236). In average we found a difference of ms between the output of the multi-view model and the Amplitude model for the stroke patients group, and a difference of ms between the detection time of the Phase and Amplitude models.
IV Discussion
This paper studies the instantaneous phase representation of the MRCP and its usage for the detection of gait intention. We show that the MRCP instantaneous phase has a higher signal-to-noise ratio and that its pattern related to movement intention emerges earlier than the patterns of the MRCP amplitude or power. Next, we propose three detection models: two single-view models, one based on MRCP amplitude features and another based on MRCP instantaneous phase features, and a multi-view model that combines the outputs of the single-view models. During intrasession evaluation the single-view Phase model attained the highest detection score compared to the other detectors. However, in both intersession and intersubject transfer conditions, the multi-view model outperformed the single-view models.
IV-A Neurophysiological results
In recent studies [39, 59, 60] the instantaneous phase of theta and alpha frequency bands has shown a higher signal-to-noise ratio and earlier patterns compared to the ones observed in power. Furthermore, Ng et al. [39] have shown that these phase patterns persist even in the absence of an increase in power.
In our analysis we show that the phase patterns of the slow oscillations in delta frequency band related to the movement intention have the highest signal-to-noise ratio and appear even earlier than s before the movement onset, which is conventionally used as a lower bound for the effect of movement intention to appear in EEG [61] (see Figure 2B and Figure 4B). Next, we show that the increase in the power of the slow (delta) oscillations during the intention of movement interval is relatively small and it appears after the phase pattern (see Figure 2C and in Figure 4C).
As previously stated in [59, 60] theta and alpha oscillations reset early relative to the stimulus presentation (already before or around ms). More precisely, a phase reset has been found at a time point when there is still no activity visible in power. Recent studies [41, 40] have shown that phase synchronization of slow (delta) oscillation depends on the likelihood of the appearance of a significant event, suggesting that phase locking is not only a mechanistic consequence of periodic stimulation. Based on previous findings [41, 40] and on the self-paced nature of our protocol, we consider the significant event to be the subjects’ intention to move whenever they want. We found a non-uniform pattern in the phase of the delta oscillation, related to the intention to move, preceding the movement onset. The phase synchronization value (PLV) anticipates the pattern elicited by the MRCP amplitude with more than half a second, both in healthy subjects (see Figure 2A) and stroke patients (see Figure 2B).
In the last decade, a debate about the generation of event-related potentials (ERPs) has proposed two models. The evoked model [62] states that ERPs are generated by additive evoked responses which are completely independent of ongoing background electroencephalography (EEG). On the other hand, the phase reset model [63, 64, 65] suggests a resetting of ongoing brain oscillations to be the neural generator of ERPs.
The presented neurophysiological results suggest phase resetting as a potential neural generator of MRCPs after the appearance of gait intention. In particular, phase resetting indicates that after each stimulus, the phase of a certain rhythm is shifted towards a dominant value in relation to the stimulus [64]. More specifically, looking at the distribution of instantaneous phase over many trials in Figure 2C for healthy subjects and in Figure 4C for stroke patients, one can observe a distribution of random fluctuation in the instantaneous phase of the slow oscillations during the rest period (before the movement intention), changing after two seconds before the movement onset to a distribution that peaks about a dominant value from to .
It is important to note that the group of healthy subjects is not a control group for the stroke patients, since the two groups have been recorded in different datasets and there are several factors that differentiate them, such as age, medication, slight differences in the experimental protocol, etc. Although a direct comparison between the two groups of subjects is not straightforward due to the aforementioned factors, we observed similar patterns between the features of the two groups of subjects. The MRCP amplitude and PLV have a similar behavior in healthy and stroke subjects, although, a larger spread is observed in stroke patients covering frontal, precentral and central areas (see Figure 2A and Figure 4A). The effect sizes of the three representations have smaller magnitude in stroke patients relative to the ones attained in healthy subjects (see Figure 2B and Figure 4B). Note that the behavior of the MRCP amplitude’s effect size is conserved between the two groups of subjects, whereas the effect size of PLV and power features show dissimilarities between groups. The PLV in stroke patients presents the highest effect size in the proximity of the onset as observed in healthy subjects, but the increase is attenuated and more gradual in stroke patients than in healthy subjects. Power presents a different effect-size pattern between the two groups of subjects. Although increasing before the onset of motion for both groups, in stroke patients the effect-size of power remains constant also during movement.
In the future, a comparison should be performed between a group of stroke patients and their matched healthy control group in order to establish the effect of lesion on the dynamics of the neural correlates of movement intention. In addition, MRCP phase patterns could be analyzed under different protocols that require the execution of different tasks (such as tongue, hand, foot movements, etc.). We consider that several characteristics of the MRCP investigated in amplitude (such as latelarization, preference for specific areas of motor cortex, etc.) could be further explored by the dynamics of the MRCP instantaneous phase.
IV-B Detection models evaluation
MRCPs have been investigated in many studies for the detection of upper limb, lower limb and gait movement intention [11, 12, 13, 14, 15, 9, 16, 17]. All these studies analyzed MRCP amplitude representation, whereas MRCP phase oscillatory activity, in delta band has not yet been evaluated for the detection of gait intention.
However, the phase synchronization of oscillatory signals in mu band has been investigated to assess connectivity between brain areas while performing imaginary movements [42, 43, 44, 45, 47]. They concluded that phase patterns contain complementary information to the power in the mu band and can effectively improve classification. Our findings show that using either of the metrics (window-based or trial-based) the model built on MRCP phase features attained the largest performance in the intrasession condition in both healthy subjects and stroke patients. Using the trial-based metric we observed an improvement of 4.5% in healthy subjects and of 10.1% in stroke patients compared to the model based on more conventional MRCP amplitude features. In a recent study [9] that investigates the amplitude of the MRCP for the detection of gait intention in healthy subjects, authors report a TPR of 76.9% and a FPR of 2.93 1.09 per minute. We can compared these results with our intrasession window-based performance, in which for a similar FPR we attained a TPR of 87.6% using the Phase model, followed by the Amplitude + Phase model (TPR = 81.9%) and by the Amplitude model (TPR = 79.2%). The reported TPRs are derived from the AUC reported in Figure 3A and Figure 5A.
The majority of EEG based BCIs that study MRCP information for the detection or classification of movement use either linear discriminant analysis or template matching methods [11, 12, 13, 9, 16]. We used SVM classification models for the detectors based on both MRCP amplitude and MRCP instantaneous phase. The benefit of the SVM classifier was shown in the classification of instantaneous phase features, which have a nonlinear representation. Therefore, a nonlinear classifier such as RBF-SVM can be more successful in separating data that is not linearly discriminable. However, since amplitude features are linearly separable, the results attained with the MRCP amplitude detector were similar to the ones obtained with sparse linear discriminant analysis, shown in [16].
In BCI based neurorehabilitation, plasticity can be induced if the response latency of the detector relative to the user’s movement intention is in the order of a few hundred milliseconds or smaller [48]. In the current study we show, for the two groups of subjects, that the detection models based on phase features attained an earlier detection compared to the model based on amplitude features. It would be interesting to evaluate the effect of such an earlier detection time, that precedes the movement onset, on plasticity and functional recovery. From a technological perspective, an earlier detection yields a longer time interval from the detection point until the decision-making process to trigger the rehabilitation device, allowing the integration of other processes.
Previous studies that use MRCP amplitude information for the detection of movement intention label the interval from s prior to the movement onset as the intention of motion interval or the pre-movement state [61, 12, 9, 66, 67, 16]. In the current study, we used the same convention. However, we observed that the MRCP instantaneous phase pattern emerges earlier than the MRCP amplitude or power representations. Therefore, we surmise that the earlier appearance of the phase pattern might increase the accuracy of the detector by using different relaxation and pre-movement state labeling criteria in future studies.
A common trend in BCI to reduce (or even eliminate) the time needed for recalibration and increase robustness to artifacts and nonstationarities is the integration of data from multiple sessions and subjects (see [26, 27, 28, 29, 30, 31, 32, 33, 35] for motor imagery, [15, 16, 17, 36, 37] for real movement execution and [34] for workload and mental imagery). The calibration of the BCI is usually associated with significant costs and subjects tiredness [1]. The current study shows, for the detection of gait intention, that the combination of MRCP amplitude and phase information achieves similar performance during intrasession to the performance attained without recalibration during intersession and intersubject transfer conditions (61% in healthy subjects and 57% in stroke patients). In a previous study, we reported similar results between sessions for healthy subjects, but with lower overall performance (58%) [16]. Furthermore, in stroke patients it was still necessary to integrate small amounts of data (10 minutes) for every session to avoid large decay in performance [36]. Despite that the results of the detector based on phase and amplitude features suggest that session- and subject-specific BCI recalibration could be unnecessary for the detection of gait intention, there is still a need to understand where is the limit of the proposed combination of features. First, longer term usage of the BCI may impose larger changes in the feature distributions that can affect performance (e.g. due to neural plastic changes during rehabilitation and to the learning process). Second, results may vary for other types of movement (e.g. motor imagery patterns are known to have smaller amplitude than the ones for real movements). Moreover, in [68] they have shown that upper limb, tongue and lower limb movements have different activity patterns. For these cases, the proposed models could be useful to allow long term operation in a wide range of movements.
Traditional BCIs use a range of features to allow the user to control an external device, such a computer or a prosthesis [69]. These feature types can include amplitude values, frequency based features such as band powers and time-frequency maps of cortical activity of specific brain areas [70]. Our results suggest that phase is a better representation of MRCP amplitude that improves the detection of movement intention and removes the need of session- and subject-specific BCI recalibration widening the integration of this type of detectors in other applications that need an earlier assessment of movement intention for the control of an external device. Due to the robustness in transfer learning we consider gait rehabilitation as a primary application of this technique, however other applications in which the users perform various types of movement (e.g. upper limb, lower limb movements) could also benefit from off-the-shelf BCI technology.
Acknowledgments
Authors thank Filip Melinščak, Nebojša Božanić, Mario Mulansky and Thomas Kreuz for valuable discussions and to Isabel Alquacil Diego and Roberto Cano de la Cuerda for their help during the recordings with stroke patients, as well as for the assessment of patients’ condition. Andreea Ioana Sburlea would like to thank the Institute of Complex Systems, CNR in Sesto Fiorentino for hospitality during her research visit. Authors acknowledge funding by the European Commission through the FP7 Marie Curie Initial Training Network 289146, NETT: Neural Engineering Transformative Technologies and the Spanish Ministry of Science projects HYPER-CSD2009-00067 and DPI2011-25892.
References
- [1] Juan-Manuel Belda-Lois, Silvia Mena-del Horno, Ignacio Bermejo-Bosch, Juan C Moreno, José L Pons, Dario Farina, Marco Iosa, Marco Molinari, Federica Tamburella, Ander Ramos, et al., “Rehabilitation of gait after stroke: a review towards a top-down approach,” Journal of neuroengineering and rehabilitation, vol. 8, no. 1, pp. 66, 2011.
- [2] Hans-Helmut Kornhuber and L Deecke, “Changes in the brain potential in voluntary movements and passive movements in man: Readiness potential and reafferent potentials.,” Pflugers Archiv fur die gesamte Physiologie des Menschen und der Tiere, vol. 284, pp. 1–17, 1965.
- [3] Hiroshi Shibasaki and Mark Hallett, “What is the bereitschaftspotential?,” Clinical Neurophysiology, vol. 117, no. 11, pp. 2341–2356, 2006.
- [4] Lewis A Wheaton, JC Mizelle, Larry W Forrester, Ou Bai, Hiroshi Shibasaki, and Richard F Macko, “How does the brain respond to unimodal and bimodal sensory demand in movement of the lower extremity?,” Experimental brain research, vol. 180, no. 2, pp. 345–354, 2007.
- [5] Alessandro Presacco, Larry Forrester, and Jose L Contreras-Vidal, “Towards a non-invasive brain-machine interface system to restore gait function in humans,” in Engineering in Medicine and Biology Society, EMBC, 2011 Annual International Conference of the IEEE. IEEE, 2011, pp. 4588–4591.
- [6] Joseph T Gwin, Klaus Gramann, Scott Makeig, and Daniel P Ferris, “Removal of movement artifact from high-density eeg recorded during walking and running,” Journal of neurophysiology, vol. 103, no. 6, pp. 3526–3534, 2010.
- [7] Joseph T Gwin, Klaus Gramann, Scott Makeig, and Daniel P Ferris, “Electrocortical activity is coupled to gait cycle phase during treadmill walking,” Neuroimage, vol. 54, no. 2, pp. 1289–1296, 2011.
- [8] Ning Jiang, Natalie Mrachacz-Kersting, Ren Xu, Kim Dremstrup, and Dario Farina, “An accurate, versatile, and robust brain switch for neurorehabilitation,” in Brain-Computer Interface Research, pp. 47–61. Springer, 2014.
- [9] Ning Jiang, Leonardo Gizzi, Natalie Mrachacz-Kersting, Kim Dremstrup, and Dario Farina, “A brain–computer interface for single-trial detection of gait initiation from movement related cortical potentials,” Clinical Neurophysiology, 2014.
- [10] Thomas C Bulea, Saurabh Prasad, Atilla Kilicarslan, and Jose L Contreras-Vidal, “Sitting and standing intention can be decoded from scalp eeg recorded prior to movement execution,” Frontiers in neuroscience, vol. 8, 2014.
- [11] Imran Khan Niazi, Ning Jiang, Olivier Tiberghien, Jørgen Feldbæk Nielsen, Kim Dremstrup, and Dario Farina, “Detection of movement intention from single-trial movement-related cortical potentials,” Journal of neural engineering, vol. 8, no. 6, pp. 066009, 2011.
- [12] Eileen Lew, Ricardo Chavarriaga, Stefano Silvoni, and José del R Millán, “Detection of self-paced reaching movement intention from eeg signals,” Frontiers in neuroengineering, vol. 5, 2012.
- [13] Omar Feix Do Nascimento, Kim Dremstrup Nielsen, and Michael Voigt, “Movement-related parameters modulate cortical activity during imaginary isometric plantar-flexions,” Experimental brain research, vol. 171, no. 1, pp. 78–90, 2006.
- [14] Imran Khan Niazi, Ning Jiang, Mads Jochumsen, Jørgen Feldbæk Nielsen, Kim Dremstrup, and Dario Farina, “Detection of movement-related cortical potentials based on subject-independent training,” Medical & biological engineering & computing, vol. 51, no. 5, pp. 507–512, 2013.
- [15] Gangadhar Garipelli, Ricardo Chavarriaga, and José del R Millán, “Single trial analysis of slow cortical potentials: a study on anticipation related potentials,” Journal of neural engineering, vol. 10, no. 3, pp. 036014, 2013.
- [16] Andreea Ioana Sburlea, Luis Montesano, and Javier Minguez, “Continuous detection of the self-initiated walking pre-movement state from eeg correlates without session-to-session recalibration,” Journal of Neural Engineering, vol. 12, no. 3, 2015.
- [17] Andreea Ioana Sburlea, Luis Montesano, Roberto Cano de Cuerda, Isabel Alguacil Diego, Juan Carlos Miangolarra-Page, and Javier Minguez, “Detecting intention to walk in stroke patients from pre-movement eeg correlates,” Journal of Neuroengineering and Rehabilitation, in press, 2015.
- [18] G Pfurtscheller and A Aranibar, “Evaluation of event-related desynchronization (erd) preceding and following voluntary self-paced movement,” Electroencephalography and clinical neurophysiology, vol. 46, no. 2, pp. 138–146, 1979.
- [19] G Pfurtscheller, C Brunner, A Schlögl, and FH Lopes da Silva, “Mu rhythm (de) synchronization and eeg single-trial classification of different motor imagery tasks,” NeuroImage, vol. 31, no. 1, pp. 153–159, 2006.
- [20] Emanuela Formaggio, Silvia Francesca Storti, Ilaria Boscolo Galazzo, Marialuisa Gandolfi, Christian Geroin, Nicola Smania, Laura Spezia, Andreas Waldner, Antonio Fiaschi, Paolo Manganotti, et al., “Modulation of event-related desynchronization in robot-assisted hand performance: brain oscillatory changes in active, passive and imagined movements,” J Neuroeng Rehabil, vol. 10, pp. 24, 2013.
- [21] Chang S Nam, Yongwoong Jeon, Young-Joo Kim, Insuk Lee, and Kyungkyu Park, “Movement imagery-related lateralization of event-related (de) synchronization (erd/ers): Motor-imagery duration effects,” Clinical Neurophysiology, vol. 122, no. 3, pp. 567–577, 2011.
- [22] M Severens, B Nienhuis, P Desain, and Jaak Duysens, “Feasibility of measuring event related desynchronization with electroencephalography during walking,” in Engineering in Medicine and Biology Society (EMBC), 2012 Annual International Conference of the IEEE. IEEE, 2012, pp. 2764–2767.
- [23] Johanna Wagner, Teodoro Solis-Escalante, Reinhold Scherer, Christa Neuper, and Gernot Müller-Putz, “It’s how you get there: walking down a virtual alley activates premotor and parietal areas,” Frontiers in human neuroscience, vol. 8, 2014.
- [24] Jaime Ibánez, J Ignacio Serrano, M Dolores del Castillo, Esther Monge, Francisco Molina, Francisco Rivas, Isabela Alguacil, J Miangolarra-Page, and José Luis Pons, “Detection of the onset of voluntary movements based on the combination of erd and bp cortical patterns,” in Replace, Repair, Restore, Relieve–Bridging Clinical and Engineering Solutions in Neurorehabilitation, pp. 437–446. Springer, 2014.
- [25] Andrej Savić, Romulus Lontis, Ning Jiang, Mirjana Popović, Dario Farina, Kim Dremstrup, and Natalie Mrachacz-Kersting, “Movement related cortical potentials and sensory motor rhythms during self initiated and cued movements,” in Replace, Repair, Restore, Relieve–Bridging Clinical and Engineering Solutions in Neurorehabilitation, pp. 701–707. Springer, 2014.
- [26] Wenting Tu and Shiliang Sun, “A subject transfer framework for eeg classification,” Neurocomputing, vol. 82, pp. 109–116, 2012.
- [27] Fabien Lotte and Cuntai Guan, “Learning from other subjects helps reducing brain-computer interface calibration time,” in Acoustics Speech and Signal Processing (ICASSP), 2010 IEEE International Conference on. IEEE, 2010, pp. 614–617.
- [28] Matthias Krauledat, Michael Tangermann, Benjamin Blankertz, and Klaus-Robert Müller, “Towards zero training for brain-computer interfacing,” PLoS One, vol. 3, no. 8, pp. e2967, 2008.
- [29] Mahnaz Arvaneh, Cuntai Guan, Kai Keng Ang, and Chai Quek, “Omitting the intra-session calibration in eeg-based brain computer interface used for stroke rehabilitation,” in Engineering in Medicine and Biology Society (EMBC), 2012 Annual International Conference of the IEEE. IEEE, 2012, pp. 4124–4127.
- [30] Mahnaz Arvaneh, Cuntai Guan, Kai Keng Ang, and Chai Quek, “Eeg data space adaptation to reduce intersession nonstationarity in brain-computer interface,” Neural computation, vol. 25, no. 8, pp. 2146–2171, 2013.
- [31] Siamac Fazli, Florin Popescu, Márton Danóczy, Benjamin Blankertz, Klaus-Robert Müller, and Cristian Grozea, “Subject-independent mental state classification in single trials,” Neural networks, vol. 22, no. 9, pp. 1305–1312, 2009.
- [32] Siamac Fazli, Cristian Grozea, Márton Danóczy, Benjamin Blankertz, Florin Popescu, and Klaus-Robert Müller, “Subject independent eeg-based bci decoding,” in Advances in Neural Information Processing Systems, 2009, pp. 513–521.
- [33] Siamac Fazli, Márton Danóczy, Jürg Schelldorfer, and Klaus-Robert Müller, “1-penalized linear mixed-effects models for high dimensional data with application to bci,” NeuroImage, vol. 56, no. 4, pp. 2100–2108, 2011.
- [34] Fabien Lotte, “Signal processing approaches to minimize or suppress calibration time in oscillatory activity-based brain–computer interfaces,” 2015.
- [35] Siamac Fazli, Sven Dahne, Wojciech Samek, Felix Biebmann, and Klaus-Robert Muller, “Learning from more than one data source: Data fusion techniques for sensorimotor rhythm-based brain–computer interfaces,” 2015.
- [36] Andreea Ioana Sburlea, Luis Montesano, and Javier Minguez, “Intersession adaptation of the eeg-based detector of self-paced walking intention in stroke patients,” in Engineering in Medicine and Biology Society (EMBC), 2015 37th Annual International Conference of the IEEE. 2015, pp. 498–501, IEEE.
- [37] F. Trincado-Alonso E. L pez-Larraz and L. Montesano, “Brain-machine interfaces for motor rehabilitation: Is recalibration important?,” Accepted for 14th International Conference on Rehabilitation Robotics (ICORR), 2015.
- [38] Niko A Busch, Julien Dubois, and Rufin VanRullen, “The phase of ongoing eeg oscillations predicts visual perception,” The Journal of neuroscience, vol. 29, no. 24, pp. 7869–7876, 2009.
- [39] Benedict Shien Wei Ng, Nikos K Logothetis, and Christoph Kayser, “Eeg phase patterns reflect the selectivity of neural firing,” Cerebral Cortex, vol. 23, no. 2, pp. 389–398, 2013.
- [40] Maryam Saleh, Jacob Reimer, Richard Penn, Catherine L Ojakangas, and Nicholas G Hatsopoulos, “Fast and slow oscillations in human primary motor cortex predict oncoming behaviorally relevant cues,” Neuron, vol. 65, no. 4, pp. 461–471, 2010.
- [41] Gábor Stefanics, Balázs Hangya, István Hernádi, István Winkler, Péter Lakatos, and István Ulbert, “Phase entrainment of human delta oscillations can mediate the effects of expectation on reaction speed,” The Journal of neuroscience, vol. 30, no. 41, pp. 13578–13585, 2010.
- [42] Ian Daly, Slawomir J Nasuto, and Kevin Warwick, “Brain computer interface control via functional connectivity dynamics,” Pattern recognition, vol. 45, no. 6, pp. 2123–2136, 2012.
- [43] Qingguo Wei, Yijun Wang, Xiaorong Gao, and Shangkai Gao, “Amplitude and phase coupling measures for feature extraction in an eeg-based brain–computer interface,” Journal of Neural Engineering, vol. 4, no. 2, pp. 120, 2007.
- [44] Wei He, Pengfei Wei, Yi Zhou, and Liping Wang, “Combination of amplitude and phase features under a uniform framework with emd in eeg-based brain-computer interface,” in Engineering in Medicine and Biology Society (EMBC), 2012 Annual International Conference of the IEEE. IEEE, 2012, pp. 1687–1690.
- [45] Benjamin Hamner, Robert Leeb, Michele Tavella, and JR del Millan, “Phase-based features for motor imagery brain-computer interfaces,” in Engineering in Medicine and Biology Society, EMBC, 2011 Annual International Conference of the IEEE. IEEE, 2011, pp. 2578–2581.
- [46] J Wagner, T Solis-Escalante, C Neuper, R Scherer, and G Müller-Putz, “Robot assisted walking affects the synchrony between premotor and somatosensory areas,” Biomedical Engineering/Biomedizinische Technik, 2013.
- [47] Wei-Yen Hsu, “Enhancing the performance of motor imagery eeg classification using phase features,” Clinical EEG and neuroscience, p. 1550059414555123, 2014.
- [48] Ren Xu, Ning Jiang, Chuang Lin, Natalie Mrachacz-Kersting, Kim Dremstrup, and Dario Farina, “Enhanced low-latency detection of motor intention from eeg for closed-loop brain-computer interface applications,” Biomedical Engineering, IEEE Transactions on, vol. 61, no. 2, pp. 288–296, 2014.
- [49] Valer Jurcak, Daisuke Tsuzuki, and Ippeita Dan, “10/20, 10/10, and 10/5 systems revisited: their validity as relative head-surface-based positioning systems,” Neuroimage, vol. 34, no. 4, pp. 1600–1611, 2007.
- [50] Ella Bingham and Aapo Hyvärinen, “A fast fixed-point algorithm for independent component analysis of complex valued signals,” International journal of neural systems, vol. 10, no. 01, pp. 1–8, 2000.
- [51] Arnaud Delorme and Scott Makeig, “Eeglab: an open source toolbox for analysis of single-trial eeg dynamics including independent component analysis,” Journal of neuroscience methods, vol. 134, no. 1, pp. 9–21, 2004.
- [52] Gangadhar Garipelli, Ricardo Chavarriaga, and J del R Millan, “Single trial recognition of anticipatory slow cortical potentials: the role of spatio-spectral filtering,” in Neural Engineering (NER), 2011 5th International IEEE/EMBS Conference on. IEEE, 2011, pp. 408–411.
- [53] Jean-Philippe Lachaux, Eugenio Rodriguez, Jacques Martinerie, Francisco J Varela, et al., “Measuring phase synchrony in brain signals,” Human brain mapping, vol. 8, no. 4, pp. 194–208, 1999.
- [54] Mike X Cohen, Analyzing neural time series data: theory and practice, MIT Press, 2014.
- [55] Sture Holm, “A simple sequentially rejective multiple test procedure,” Scandinavian journal of statistics, vol. 6, pp. 65–70, 1979.
- [56] Steven Lemm, Benjamin Blankertz, Thorsten Dickhaus, and Klaus-Robert Müller, “Introduction to machine learning for brain imaging,” Neuroimage, vol. 56, no. 2, pp. 387–399, 2011.
- [57] Martin Billinger, Ian Daly, Vera Kaiser, Jing Jin, Brendan Z Allison, Gernot R Müller-Putz, and Clemens Brunner, “Is it significant? guidelines for reporting bci performance,” in Towards Practical Brain-Computer Interfaces, pp. 333–354. Springer, 2013.
- [58] Ross Ihaka and Robert Gentleman, “R: a language for data analysis and graphics,” Journal of computational and graphical statistics, vol. 5, no. 3, pp. 299–314, 1996.
- [59] Wolfgang Klimesch, Bärbel Schack, Manuel Schabus, Michael Doppelmayr, Walter Gruber, and Paul Sauseng, “Phase-locked alpha and theta oscillations generate the p1–n1 complex and are related to memory performance,” Cognitive Brain Research, vol. 19, no. 3, pp. 302–316, 2004.
- [60] Walter R Gruber, Wolfgang Klimesch, Paul Sauseng, and Michael Doppelmayr, “Alpha phase synchronization predicts p1 and n1 latency and amplitude size,” Cerebral Cortex, vol. 15, no. 4, pp. 371–377, 2005.
- [61] Lüder Deecke, Berta Grözinger, and HH Kornhuber, “Voluntary finger movement in man: cerebral potentials and theory,” Biological cybernetics, vol. 23, no. 2, pp. 99–119, 1976.
- [62] Amos Arieli, Alexander Sterkin, Amiram Grinvald, and Ad Aertsen, “Dynamics of ongoing activity: explanation of the large variability in evoked cortical responses,” Science, vol. 273, no. 5283, pp. 1868–1871, 1996.
- [63] S Makeig, M Westerfield, T-P Jung, S Enghoff, J Townsend, E Courchesne, and TJ Sejnowski, “Dynamic brain sources of visual evoked responses,” Science, vol. 295, no. 5555, pp. 690–694, 2002.
- [64] Peter A Tass, Phase resetting in medicine and biology: stochastic modelling and data analysis, vol. 172, Springer Science & Business Media, 2007.
- [65] P Sauseng, W Klimesch, WR Gruber, S Hanslmayr, R Freunberger, and M Doppelmayr, “Are event-related potential components generated by phase resetting of brain oscillations? a critical discussion,” Neuroscience, vol. 146, no. 4, pp. 1435–1444, 2007.
- [66] Ou Bai, Varun Rathi, Peter Lin, Dandan Huang, Harsha Battapady, Ding-Yu Fei, Logan Schneider, Elise Houdayer, Xuedong Chen, and Mark Hallett, “Prediction of human voluntary movement before it occurs,” Clinical Neurophysiology, vol. 122, no. 2, pp. 364–372, 2011.
- [67] Natalie Mrachacz-Kersting, N Jiang, K Dremstrup, and D Farina, “A novel brain-computer interface for chronic stroke patients,” in Brain-Computer Interface Research, pp. 51–61. Springer, 2014.
- [68] Valerie Morash, Ou Bai, Stephen Furlani, Peter Lin, and Mark Hallett, “Classifying eeg signals preceding right hand, left hand, tongue, and right foot movements and motor imageries,” Clinical neurophysiology, vol. 119, no. 11, pp. 2570–2578, 2008.
- [69] Jonathan R Wolpaw, Niels Birbaumer, Dennis J McFarland, Gert Pfurtscheller, and Theresa M Vaughan, “Brain–computer interfaces for communication and control,” Clinical neurophysiology, vol. 113, no. 6, pp. 767–791, 2002.
- [70] Fabien Lotte, Marco Congedo, Anatole Lécuyer, and Fabrice Lamarche, “A review of classification algorithms for eeg-based brain–computer interfaces,” Journal of neural engineering, vol. 4, 2007.