Fermi LAT Gamma-ray Detections of Classical Novae V1369 Centauri 2013 and V5668 Sagittarii 2015
Abstract
We report the Fermi Large Area Telescope (LAT) detections of high-energy (100 MeV) -ray emission from two recent optically bright classical novae, V1369 Centauri 2013 and V5668 Sagittarii 2015. At early times, Fermi target-of-opportunity observations prompted by their optical discoveries provided enhanced LAT exposure that enabled the detections of -ray onsets beginning 2 days after their first optical peaks. Significant -ray emission was found extending to 3955 days after their initial LAT detections, with systematically fainter and longer duration emission compared to previous -ray detected classical novae. These novae were distinguished by multiple bright optical peaks that encompassed the timespans of the observed rays. The -ray light curves and spectra of the two novae are presented along with representative hadronic and leptonic models, and comparisons to other novae detected by the LAT are discussed.
Subject headings:
gamma rays: stars — radiation mechanisms: general — (stars:) novae, cataclysmic variables| Name | V1369 Cen 2013 | V5668 Sgr 2015 |
|---|---|---|
| Distancea (kpc) | 2.5 | 2.0 |
| Discovery dateb | 2013 Dec 2.41 | 2015 Mar 15.634 |
| (MJD 56628.41) | (MJD 57096.634) | |
| First optical peak magc | 3.6 | 4.1 |
| First optical peak datec | 2013 Dec 5.7 | 2015 Mar 21.5 |
| (MJD 56631.7) | (MJD 57102.5) | |
| Second optical peak magc | 3.4 | 4.4 |
| Second optical peak datec | 2013 Dec 14.3 | 2015 Apr 3.76.4 |
| (MJD 56640.3) | (MJD 57115.757118.4) | |
| Optical discovery named | PNV J135447005909080 | PNV J183657002855420 |
| Optical RA, Decl.d | 2086958, 591522 | 2792375, 289283 |
| Optical | 3109847, +27256 | 53799, 98668 |
| LAT RA, Decl.d | 20882, 5917 | 27917, 2903 |
| LAT error radius | 010 | 014 |
| Optical-LAT offset | 007 | 012 |
a We adopted distances of 2.5 kpc for V1369 Cen (Shore et al., 2014) and 2.0 kpc for V5668 Sgr (Banerjee et al., 2015).
b The pre-discovery date is quoted for V1369 Cen (see footnote 1 in the main text).
c Based on the AAVSO data (see § 1 and Figure 1). The first optical peak for V1369 Cen was taken as an average of measurements taken on December 5.694 (3.4 mag) and 5.708 (3.7 mag); its second peak was based on an average of four measurements from December 14.273 (3.3 mag), 14.292 (3.5 mag), 14.302 (3.5 mag) and 14.310 (3.27 mag). For V5668 Sgr, we quote an observed first peak 4.1 mag on March 21.501 because taking adjacent measurements around its actual observed peak 4.0 mag on March 21.825 into account, March 21.789 (4.4 mag), 21.796 (4.2 mag), and 21.826 (4.3 mag), indicated a fainter, 4.2 mag average around March 21.8; its second peak is more broad, extending over 3 days.
d All positions are in the J2000.0 equinox.
1. Introduction
Novae are thermonuclear runaway explosions triggered on the surfaces of white dwarf stars due to mass accretion from the companion in a binary system (Kraft, 1964). In their nascent optically thick stage, a transient source of nuclear decay -ray emission with signature lines at MeV energies will be produced by disintegration of unstable isotopes and positron annihilation (Clayton & Hoyle, 1974; Starrfield et al., 1978; Clayton, 1981), but no individual novae have yet been detected in this way (Hernanz, 2008). Rather, novae have long been recognized visually by their telltale bright optical transient nature (Lundmark, 1921; McLaughlin, 1939; Payne-Gaposchkin, 1957), and contemporary radio, infrared, optical/ultraviolet, and X-ray imaging and spectroscopy studies have revealed different facets of the physics of the ensuing expanding ejecta (Bode & Evans, 2008; Woudt & Ribeiro, 2014).
The study of novae has undergone a recent resurgence because of the Fermi Large Area Telescope (LAT; Atwood et al., 2009) detections of 100 MeV -ray emission from three classical novae (Ackermann et al., 2014) following the initial LAT detection of the symbiotic-like recurrent nova V407 Cyg 2010 (Abdo et al., 2010; Cheung et al., 2010). In hindsight, the idea that symbiotic novae can be continuum emitters in 100 MeV rays could have been expected from shock-accelerated particles in the ejecta through interactions with the dense wind of the red giant companion as considered for RS Oph (Tatischeff & Hernanz, 2007; Hernanz, 2014). However, the subsequent LAT detections of classical novae were truly unexpected, because they instead involve less-evolved (main sequence or subgiant) companions demonstrating high-energy particle acceleration occurring in the absence of dense wind material. Moreover, the LAT-detected classical novae displayed different optical/ultraviolet properties (e.g., Gehrz et al., 1998) that indicated explosions from white dwarfs with an oxygen-neon (ONe) composition in V959 Mon 2012, while V1324 Sco 2012 and V339 Del 2013 appeared to be carbon-oxygen (CO) types. The key implication of these handful of reported LAT detections in the local volume within 45 kpc is that most novae, if not all, are potential sources of high-energy continuum -ray emission.
Here, we report two additional classical novae detected with the Fermi-LAT following their optical discoveries, the fifth and sixth novae now securely detected in 100 MeV rays. Both novae were discovered by J. Seach, in Australia: V1369 Centauri (V1369 Cen = Nova Cen 2013) on 2013 December 2.692111Note the report (http://www.aavso.org/possible-nova-centaurus) that, “Steven Graham in Templeton, NZ, has a webcam set up … hearing of this nova, he searched his archives and found it was visible on his image at 0945UT (Dec 2), but not on the previous dark one at 1330UT (Dec 1).” This pre-discovery photo helps constrain the V1369 Cen explosion epoch as 0.28 days earlier than the Seach discovery (Table 1). and V5668 Sagittarii (V5668 Sgr = Nova Sgr 2015 No. 2) on 2015 March 15.634 (all times are UT). Spectroscopic observations obtained on 2013 December 3 revealed Hα and Hβ emission lines and confirmed V1369 Cen as a nova (see Seach et al., 2013) with a likely progenitor that brightened by 10 mag (Kornoch, 2013) at discovery. For V5668 Sgr, Seach followed-up his 2015 March 15 discovery (6.0 mag; it was not detected with a 10.5 mag limit in his previous night’s observation) with a bright Hα detection hours later (Seach et al., 2015), and the spectroscopic confirmation came the following day (Williams et al., 2015).
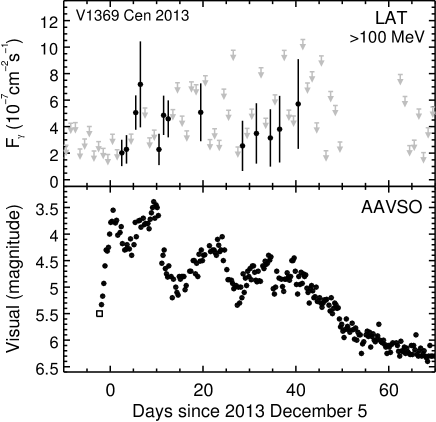
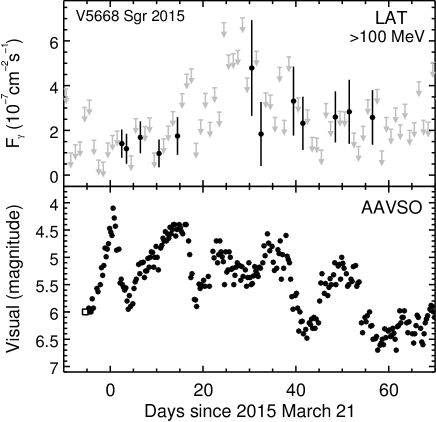
V1369 Cen and V5668 Sgr were extensively monitored optically by the AAVSO and ARAS groups222American Association of Variable Star Observers (http://www.aavso.org/lcg) and Astronomical Ring for Access to Spectroscopy (http://www.astrosurf.com/aras/), respectively. and showed broadly similar multi-peaked light curves. Their respective first peaks were 3.6 mag and 4.1 mag, making them the visually brightest novae observed since V382 Vel 1999 (2.5 mag peak) and since the 2008 launch of Fermi (V339 Del 2013 peaked at 4.5 mag; see Munari et al., 2015). V5668 Sgr was characterized by systematically longer timescales in its brightening and fading (see Figure 1 for an overview, and Table 1). Both rose to their first peaks by 1.9 mag after discovery, but with different rates of 0.6 mag day-1 for V1369 Cen and 0.3 mag day-1 for V5668 Sgr. Following a 2-day decline, a slightly brighter second peak in V1369 Cen was observed 9 days after its first peak with three subsequent fainter peaks spaced by 514 days. V5668 Sgr declined over a longer 3.5-day interval and rebrightened to a modestly fainter, broader second peak 1518 days after its first peak, and underwent three additional brightening events to 4.55 mag at intervals of 813 days (see Waagen, 2015).
In the following, we present the LAT observations of the two novae (§ 2), describing the -ray light curves coinciding with multi-peaked optical activity (§ 2.1; preliminary results were presented in Cheung et al., 2015c), and hadronic and leptonic modeling of their high-energy -ray spectra (§ 2.2). The results are discussed in § 3, and we conclude in § 4.
2. LAT Observations and Analysis
The Fermi-LAT routinely operates in a sky-survey mode, providing coverage of the entire sky every 3.2 hrs (two spacecraft orbits). We obtained Fermi target-of-opportunity (ToO) observations a few days after each optical nova discovery that resulted in exposures approximately twice what the nominal sky survey would have achieved in both cases. The ToOs were timed for after the optical emission peaked, as previous observations of V339 Del 2013 indicated the 100 MeV -ray onset occurred 1.5 days later. This strategy led to the successful early detections of the two new novae, while continued Fermi sky-survey observations at later times revealed detectable -ray emission out to 1.52 months.
At the time of the V1369 Cen optical discovery, Fermi was operating with a modified sky survey pattern favoring the Galactic center direction333http://fermi.gsfc.nasa.gov/ssc/observations/types/exposure/ with minimal sky exposure toward Centaurus. This Fermi ToO observation began on 2013 December 6.0, just 0.3 day after V1369 Cen’s first optical peak. The initial 5-day ToO sequence resulted in a low-significance cumulative 3-day LAT detection beginning about 1.5 days after its optical peak (Cheung et al., 2013a). On the last day of this ToO sequence, the source brightened in rays as the optical was rising to its second peak (Cheung et al., 2013b). This prompted a return to the ToO pointing for five additional days, providing enhanced coverage of the second, brighter, optical peak as well, after three days of modified sky survey.
For V5668 Sgr, the Fermi TOO started around March 17.9, while the optical brightness continued to rise after discovery, and extended for 18 days in total, ending on April 5; the ToO observation was longer because of the slower rise to optical peak. As the optical brightness climbed, there were no significant LAT detections until the expected onset in -rays 1.5 days after optical peak (Cheung et al., 2015a, b), similar to that in V1369 Cen and in the previous V339 Del case.
For the subsequent LAT analysis, we selected 0.1100 GeV data with P7REPSOURCEV15 instrument response functions within a region-of-interest (ROI) centered on each optical nova position with a 15∘ radius. To model the background, we included all 3FGL catalog sources (Acero et al., 2015) within each ROI as well as the diffuse -ray emission represented by the Galactic and isotropic templates444Respective files, glliemv05rev1.fit and isosourcev05.txt, available from http://fermi.gsfc.nasa.gov/ssc/data/access/lat/BackgroundModels.html. Data analysis was performed using Fermi Science tools version 09-34-01. For the mix of data obtained as part of sky-survey and ToO pointings, data were selected following option 3 under the FSSC recommendations555http://fermi.gsfc.nasa.gov/ssc/data/analysis/documentation/Cicerone/Cicerone_Likelihood/Exposure.html. We used binned likelihood analysis with the gtlike tool for the light curves and for the average spectral results. Systematic uncertainties can be estimated as 8 for the fluxes and 0.1 for the spectral slopes (Ackermann et al., 2012).
2.1. Light Curves
For both novae, we analyzed 212 days of data (four orbital precession periods of the Fermi satellite) centered around starting times defined as the day of their first optical peaks, = 2013 December 5.0 for V1369 Cen and = 2015 March 21.0 for V5668 Sgr (see Table 1). Note our definition of here is different from Ackermann et al. (2014) where the starting times were rather defined as the first significant 1-day bin LAT detection. The present choice is to facilitate comparison with V339 Del 2013. For V1369 Cen, the data interval spanned 106 days to 106 days, but for V5668 Sgr, the data analyzed were up to 2015 Jun 1.0 (MJD 57174.0), i.e., from 140 days to 72 days666Subsequently, we further extended the light curve by 24 days, i.e., up to June 25 (96 days) and the two most significant days were isolated points with test statistic, TS = 3.7 (June 5) and 3.8 (June 9) during an interval of low exposure. For one degree of freedom in the fits (the normalization in this case), the source significances are (Mattox et al., 1996), thus these additional points do not add useful information.. The long intervals analyzed with integer multiples of the Fermi precession period were chosen to gauge the effects of variable LAT exposure on the signal determinations as well as the level of potential background contamination at the nova positions by inspecting the data before the optical explosions.
The full 212-day datasets were used to determine the normalizations of known variable -ray sources in each nova field, as well as the Galactic and isotropic normalizations. For the field source analysis, we considered objects within 5∘ of each nova flagged as variable in the 3FGL catalog, as well as any potentially contaminating blazar-type sources within the 15∘ ROI. Only two sources satisfied the former criteria, with offsets of 46 (3FGL J1328.95607) and 33 (3FGL J1400.75605) from V1369 Cen, and were found to be quite faint during this interval777See up-to-date LAT aperture light curves for all the 3FGL sources: http://fermi.gsfc.nasa.gov/ssc/data/access/lat/4yr_catalog/ap_lcs.php. Three highly-variable, bright blazars are found in the vicinity of V5668 Sgr, but with large offsets of 79 (3FGL J1833.62103), 118 (3FGL J1917.21921), and 133 (3FGL J1911.22006).
Assuming a point source at the position of each nova with LAT spectra parameterized as a single power law (PL), we generated 1-day bin 100 MeV light curves with the photon index, , fixed to the the typical value measured in the previous LAT-detected classical novae (Ackermann et al., 2014). We also allowed the PL slope to be left free to fit, but the resultant indices varied widely and appeared unreliable because of the limited statistics in these short time-bins; thus the results are presented. All the background parameters were fixed except for the normalizations of the Galactic diffuse component and the closest background blazar, 3FGL J1833.62103 = PKS 1830211. Despite the enhanced LAT-ToO exposures at the early stages, the cumulative significances of V1369 Cen and V5668 Sgr (Table 2) are lower than the previous cases. This made it difficult to derive good constraints on the curvature of the spectra and temporal variations. Note the wide range of upper limits in the light curves due to the combination of sky survey and ToO exposure (see Appendix A). Also, there is a 12-day gap in the V1369 Cen observations starting at 50 days due to a LAT ToO observation of SN2014J in M82.
In the -ray and optical comparison (Figure 1), we display the interval 10 days to +70 days, with the AAVSO data averaged in 0.25 day bins. In the 1-day bin LAT light curves (see Appendix A for corresponding TS and exposure values), the first significant -ray detections (defined as TS ) of both novae spanned the two days from 2.0 to 4.0 days with TS 67 in each day for V1369 Cen and TS = 11.5 and 5.3 for V5668 Sgr, confirming the preliminary findings (Cheung et al., 2013a, b, 2015a, 2015b). The respective 100 MeV fluxes were (2.02.3) and (1.31.6) photons cm-2 s-1, both fainter than previously detected novae at similar times. By splitting the data for the first significant 1-day detections into two halves, we found the more significant detection in the latter half-day in V1369 Cen (TS versus 6.0) and in the first half-day in V5668 Sgr (TS versus 3.5). Taking these 0.5 day-bin results, we can constrain the -ray onsets to 1.8 and 2.0 days after their respective first optical peaks. The LAT ToOs for each nova provided enhanced exposure through the observed -ray onsets, suggesting the -ray onset determinations were not exposure artifacts.
The total LAT-detected durations of these two novae are systematically longer than for the previously detected novae, albeit with the detections appearing sporadic because of a combination of the changing LAT exposure and low photon statistics. This limits our statements regarding changes in the -ray light curves predominantly to intervals with good exposure and precludes a meaningful comparison with the optical data when the LAT exposures were low. Considering primarily the 1-day bins with enhanced ToO exposures at early times (i.e., to 15 days), we found only 3/10 days in V1369 Cen with highly significant detections (TS = 19.337.6) and 3/15 days in V5668 Sgr with significant detections (TS = 8.511.6), with no obvious correlation of TS with exposure. In the three 1-day bins with largest TS in V1369 Cen, the fluxes are a factor of two greater than those in other comparably exposed time bins. These higher -ray fluxes were observed both preceding and following its second optical peak at 9.3 days (the more limited statistics in V5668 Sgr prevent a similar determination). At later times (after 15 days), both novae declined in and out of detectability because of lower exposures when the LAT returned to survey mode. In V1369 Cen, there is only a single TS point on 19.5 days, which amounts to a total detected duration of at least 18 days for this nova (note the total detected durations include the first significant detections for each nova at 2.0 days), and a total detected duration of 39 days is implied if the lower-significance (TS ) detections found in five of the 21 subsequent bins up to 40.5 days are considered. V5668 Sgr was sporadically detected at late times in seven more bins evenly spread over a long interval up to +57.0 days, again, without an apparent correlation with exposure. Its apparent lull in signal (essentially TS = 0) from 15.0 to 24 days is difficult to gauge because of minimal exposure at these times. If we take the last day with observed TS in V5668 Sgr, then the total detected duration is 47 days, and this duration is enlarged slightly to 55 days if we consider the single TS = 8.6 point at 56.5 days.
| Nova | V1369 Cen 2013 | V5668 Sgr 2015 |
|---|---|---|
| Single Power Law | ||
| Flux, | ||
| Photon index | ||
| TS | 99.9 | 70.4 |
| Exponentially Cutoff Power Law | ||
| Flux, | ||
| Slope, | ||
| TS | 110.6 | 71.1 |
| Hadronic Model | ||
| Flux | ||
| Slope, | ||
| 10 | 10 | |
| TS | 115.3 | 70.7 |
| Leptonic Model | ||
| Flux, | ||
| Slope, | ||
| 3.2 | ||
| TS | 111.2 | 71.1 |
Notes. Best-fit parameters from the average spectral fits and the hadronic and leptonic modeling of the LAT data for V1369 Cen and V5668 Sgr. The reported errors on spectral parameters are statistical uncertainties only with 100 MeV fluxes, , in units of photons cm-2 s-1 and the cutoff energies, , in GeV.


2.2. Spectral Analysis, Source Localization, and Modeling
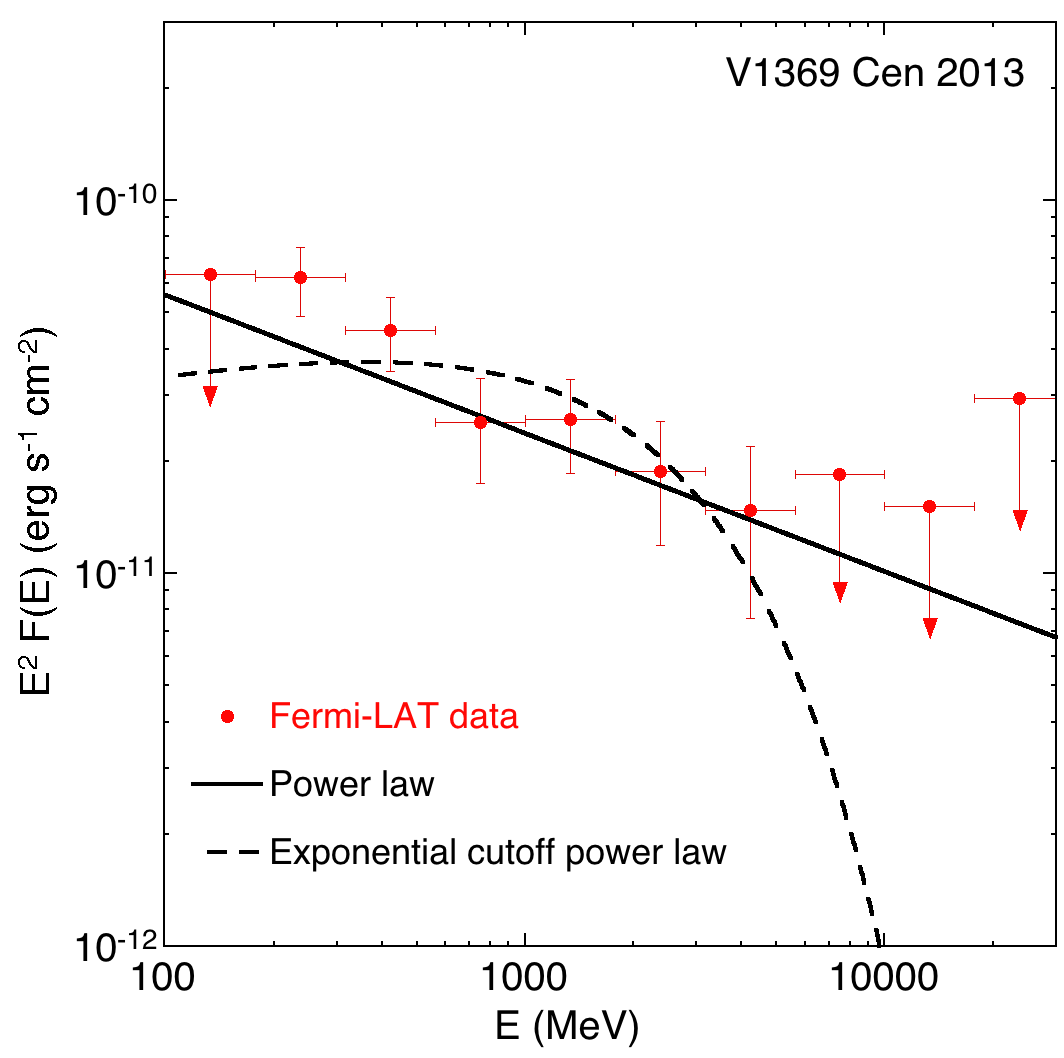
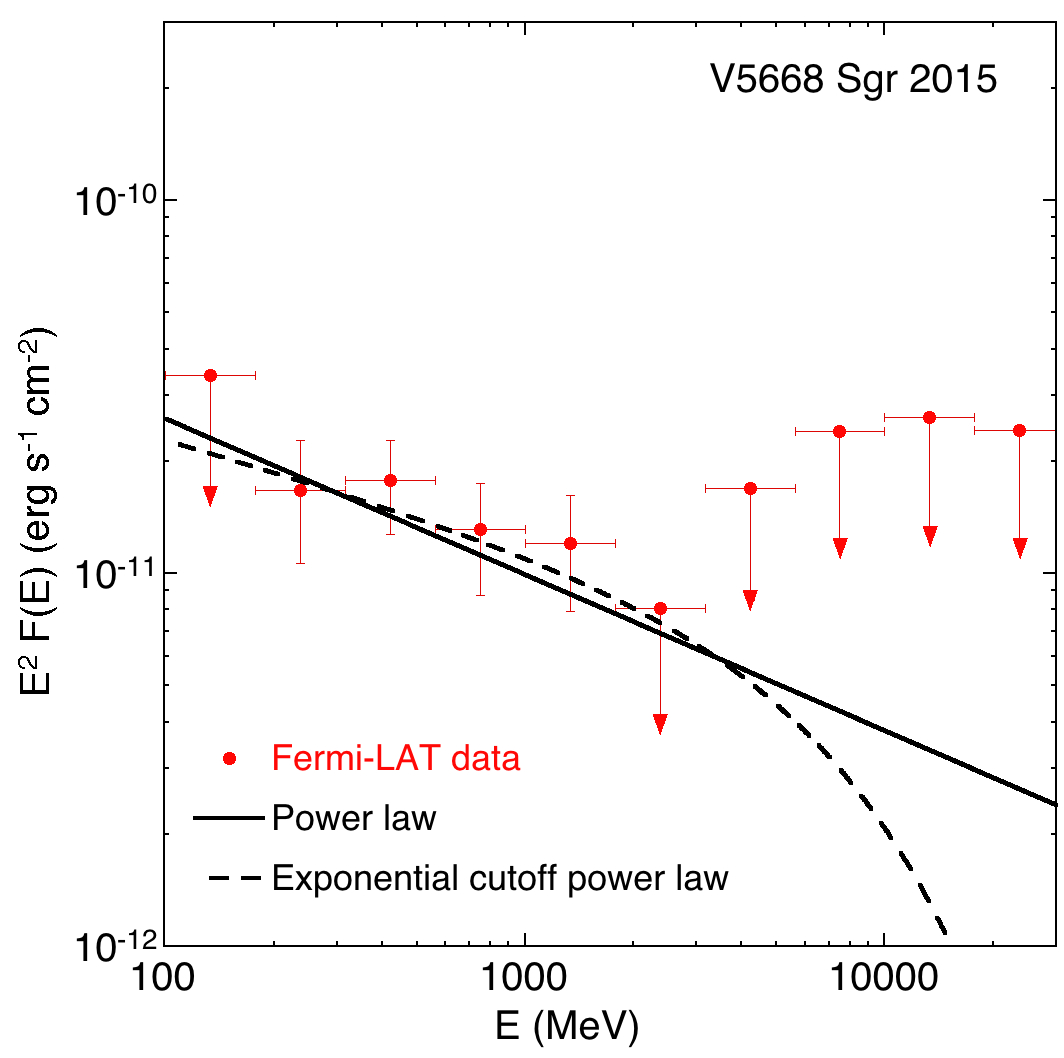
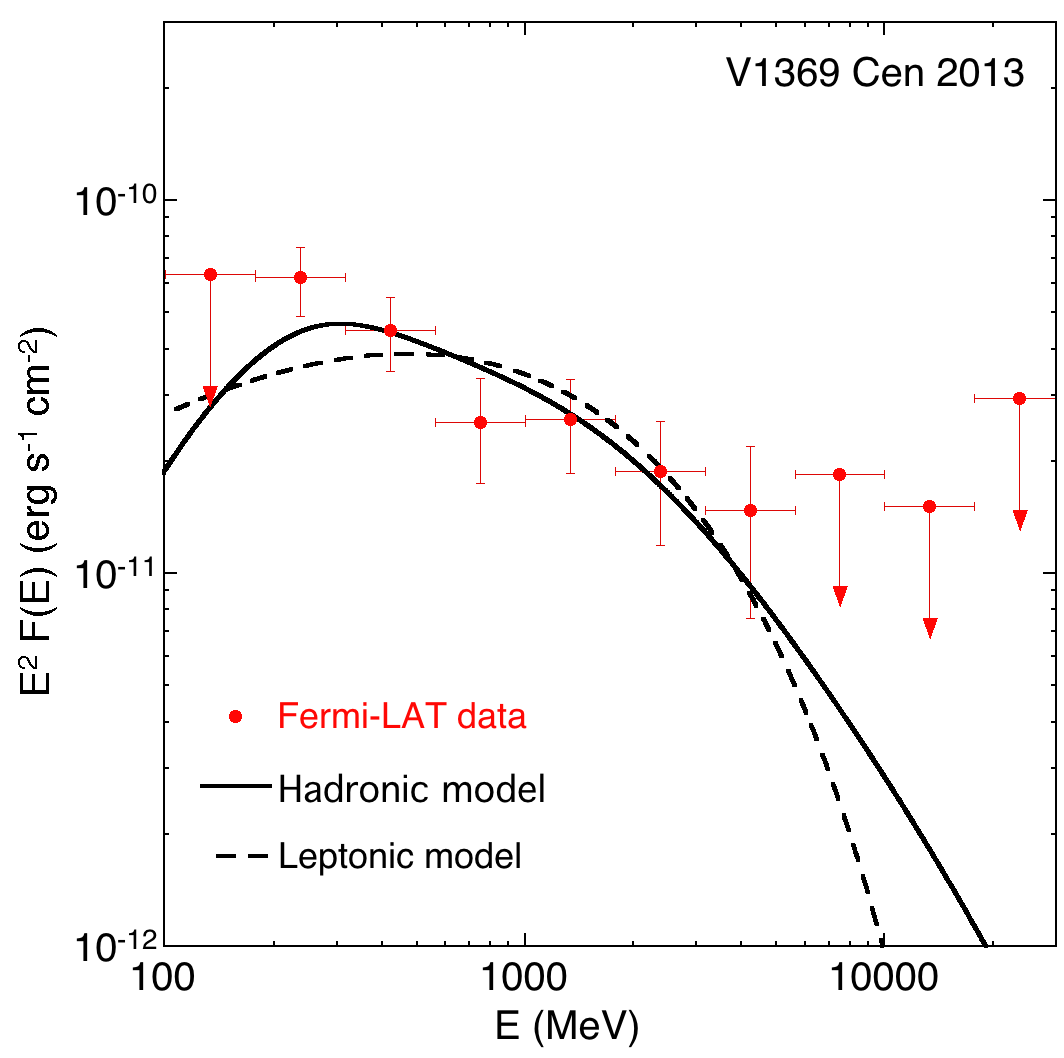
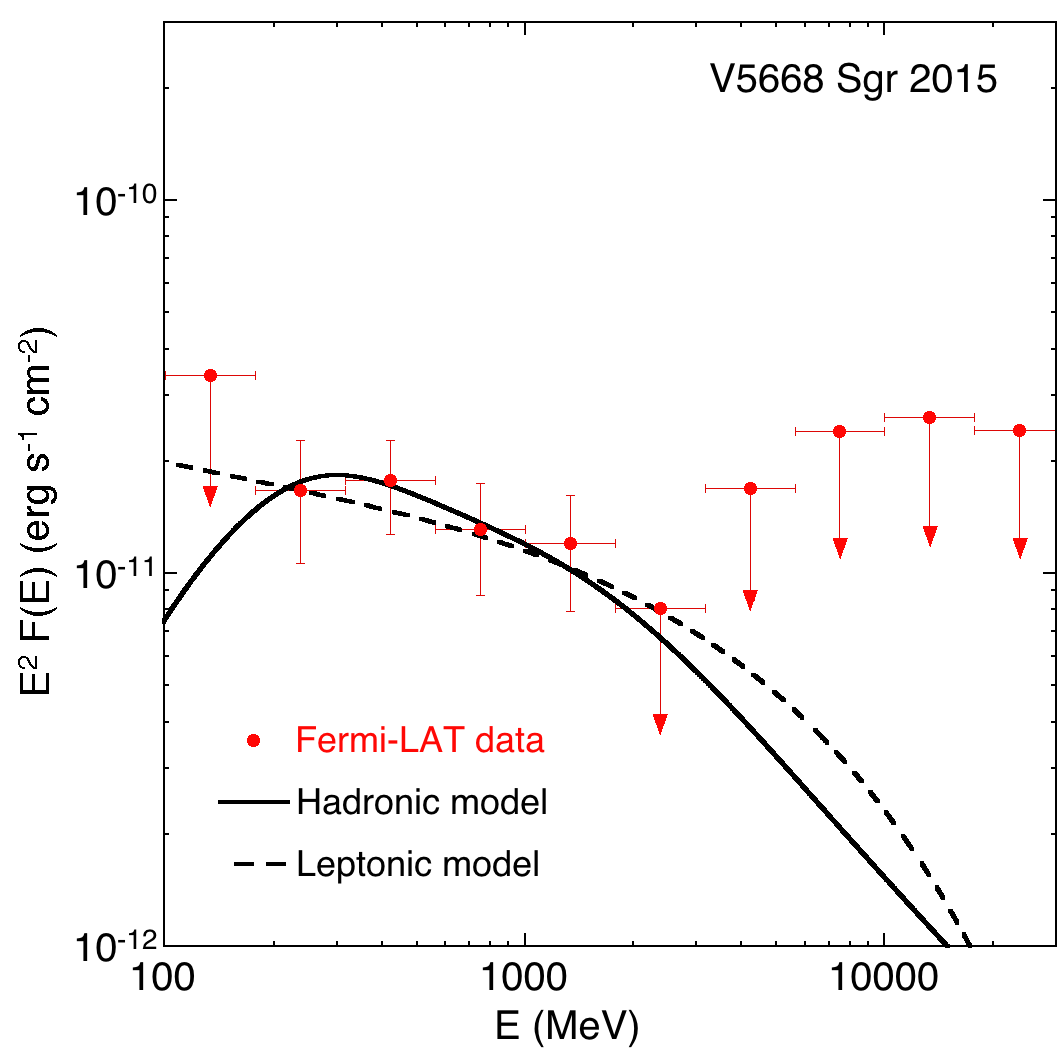
To derive average LAT spectra, we selected data covering the total durations (39 days for V1369 Cen and 55 days for V5668 Sgr) determined from the intervals spanned by the TS points in the 1-day bin light curves. The spectra were extracted using gtlike by fitting the flux from each nova in 12 logarithmic bins from 100 MeV to 100 GeV. As in Ackermann et al. (2014), we fit the data assuming a single PL with the integrated 100 MeV flux and the photon index as free parameters, and an exponentially cutoff power law (ECPL) which has the cutoff energy as an additional free parameter to gauge spectral curvature. The best-fit PL and ECPL parameters for both novae are presented in Table 2 with Figure 2 (top panels) showing the best-fit analytic curves overlaid onto the extracted LAT spectra. Note that the TS obtained with the ECPL fit in V1369 Cen is only slightly larger than the one obtained with the PL fit, amounting to an improvement of , while there is a negligible increase in TS in the V5668 Sgr case. In the three previously detected -ray classical novae (Ackermann et al., 2014), the spectra were similar with broad spectral peaks that cut off at energies 14 GeV and emission observed up to 610 GeV (the highest energy extension was observed in V1324 Sco), and we remark only that the relatively poor statistics in the new cases presented here do not permit a robust comparison.
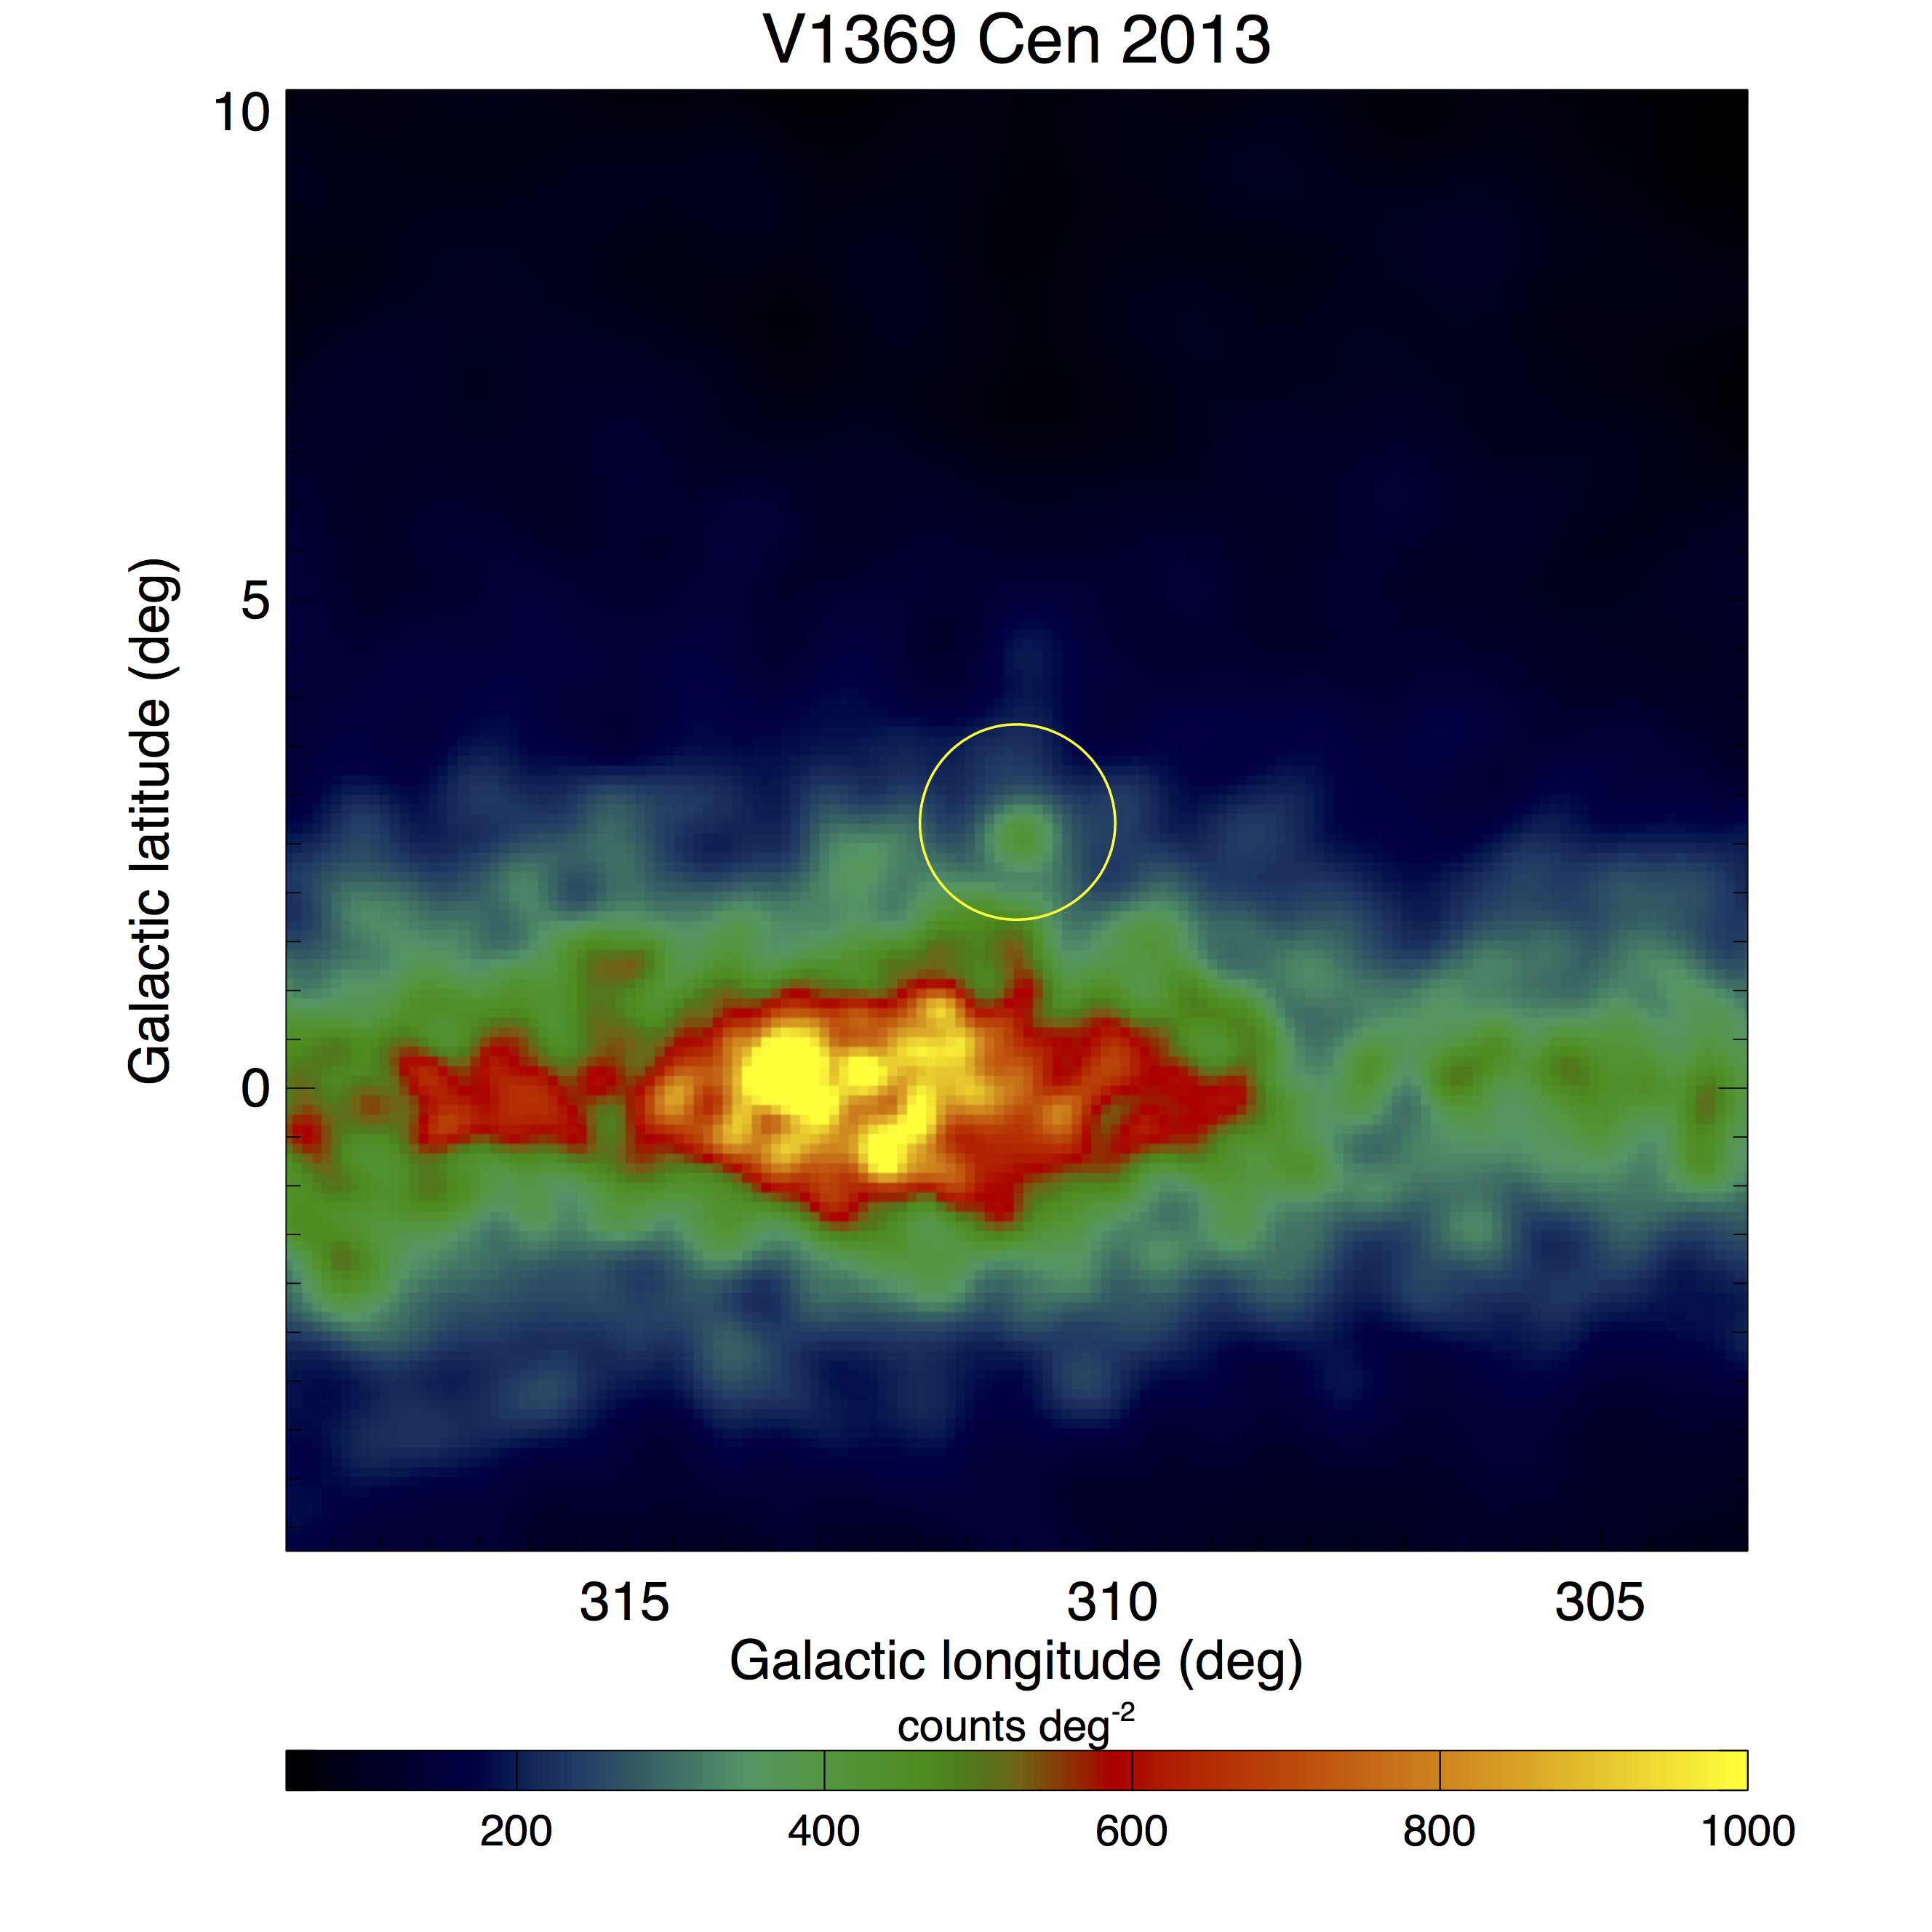
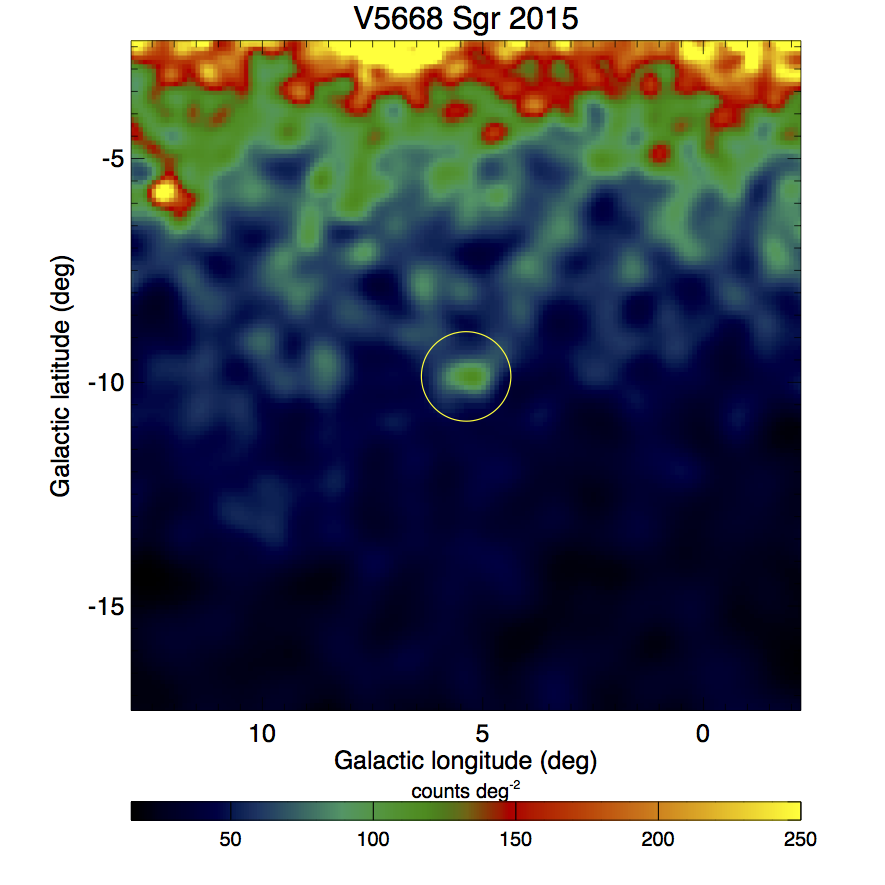
To confirm positional coincidences of the -ray sources with the novae, the LAT positions were determined by running the gtfindsrc tool assuming the single PL spectral model, using the same time interval used in the average spectral analyses. The -ray sources were well-localized with best-fit LAT localization error radii of 010 (V1369 Cen) and 014 (V5668 Sgr), consistent with their optical positions (Table 1). The smoothed LAT counts maps centered at each novae over the defined total data intervals is shown in Figure 3.
To help gauge whether the -ray emission is due to the decay of neutral pions produced by high-energy proton interactions in the ejecta (hadronic model), or due to inverse Compton and bremsstrahlung of high-energy electrons (leptonic model), the parameters of these physical models were also fit to the LAT data. Assuming a single emission region, the spectral distribution of interacting particles is assumed to be an exponentially cutoff power law defined with a slope, a cutoff energy, and a normalization factor. In the hadronic model, the high-energy protons are expected to be uniformly distributed in the expanding shell where they interact with the nuclei of the ejecta. We followed Ackermann et al. (2014, § S2, therein) for the leptonic model where a typical temperature of 15000 K with radius cm for the optically thick surface (equivalent to the nova photosphere in the optical band) was assumed. High-energy electrons are expected to produce -ray photons via bremsstrahlung in collisions with atoms in the ejecta, and the emission spectra were calculated assuming a typical ejecta mass of 10-5 M⊙. As in Ackermann et al. (2014), to simplify our estimates, we adopted a spherical geometry for both novae and the mean radius of the ejecta where high-energy electrons are expected to be accelerated and interact via inverse Compton scattering with photospheric photons is cm, assuming a typical ejecta velocity of 2000 km s-1 at 50 days after explosion. The mean density for the bremsstrahlung emission was obtained by dividing the ejecta mass by its mean volume (averaged over the -ray emission duration), assuming it is a shell with a relative thickness of = 0.4. Note the adopted value of the ejecta velocity was chosen to be consistent with strict lower limits of 15002000 km s-1 indicated by the half-widths at zero intensity of the Hydrogen lines in late-time optical spectra (50 days after optical discovery; Shore et al., 2014; Garde & Buil, 2015).
The best-fit parameters for the physical models obtained with gtlike along with their TS values are summarized in Table 2 with Figure 2 (bottom panels) showing the model curves compared to the LAT spectra. The slopes and the cutoff energies are not well constrained (see Figure 4 for the likelihood contours) which means that a single power law spectrum can explain the LAT data. With only small differences in TS values (TS 2 for V1369 Cen), the hadronic and leptonic model-fits were statistically indistinguishable, as they were in the three previously detected classical novae. The values of the best-fit physical parameters are similar to those obtained from the spectral analyses of the previous classical novae detected by Fermi-LAT, taking into account their uncertainties (cf., Ackermann et al., 2014, supplementary Figures S3 and S4 therein). The similarity of these results suggests a common mechanism is responsible for the -ray emission of classical novae with only the emissivity differing significantly between them.
In the hadronic model, the spectral fits to the LAT data allow us to estimate the total energy in high-energy protons, , and the conversion efficiency, , where is the kinetic energy of the ejecta. Here, the conversion efficiencies were calculated with based on the proton spectrum parameters that best fit the observed -ray spectral data, and differs from the cosmic-ray (CR) proton production conversion efficiency which is the ratio of the total energy of the CR protons accelerated at the shock front, , to the kinetic energy of the ejecta (see Appendix B). Estimating the conversion efficiency of the shock-accelerated CR proton production requires an accounting of the propagation and energy loss rate of protons in the expanding ejecta and an assumption of how they were injected (e.g., as a single burst, repeated shock events, at a continuous rate, or through wind-wind interactions). For simplicity, we assume high-energy protons collide with target Hydrogen atoms in the ejecta volume with a density averaged over the source lifetime taken to be the LAT-observed emission duration producing the mean observed -ray rate (see the online supplements of Abdo et al., 2010; Ackermann et al., 2014, for the details of the calculation method). Under these conditions, with a typical ejecta mass of 10-5 M⊙ and velocity of 2000 km s-1, the total energies in protons are erg and erg with and 6 for V1369 Cen and V5668 Sgr, respectively. Note that and scale with the inverse of the ejecta mass and with the square of the distance, which we have assumed to be uncertain to kpc. These values are slightly larger than (but of the same order of magnitude as) the ones obtained for the previous novae, (0.72) erg and 0.17 (see Table S3 of Ackermann et al., 2014). From the leptonic model-fits, the total energy in electrons, erg and erg for V1369 Cen and V5668 Sgr, respectively, with conversion efficiencies, for both novae. Here again, these values are similar to the ones obtained for previous novae (see Table S4 of Ackermann et al., 2014). Modeling the acceleration and propagation of protons including detailed parameterization of the evolving ejecta (see e.g., Martin & Dubus, 2013, in the case of V407 Cyg) with a more realistic geometry could change these estimates, but these calculations are beyond the scope of this paper.
3. Discussion
The two optically bright novae are part of an emergent class of transient Galactic -ray sources discovered with the Fermi-LAT. Together with the first LAT-detected symbiotic-like recurrent nova V407 Cyg and the three classical novae reported in Ackermann et al. (2014), this brings the total to six secure detections thus far. This total does not count the marginal 23 LAT observations of the recurrent symbiotic-like nova V745 Sco in the 1-day intervals on Feb 6th and 7th (Cheung et al., 2014), coincident with the optical peak discovery on 2014 Feb 6.694 (Stubbings & Pearce, 2014) or the current pending candidates from the LAT Pass 8 analysis of all known optical novae observed since Fermi’s launch (Franckowiak et al., 2015). The earliest LAT novae detections were serendipitously enabled through the Fermi-LAT’s all-sky monitoring mode, but the most recent examples were enabled by transitioning to deeper ToO observations following their optical discoveries by the amateur community. These two new LAT detections keep the -ray novae detection rate over the first 7 yrs of the Fermi mission at pace with the early rate of 1 yr-1, consistent with the estimated rate of Galactic novae at 45 kpc distances (Ackermann et al., 2014).
The average 100 MeV -ray flux of V5668 Sgr, photons cm-2 s-1, is the lowest so far for any LAT-detected nova, being smaller than for V1369 Cen and V339 Del, and 56 smaller than the other three LAT-detected novae. The corresponding 100 MeV luminosities are erg s-1 for V1369 Cen and erg s-1 for V5668 Sgr. The adopted distances are scaled to V339 Del (Shore et al., 2014) for V1369 Cen, and the suggested range is 1.52.0 kpc for V5668 Sgr (Banerjee et al., 2015). Such small distances are supported by the low extinctions, 0.100.14 for V1369 Cen (Izzo et al., 2013; Shore et al., 2014) and 0.20.3 for V5668 Sgr (Kuin et al., 2015). The implied 100 MeV -ray luminosities are thus, systematically, up to a factor of 10 smaller than the observed range of the previously detected novae of (39) erg s-1 and suggest more distant analogues will be difficult to detect with Fermi-LAT. Overall, these two new LAT detections suggest a wider range of -ray luminosities than observed in the first reported -ray detections, albeit with the inherent uncertainties in their distance determinations (see Cheung et al., 2015c).
Interestingly, V1369 Cen and V5668 Sgr also appear to have longer -ray emission durations than previous examples. Because they are fainter in rays on average than the previous LAT-detected novae, their light curves are more difficult to characterize, but nevertheless appear sporadic in nature with low-significance 1-day detections extended over moderately longer durations (up to 12 months). Specifically, during times of enhanced LAT exposures due to the ToOs, we found the -ray onsets delayed with respect to the first optical peaks by 2 days (§ 2.1) and 58 days after their optical discoveries. This delay could indicate the timescale for particle acceleration in the ejecta or -ray absorption at early times when the ejecta are most dense (Abdo et al., 2010; Ackermann et al., 2014; Chomiuk et al., 2014; Metzger et al., 2015). These explanations could have distinct signatures in early, time-resolved LAT spectra, with e.g., the latter scenario predicting progressively harder -ray spectra due to increased transmission of higher-energy photons, but the limited statistics in these cases prevent such an analysis. Moreover, the overall low statistics make it difficult to associate the later individual -ray detections with subsequent optical peaks although we note the brighter, second optical peak of 3.3 mag in V1369 Cen appears to be followed by a 2-day long -ray brightening (centered at 12 days) that is also delayed by 2 days (see below). The LAT detections overall span the duration of the multi-peaked optical activity in each nova (§ 1; Figure 1), and indicates future -ray novae require dedicated long-term increased LAT-exposures to establish any possible correlations with optical activity (see discussions of previous cases in e.g., Metzger et al., 2015).
| Nova | Distance | Duration | Fluence | Number of photons | Total energy |
|---|---|---|---|---|---|
| (kpc) | (days) | (photons cm-2) | (1045) | (1042 erg) | |
| V1324 Sco 2012 | 4.5 | 17 | 0.72 0.04 | 1.77 0.40 | 1.27 0.29 |
| V959 Mon 2012 | 3.6 | 22 | 0.79 0.12 | 1.23 0.39 | 0.67 0.21 |
| V339 Del 2013 | 4.2 | 27 | 0.45 0.07 | 0.96 0.27 | 0.57 0.16 |
| V1369 Cen 2013 | 2.5 | 39 | 0.71 0.14 | 0.54 0.24 | 0.30 0.13 |
| V5668 Sgr 2015 | 2.0 | 55 | 0.52 0.11 | 0.25 0.14 | 0.12 0.07 |
Notes. Durations of the 100 MeV -ray emission, fluences, total number of photons, and total energy emitted by classical novae as derived from LAT data analysis. For the three previously detected classical novae, the distances adopted were taken from Ackermann et al. (2014). The 1 uncertainties of the total number of photons and total energies take into account an adopted uncertainty of 0.5 kpc for all the distances.
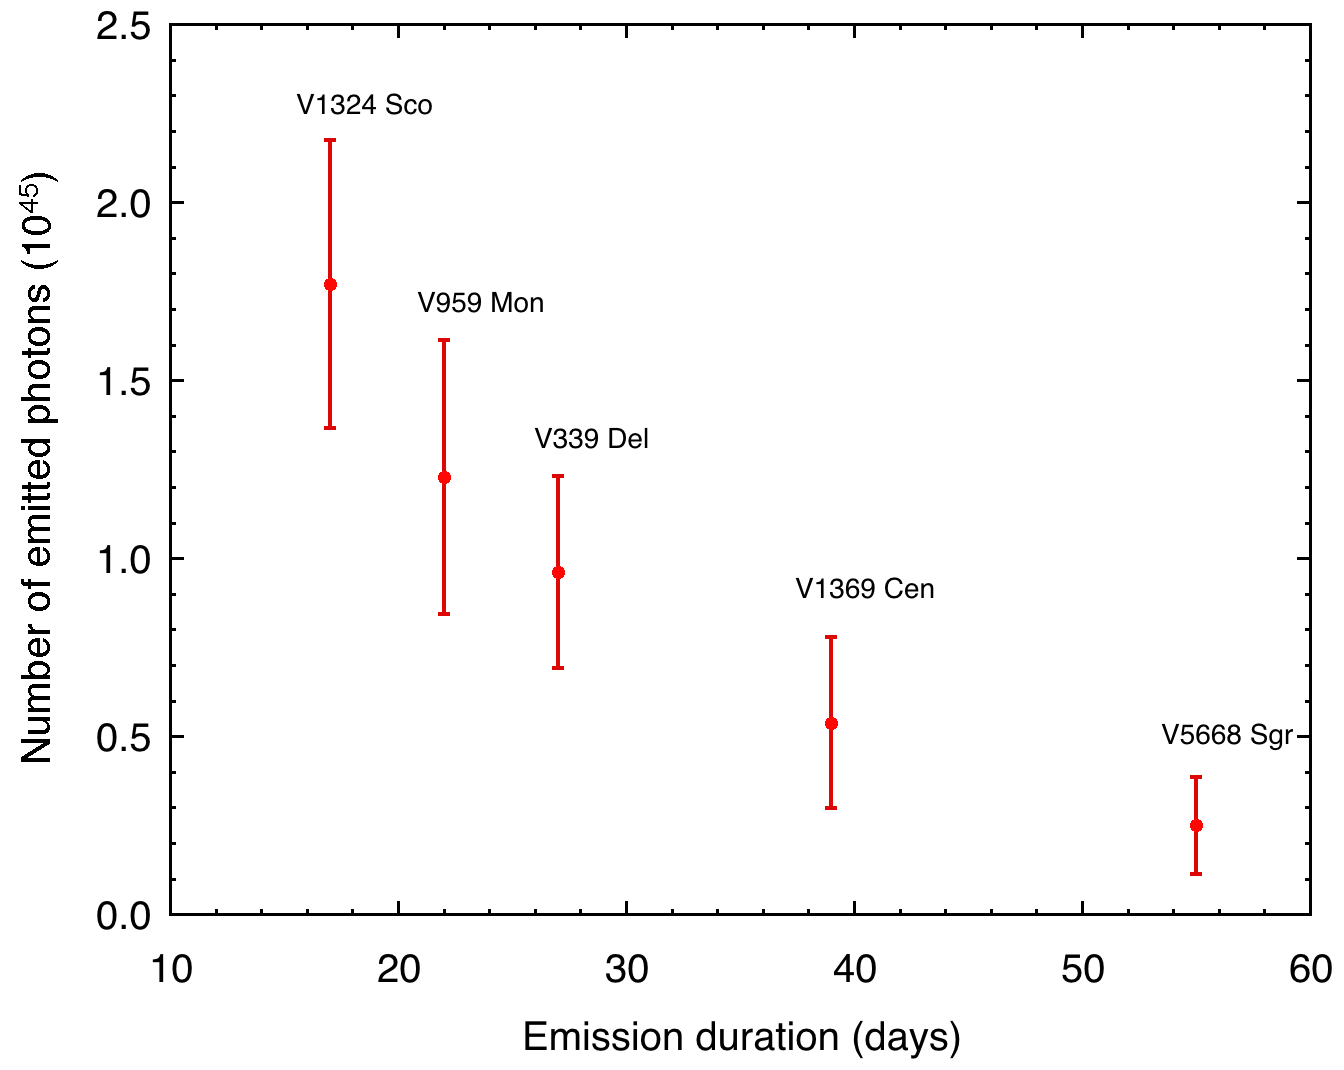
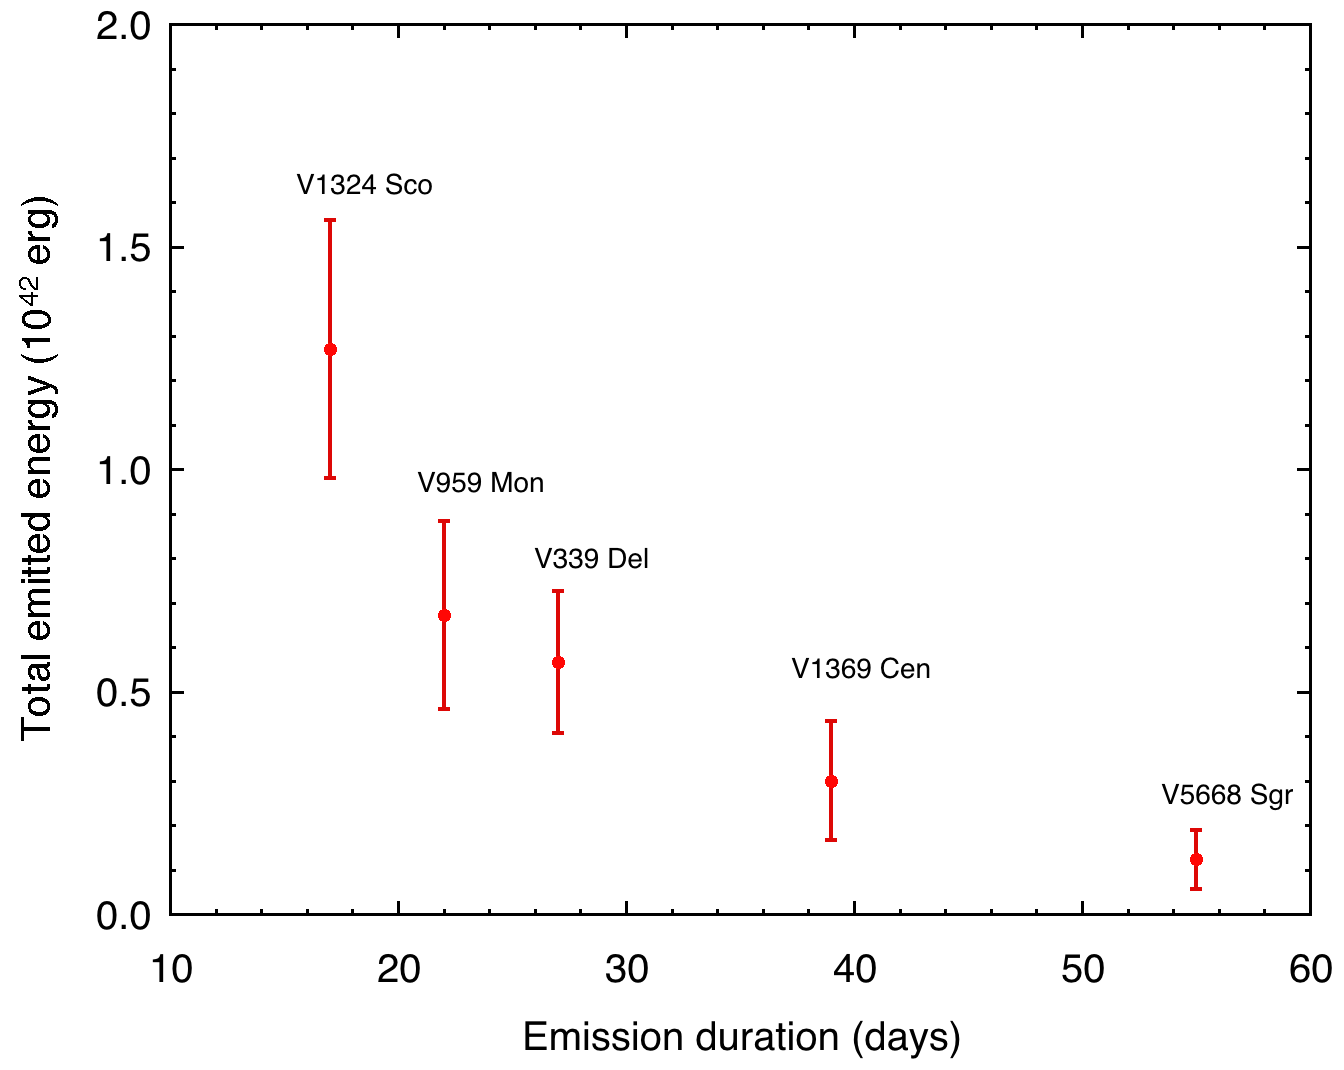
That the LAT-observed durations of these two classical novae are longer than in the three previously detected examples is of interest, particularly with the lower -ray luminosities of the former. We can thus remark on a plausible relation between the total emission durations of the 100 MeV emission found in our LAT-based studies and the mean -ray luminosity in the same band (in photons s-1). Because the mean luminosity logically decreases with the integration period for transient events, we estimated the total number of 100 MeV photons emitted as well as the total energies over the emission duration and found that the longer the -ray duration, the smaller the total number of emitted photons and total energies (Figure 5, Table 3). As an intermediate step, the fluences were calculated by multiplying the best-fit average 100 MeV fluxes from the ECPL fits (see Table 2 and Table S1 of Ackermann et al., 2014) by the total durations. Note the total energies for the three previously detected classical novae were presented in Ackermann et al. (2014) assuming the PL fits, and are consistent with the values presented here. The two new LAT-detected classical novae probe systematically lower values of total energies as the previous examples, as well as total number of emitted photons. Despite the intriguing apparent inverse relationship of these quantities with -ray durations, we cannot rule out selection effects related to the Fermi-LAT sensitivity (e.g., some photons are missing because the flux is too low to be detected) or conclude whether there is a relationship at all due, e.g., to the uncertain distances888For example, taking the larger distance of 6.5 kpc for V1324 Sco (Finzell et al., 2015) than the 4.5 kpc we adopted, the number of emitted photons increases from to .. A more extensive sample of Fermi-LAT detected novae could test whether this relation is due to physics of the outbursts, particle acceleration, and ejecta parameters – e.g., for short emission durations, the putative shocks cross more compact ejecta (i.e., with higher density) and for longer emission durations the shock goes through ejecta with larger radii (with lower density) and is less efficient in producing rays.
There has been a long history of predictions (§ 1) for MeV line emission promptly after the thermonuclear runaway when the explosion is optically thick, i.e., as the optical brightness peaks and before the GeV emission onset. Specifically, line emission will be expected at 478 keV and 1275 keV for CO and ONe novae, respectively, together with positron annihilation line emission at 511 keV and continuum down to 2030 keV due to Comptonization and positronium emission. The multiple optical peaks observed in V1369 Cen and V5668 Sgr, with apparent concomitant 100 MeV band emission could signal renewed outbursts, originating either from repeated shock events in the ejecta or distinct outbursts from the white dwarf surface. In the former, the -ray observations probe the density profile of the ejecta where the shock could interact with different density material resulting in varying rates of particle injection for acceleration processes and/or different target density material for interactions producing rays. In the latter case, any accompanying radioactive decay emission will depend on ejecta mass and ejecta velocity for a given white dwarf mass (Hernanz et al., 2002), which can be different for each subsequent outburst. Previous observations of emission up to 70 keV with Suzaku (Takei et al., 2009) and the likely 0.1 MeV Compton/OSSE detection of V382 Vel 1999 (Cheung et al., 2015c) suggest extended timescale emission in classical novae, and should motivate continuum emission searches with INTEGRAL (Winkler et al., 2003) and ASTRO-H (Takahashi et al., 2012; Coppi et al., 2014) at later times than so far considered for the nuclear decay emission.
4. Conclusions
The newly reported 100 MeV -ray detections of V1369 Cen and V5668 Sgr add to the four previously detected novae by the Fermi-LAT. These recent detections may be revealing a wider diversity in -ray properties, being fainter and seemingly characterized by longer total durations. Further serendipitous and targeted -ray detections through the continued Fermi mission, as well as studies of non-LAT detected novae (Cheung, 2012; Franckowiak et al., 2015) could further broaden the range of observed -ray properties. While observationally based scenarios have been developed for symbiotic systems (Tatischeff & Hernanz, 2007), and V407 Cyg in particular (Abdo et al., 2010; Chomiuk et al., 2012; Nelson et al., 2012; Orlando & Drake, 2012; Martin & Dubus, 2013; Pan et al., 2015), understanding the particle acceleration revealed in the classical novae is still an open problem. Thus future Fermi-LAT observations of novae (where deep pointed observations are imperative to study the brightest -ray emitting novae in detail) can be exploited with multi-wavelength observations and modeling to test scenarios for how, when, and where the putative shocks are generated, e.g., in internal shocks or strong turbulence driven in the ejecta (Ackermann et al., 2014) or in wind-wind interactions (Chomiuk et al., 2014), and can implicate the underlying -ray emission mechanism (see e.g., Metzger et al., 2015).
At the highest energies, one can anticipate very high energy (VHE; 0.1 TeV) emission as well as a transient neutrino signal in the pion-decay scenario for symbiotic novae (Razzaque et al., 2010; Aliu et al., 2012; Bednarek, 2013) and for classical novae (Ahnen et al., 2015; Metzger et al., 2016). Amongst the recurrent novae with shorter recurrence times (Schaefer, 2010), we may anticipate an explosion from RS Oph during the Fermi mission and in the era of the upcoming Cherenkov Telescope Array. Naively scaling by distance, we may expect the even more nearby system, T CrB (0.8 kpc), to produce an order of magnitude brighter GeV source than V407 Cyg (2.7 kpc), with emission extending below MeV and up to VHE energies. Any particularly nearby, 12 kpc, classical nova in the future will provide a useful contrasting case to the symbiotic/recurrent systems.
With the study of novae now expanded into the -ray regime, the words of Payne-Gaposchkin (1957, pg. VII) ring even more true today, “I have become convinced that the whole nova phenomenon must be studied; the variations of total light and continuum, of radial velocity, and of the intensities and profiles of absorption and emission lines must be seen as connected parts of one physical phenomenon, rather than as isolated data that can be understood separately.” With the expanding number of LAT-detected novae, existing models are open to a greater level of scrutiny, and the opportunities with Fermi should be pursued in earnest.
References
- Abdo et al. (2010) Abdo, A. A., Ackermann, M., Ajello, M., et al. 2010, Science, 329, 817
- Acero et al. (2015) Acero, F., Ackermann, M., Ajello, M., et al. 2015, ApJS, 218, 23
- Ackermann et al. (2012) Ackermann, M., Ajello, M., Albert, A., et al. 2012, ApJS, 203, 4
- Ackermann et al. (2014) Ackermann, M., Ajello, M., Albert, A., et al. 2014, Science, 345, 554
- Ahnen et al. (2015) Ahnen, M. L., Ansoldi, S., Antonelli, L. A., et al. 2015, A&A, 582, A67
- Aliu et al. (2012) Aliu, E., Archambault, S., Arlen, T., et al. 2012, ApJ, 754, 77
- Atwood et al. (2009) Atwood, W. B., Abdo, A. A., Ackermann, M., et al. 2009, ApJ, 697, 1071
- Banerjee et al. (2015) Banerjee, D. P. K., Srivastava, M. K., Ashok, N. M., Venkataraman, V. 2015, MNRAS, 455, L109
- Bednarek (2013) Bednarek, W. 2013, Astropart. Phys., 43, 81
- Bode & Evans (2008) Bode, M. F., & Evans, A. (Eds.) 2008, Classical Novae, 2nd Edition. Cambridge Astrophysics Series, No. 43, Cambridge: Cambridge University Press
- Cheung (2012) Cheung, C. C. 2012, in 4th Fermi Symposium, Monterey CA, eConf C121028, 106; arXiv:1304.3475
- Cheung et al. (2010) Cheung, C. C., Donato, D., Wallace, E., et al. 2010, ATel, 2487, 1
- Cheung et al. (2013a) Cheung, C. C., Jean, P., Shore, S. N. 2013a, ATel, 5649, 1
- Cheung et al. (2013b) Cheung, C. C., Jean, P., Shore, S. N. 2013b, ATel, 5653, 1
- Cheung et al. (2014) Cheung, C. C., Jean, P., Shore, S. N. 2014, ATel, 5879, 1
- Cheung et al. (2015a) Cheung, C. C., Jean, P., Shore, S. N. 2015a, ATel, 7283, 1
- Cheung et al. (2015b) Cheung, C. C., Jean, P., Shore, S. N. 2015b, ATel, 7315, 1
- Cheung et al. (2015c) Cheung, C. C., Jean, P., Shore, S. N., Grove, J. E., Leising, M. 2015c, Proceedings of Science (ICRC2015), 34th ICRC, 880; arXiv:1605.01375
- Chomiuk et al. (2012) Chomiuk, L., Krauss, M. I., Rupen, M. P., et al. 2012, ApJ, 761, 173
- Chomiuk et al. (2014) Chomiuk, L., Linford, J. D., Yang, J., et al. 2014, Nature, 514, 339
- Clayton (1981) Clayton, D. D. 1981, ApJ, 244, L97
- Clayton & Hoyle (1974) Clayton, D. D., & Hoyle, F. 1974, ApJ, 187, L101
- Coppi et al. (2014) Coppi, P., Stawarz, Ł., Done, C., et al. 2014, ASTRO-H Space X-ray Observatory White Paper: broad-band spectroscopy and polarimetry, arXiv:1412.1190
- Finzell et al. (2015) Finzell, T., Chomiuk, L., Munari, U., & Walter, F. M. 2015, ApJ, 809, 160
- Franckowiak et al. (2015) Franckowiak, A., Buson, S., Jean, P., Cheung, T. 2015, Abstracts of the Sixth Fermi Symposium, 3179
- Garde & Buil (2015) Garde, O., & Buil, C. 2015, ARAS Eruptive Stars Information Letter no. 17, F. Teyssier (Ed.), 2015-05, pp. 11-13
- Gehrz et al. (1998) Gehrz, R. D., Truran, J. W., Williams, R. E., & Starrfield, S. 1998, PASP, 110, 3
- Hernanz (2008) Hernanz, M. 2008, in Classical Novae, M. F. Bode, A. Evans, Eds. (Cambridge: Cambridge University Press), 2nd Ed., 252
- Hernanz (2014) Hernanz, M. 2014, ASPC, 490, 319
- Hernanz et al. (2002) Hernanz, M., Gómez-Gomar, J., & José, J. 2002, New AR, 46, 559
- Izzo et al. (2013) Izzo, L., Mason, E., Vanzi, L., et al. 2013, ATel, 5639, 1
- Kornoch (2013) Kornoch, K. 2013, ATel, 5621, 1
- Kraft (1964) Kraft, R. P. 1964, ApJ, 139, 457
- Kuin et al. (2015) Kuin, P., Page, K., Osborne, J., Shore, S., Schwartz, G., Walter, F. 2015, ATel, 8275, 1
- Lundmark (1921) Lundmark, K. 1921, PASP, 33, 225
- Martin & Dubus (2013) Martin, P., & Dubus, G. 2013, A&A, 551, A37
- Mattox et al. (1996) Mattox, J. R., Bertsch, D. L., Chiang, J., et al. 1996, ApJ, 461, 396
- McLaughlin (1939) McLaughlin, D. B. 1939, Popular Astronomy, 47, 410
- Metzger et al. (2015) Metzger, B. D., Finzell, T., Vurm, I., et al. 2015, MNRAS, 450, 2739
- Metzger et al. (2016) Metzger, B. D., Caprioli, D., Vurm, I., et al. 2016, MNRAS, 457, 1786
- Munari et al. (2015) Munari, U., Maitan, A., Moretti, S., & Tomaselli, S. 2015, New A, 40, 28
- Nelson et al. (2012) Nelson, T., Donato, D., Mukai, K., Sokoloski, J., & Chomiuk, L. 2012, ApJ, 748, 43
- Orlando & Drake (2012) Orlando, S., & Drake, J. J. 2012, MNRAS, 419, 2329
- Pan et al. (2015) Pan, K.-C., Ricker, P. M., Taam, R. E. 2015, ApJ, 806, 27
- Payne-Gaposchkin (1957) Payne-Gaposchkin, C. 1957, The Galactic Novae, Amsterdam: North-Holland
- Razzaque et al. (2010) Razzaque, S., Jean, P., Mena, O. 2010, Phys. Rev. D, 82, 123012
- Schaefer (2010) Schaefer, B. E. 2010, ApJS, 187, 275
- Seach et al. (2013) Seach, J., Guido, E., Howes, N., et al. 2013, CBET, No. 3732
- Seach et al. (2015) Seach, J., Itagaki, K., Guido, E., et al. 2015, CBET, No. 4080
- Shore et al. (2014) Shore, S. N., Schwartz, G. J., Walter, F. M., et al. 2014, ATel, 6413, 1
- Starrfield et al. (1978) Starrfield, S., Truran, J. W., Sparks, W. M., & Arnould, M. 1978, ApJ, 222, 600
- Stubbings & Pearce (2014) Stubbings, R., Pearce, A. 2014, reported by E. O. Waagen, CBET, No. 3803
- Takahashi et al. (2012) Takahashi, T., Mitsuda, K., Kelley, R., et al. 2012, Proc. SPIE, 8443, 84431Z
- Takei et al. (2009) Takei, D., Tsujimoto, M., Kitamoto, S., et al. 2009, ApJ, 697, L54
- Tatischeff & Hernanz (2007) Tatischeff, V., & Hernanz, M. 2007, ApJ, 663, L101
- Waagen (2015) Waagen, E. O. (Ed.) 2015, AAVSO Alert Notice 519
- Williams et al. (2015) Williams, S. C., Darnley, M. J., Bode, M. F. 2015, ATel, 7230, 1
- Winkler et al. (2003) Winkler, C., Courvoisier, T. J.-L., Di Cocco, G., et al. 2003, A&A, 411, L1
- Woudt & Ribeiro (2014) Woudt, P. A., & Ribeiro, V. A. R. M. (Eds.) 2014, Stella Novae: Past and Future Decades, ASP Conf. Ser. 490
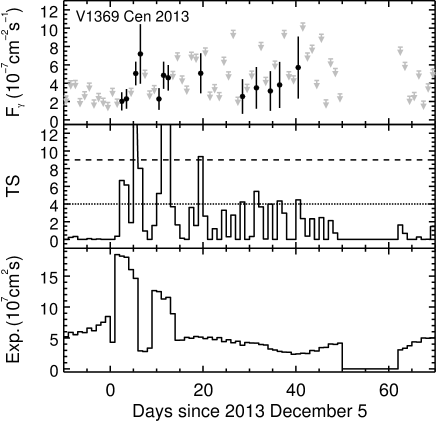
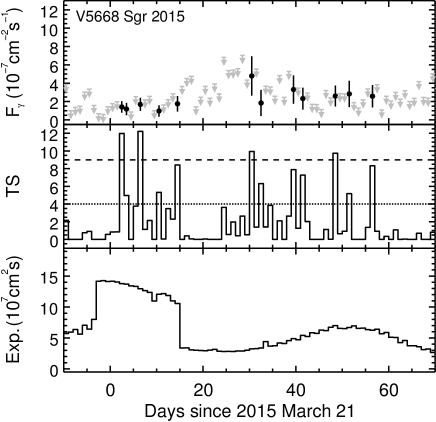
Appendix A A. Fermi-LAT Light Curves
The Fermi-LAT 1-day bin light curve data, TS, and exposure values are presented in Figure A1, with the fluxes and TS values tabulated in Table A1.
| Days since | V1369 Cen 2013 | V5668 Sgr 2015 | ||
|---|---|---|---|---|
| start | TS | TS | ||
| –9.5 | 0.0 | 2.4 | ||
| –8.5 | 0.2 | 0.0 | ||
| –7.5 | 0.3 | 0.0 | ||
| –6.5 | 0.0 | 0.0 | ||
| –5.5 | 0.0 | 0.8 | ||
| –4.5 | 0.1 | 0.9 | ||
| –3.5 | 0.0 | 0.0 | ||
| –2.5 | 0.0 | 0.0 | ||
| –1.5 | 0.0 | 0.0 | ||
| –0.5 | 0.0 | 0.5 | ||
| 0.5 | 0.0 | 0.7 | ||
| 1.5 | 0.4 | 0.9 | ||
| 2.5 | 6.7 | 11.5 | ||
| 3.5 | 6.1 | 5.3 | ||
| 4.5 | 1.9 | 0.0 | ||
| 5.5 | 37.6 | 4.0 | ||
| 6.5 | 8.0 | 11.6 | ||
| 7.5 | 0.9 | 1.1 | ||
| 8.5 | 0.0 | 2.3 | ||
| 9.5 | 1.6 | 0.0 | ||
| 10.5 | 5.2 | 5.0 | ||
| 11.5 | 20.3 | 0.1 | ||
| 12.5 | 19.3 | 3.1 | ||
| 13.5 | 3.7 | 2.8 | ||
| 14.5 | 1.6 | 8.5 | ||
| 15.5 | 0.1 | 0.0 | ||
| 16.5 | 0.0 | 0.5 | ||
| 17.5 | 3.6 | 0.2 | ||
| 18.5 | 1.6 | 0.0 | ||
| 19.5 | 9.4 | 0.0 | ||
| 20.5 | 2.6 | 0.1 | ||
| 21.5 | 0.0 | 0.0 | ||
| 22.5 | 1.2 | 0.1 | ||
| 23.5 | 0.0 | 0.0 | ||
| 24.5 | 3.3 | 3.4 | ||
| 25.5 | 0.3 | 0.7 | ||
| 26.5 | 2.7 | 1.8 | ||
| 27.5 | 0.0 | 0.6 | ||
| 28.5 | 4.2 | 2.9 | ||
| 29.5 | 0.0 | 0.5 | ||
| 30.5 | 0.3 | 10.2 | ||
| 31.5 | 5.4 | 1.6 | ||
| 32.5 | 3.7 | 6.0 | ||
| 33.5 | 0.1 | 1.4 | ||
| 34.5 | 4.0 | 3.4 | ||
| 35.5 | 0.0 | 0.0 | ||
| 36.5 | 4.3 | 2.3 | ||
| 37.5 | 3.0 | 0.0 | ||
| 38.5 | 0.0 | 2.9 | ||
| 39.5 | 0.0 | 8.0 | ||
| 40.5 | 4.5 | 1.4 | ||
| 41.5 | 2.4 | 7.1 | ||
| 42.5 | 0.4 | 1.8 | ||
| 43.5 | 2.3 | 0.0 | ||
| 44.5 | 0.0 | 0.0 | ||
| 45.5 | 2.5 | 0.0 | ||
| 46.5 | 0.0 | 1.2 | ||
| 47.5 | 2.1 | 0.0 | ||
| 48.5 | 0.7 | 9.7 | ||
| 49.5 | 0.0 | 0.8 | ||
| 50.5 | - | - | 0.9 | |
| 51.5 | - | - | 6.1 | |
| 52.5 | - | - | 0.0 | |
| 53.5 | - | - | 0.0 | |
| 54.5 | - | - | 0.0 | |
| 55.5 | - | - | 1.6 | |
| 56.5 | - | - | 8.6 | |
| 57.5 | - | - | 1.4 | |
| 58.5 | - | - | 0.0 | |
| 59.5 | - | - | 0.4 | |
| 60.5 | - | - | 0.0 | |
| 61.5 | - | - | 1.0 | |
| 62.5 | 1.6 | 0.0 | ||
| 63.5 | 0.7 | 0.0 | ||
| 64.5 | 0.0 | 0.0 | ||
| 65.5 | 0.0 | 0.0 | ||
| 66.5 | 0.3 | 0.7 | ||
| 67.5 | 0.0 | 0.0 | ||
| 68.5 | 0.0 | 0.0 | ||
| 69.5 | 1.5 | 0.8 | ||
Notes. Days indicated are the centers of the 1-day bins relative to the defined start times (). TS values and 100 MeV fluxes, , in units of photons cm-2 s-1 ( upper limits when TS ) are presented. The gap in observations of V1369 Cen from 50.0 to 62.0 days is due to a LAT ToO on SN2014J in M82.
Appendix B B. Cosmic Ray Proton Energetics
Assuming that cosmic ray (CR) protons are injected at the shock front of a nova explosion at a constant rate with an energy spectrum , such that the total energy stored in CR protons over the source lifetime of the ejecta, , is:
| (B1) |
We define the CR proton production efficiency factor:
| (B2) |
where is the total kinetic energy of the ejecta, hence:
| (B3) |
CR protons injected at the shock front are advected downstream, where they interact with the ambient plasma through proton-proton () interactions, and may eventually escape diffusively. The characteristic timescales for these processes are and , respectively. Therefore, the CR proton energy spectrum, , evolves accordingly to:
| (B4) |
where . Note here interactions are modelled as “catastrophic” energy losses, and CR proton diffusion in the downstream is approximated by a simple “escape” term. The solution to the above equation at a given moment of time reads then as:
| (B5) |
assuming that is independent of time.
The interactions lead to the production of -ray photons with energies (see Abdo et al., 2010), with a monochromatic luminosity at a given moment approximately:
| (B6) |
where the numerical factor is of the order of ( because, in addition to rays, secondary pairs and neutrinos are also produced in interactions). Hence, around the peak photon energies for which , with corresponding , one has:
| (B7) |
(equations B3, B5, and B6).
Let us now consider the three possible cases:
-
i)
, where the source lifetime is much shorter than either the interaction timescale or the CR proton escape timescale. Under such conditions, , thus:
(B8) This case describes a young system where CR protons injected downstream have yet to escape, and only some fraction () of the total energy stored in CR protons at the shock front could be transferred to the -ray emission (depending on and regardless of ).
-
ii)
and , where the interaction timescale is much shorter than both the CR proton escape timescale and the source lifetime. Under such conditions, and , thus:
(B9) Here, CR protons injected downstream produce -rays so efficiently that all the energy stored in CR protons at the shock front is transferred immediately to -ray emission.
-
iii)
and , where the escape timescale is much shorter than both the interaction timescale and the source lifetime. Under such conditions, and , thus:
(B10) Here, CR protons injected downstream escape so efficiently, that only a very small fraction () of the total energy stored in CR protons at the shock front is transferred to the -ray emission over the source lifetime.
For the hadronic scenario considered in the main text, the condition described in case #i is applicable.