ISSN 1990-3413, Astrophysical Bulletin, 2016, Vol. 71, No. 2, pp.129-138 @ Pleiades Publishing, Ltd., 2016
Original Russian Text @ I.D.Karachentsev, V.E.Karachentseva, Yu.N.Kudrya 2016,
published in Astrofizicheskii Byulleten, 2016, Vol.71, No.2.
Ultra-Flat Galaxies Selected from RFGC Catalog. II. Orbital Estimates of Halo Masses
Abstract
We used the Revised Flat Galaxy Catalog (RFGC) to select 817 ultra-flat (UF) edge-on disk galaxies with blue and red apparent axial ratios of and . The sample covering the whole sky, except the Milky Way zone, contains 490 UF galaxies with measured radial velocities. Our inspection of the neighboring galaxies around them revealed only 30 companions with radial velocity difference of km s-1 inside the projected separation of kpc. Wherein, the wider area around the UF galaxy within kpc contains no other neighbors brighter than the UF galaxy itself in the same velocity span. The resulting sample galaxies mostly belong to the morphological types Sc, Scd, Sd. They have a moderate rotation velocity curve amplitude of about km s-1 and a moderate K-band luminosity of about . The median difference of radial velocities of their companions is km s-1, yielding the median orbital mass estimate of about . Excluding six probable non-isolated pairs, we obtained a typical halo-mass-to-stellar-mass of UF galaxies of about , what is almost the same one as in the principal spiral galaxies, like M 31 and M 81 in the nearest groups. We also note that ultra-flat galaxies look two times less ‘‘dusty’’ than other spirals of the same luminosity.
1 INTRODUCTION
The population of thin (flat) spiral galaxies is the most suitable laboratory for the study of physical processes of the formation and evolution of galactic disks. As noted by many authors kar1989:Karachentsev_n ; kau2009:Karachentsev_n ; sha2015:Karachentsev_n , simple disks of galaxies with no visible signs of a bulge avoid the regions with high environment density. An obvious reason for this is a supposed lack in isolated disks of a noticeable tidal perturbation from the nearest neighbors, capable of ‘‘warming up’’ the stellar disks in the vertical direction. According to mat2000:Karachentsev_n ; kar2002:Karachentsev_n ; kau+2009:Karachentsev_n ; kre2005:Karachentsev_n , thin disks distinguish themselves among the other spiral galaxies by decreased average surface brightness, blue color and low rotation curve amplitudes. Spectroscopic observations of several ultra-thin galaxies goa1981:Karachentsev_n have shown that the effects of emission line excitation by large-scale shock waves are mild in them.
Kormendy kor2013:Karachentsev_n has repeatedly stressed that the very existence of a large population of massive galaxies, devoid of bulges, is a big problem for the current theories of galaxy formation, where numerous mergers of small objects lead to a consistent growth of bulges. Comparing the images of flat galaxies obtained at the Hubble Space Telescope with the images from the Sloan Digital Sky Survey, Sachdeva et al. sac2015:Karachentsev_n have found that over the past 8 billion years since the era of until the present time, linear dimensions and masses of galactic disks have increased approximately twice. From there, the authors have concluded that the dominant mode of growth in thin disks is the accretion of intergalactic gas, rather than the process of hierarchical merging of dwarf galaxies.
Detection of ultra-thin disks among the galaxies, oriented at arbitrary angles to the line of sight is quite a challenge. The surest way to do this is to use a sample of spirals seen edge-on. In our previous paper kara2016:Karachentsev_n we made a selection of the most flat galaxies, based on the Revised Flat Galaxy Catalog kar1999:Karachentsev_n . Among the 4236 RFGC objects, 817 ultra-flat UF galaxies were selected, whose apparent blue () and red () axial ratios satisfy the condition: and . This sample covers the entire northern and southern sky, except for the region of the Milky Way ( and has an approximately % completeness up to the angular diameter of kara2016:Karachentsev_n . From the analysis of this fairly representative sample, we concluded that about 60% of UF galaxies have not got any close neighbors within the projection distance of kpc and the radial velocity differences of km s-1. The rest of the UF sample (approximately %) is a part of scattered associations and filaments along with the other brighter neighbors, and only around % of UF galaxies are the dominant objects in the dynamically bound multiple systems. We shall use the latter category in the following to estimate the mass of the dark halo of ultra-flat galaxies, which, to our knowledge, has never been previously estimated.
normal \setcaptionmargin5mm
2 UF GALAXY ORBITAL MASS ESTIMATION
The brightest spiral galaxies in the nearby groups, such as the M 31, M 81, and NGC 253 have a characteristic stellar mass of , the typical rotation curve amplitude of km s-1 and the halo radius of around kpc kar2014:Karachentsev_n ; kar+kud2015:Karachentsev_n . These galaxies, which dynamically dominate their environment, have quite noticeable bulges. The halo-mass-to-stellar-mass ratio in them is kar+kud2014:Karachentsev_n . By the and values, ultra-flat spirals are significantly inferior to the ‘‘host’’ spiral galaxies in the nearby groups. This gives us reason to believe that the characteristic halo radius around the UF galaxies is less than kpc.
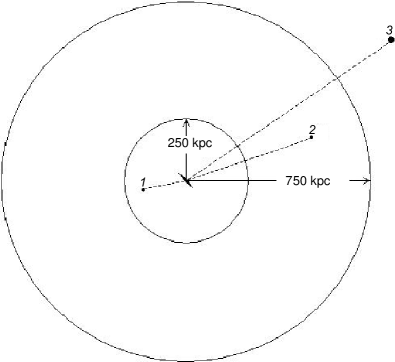
To search for the physical satellites related to the UF galaxies, we used the following simple algorithm, illustrated by Fig. 1. The considered ultra-flat galaxy should not have other brighter galaxies with the velocity difference of km s-1 within the radius of kpc around it. Among the neighboring fainter galaxies in the given range of radial velocities we considered to be physically linked only the satellites which are located within the projected separation of kpc. Thus, in the scheme of Fig. 1, galaxy 1 is the UF companion, and galaxy 2 may be either a UF companion, or a companion of a more massive galaxy 3. Of course, the criterium we used can not be called perfect. It may be met by a ‘‘UF + close neighbor in the projection ’’ pair, the components of which are a part of a scattered (non-virialized) association or a chain of galaxies.
We conducted the search of satellites around 490 ultra-flat galaxies with measured radial velocities using the options of the NASA Extragalactic Database (NED)(www.ned.ipac.caltech.edu). The linear projected separation of neighbors was determined under the assumption that their radial distances are equal to the distance of the UF galaxy, with the Hubble parameter of km s-1 Mpc-1. The result of this massive search was the detection of only 30 suspected physical satellites the data on which are presented in Table 1. A small number of satellites once again evidences that ultra-flat galaxies without bulges are located in the regions of very low number density of galaxies.
The columns of Table 1 contain: (1) the number of the UF galaxy in the RFGC catalog; (2) an abbreviated name of the satellite galaxy or the name of the sky survey in which its radial velocity was measured; (3) the heliocentric radial velocity of the UF galaxy and its satellite from the NED with the measurement errors (km s-1); (4) the morphological type: for the RFGC galaxy—based on the catalog data, for the satellite according to our estimates; (5, 6) the apparent axial ratios in blue and red bands according to the RFGC; (7) the apparent -magnitude of the RFGC galaxy from the NED and our estimate of -magnitude of the satellite; (8) Galactic extinction in the -band; (9) the apparent -band magnitude from the 2MASS survey jar2000:Karachentsev_n ; jar2003:Karachentsev_n ; in the cases where the 2MASS data were not available, to estimate it we used the relationship between the rotation curve amplitude, and the -luminosity (see Section 4);
0mm \onelinecaptionstrue\captionstylenormal
| RFGC | |||||||||||||||
|---|---|---|---|---|---|---|---|---|---|---|---|---|---|---|---|
| Neighb | |||||||||||||||
| (1) | (2) | (3) | (4) | (5) | (6) | (7) | (8) | (9) | (10) | (11) | (12) | (13) | (14) | (15) | |
| 99 | 5339 | 6 | Sc | 11.2 | 10.2 | 15.03 | 0.09 | 10.19 | 14.6 | 190 | 10.99 | ||||
| 2dF | 5306 | 89 | BCD | 18.2 | 33 | 10.64 | –0.35 | ||||||||
| 124 | 7170 | 12 | Sb | 10.0 | 8.7 | 14.64 | 0.07 | 9.83 | 16.5 | 294 | 11.36 | ||||
| 2MASX | 7225 | 64 | BCD | 17.3 | 68 | 12.03 | 0.67 | ||||||||
| 166 | 9448 | 53 | Sc | 14.1 | 11.1 | 16.29 | 0.07 | 11.01 | |||||||
| GALEX | 9500 | 89 | BCD | 18.6 | 114 | 11.56 | 0.55 | ||||||||
| 239 | 7083 | 45 | Sc | 10.1 | 10.4 | 16.0 | 0.13 | 12.15 | 10.44 | ||||||
| SDSS | 6935 | 5 | Im | 17.6 | 94 | 12.39 | 1.95 | ||||||||
| 365 | 5439 | 15 | Scd | 10.0 | 10.7 | 16.5 | 0.10 | 13.66 | 16.1 | 93 | 9.60 | ||||
| MCG-2-5-36 | 5456 | 4 | Sm | 16.5 | 175 | 10.78 | 1.18 | ||||||||
| 625 | 4955 | 13 | Sd | 11.2 | 11.2 | 16.3 | 0.33 | 11.92 | 16.1 | 128 | 10.22 | ||||
| SDSS | 5042 | 18 | Im | 18.4 | 167 | 12.17 | 1.95 | ||||||||
| 627 | 5279 | 6 | Sd | 13.7 | 12.3 | 16.5 | 0.42 | 13.86 | 16.3 | 87 | 9.50 | ||||
| UGC 2397 | 5117 | 9 | Sm | 16.9 | 100 | 12.50 | 3.00 | ||||||||
| 722 | 1873 | 2 | Sd | 11.5 | 8.6 | 15.33 | 0.15 | 11.27 | 14.2 | 101 | 9.60 | ||||
| MCG-3-9-37 | 1866 | 5 | Sm | 16.5 | 39 | 9.34 | –0.26 | ||||||||
| 1000 | 4121 | 11 | Scd | 12.5 | 11.5 | 15.3 | 0.47 | 9.63 | 14.1 | 250 | 11.00 | ||||
| MCG+13-5-3 | 4267 | 25 | dE | 16.0 | 216 | 12.73 | 1.73 | ||||||||
| 1236 | 2475 | 14 | Sd | 11.2 | 11.2 | 16.5 | 0.09 | 14.07 | 16.2 | 84 | 8.80 | ||||
| UGC 3940 | 2453 | 6 | Im | 16.5 | 189 | 11.03 | 2.23 | ||||||||
| 1462 | 596 | 6 | Sdm | 10.1 | 9.3 | 15.0 | 0.11 | 11.24 | 14.0 | 48 | 8.62 | ||||
| SDSS | 588 | 34 | Im | 17.2 | 48 | 9.46 | 0.84 | ||||||||
| 1522 | 7698 | 31 | Sd | 11.2 | 11.8 | 16.7 | 0.07 | 13.58 | 9.93 | ||||||
| 2MASX | 8082 | 17 | BCD | 16.8 | 90 | 13.17 | 3.24 | ||||||||
| 1567 | 3219 | 10 | Sd | 14.1 | 9.8 | 16.6 | 0.16 | 12.77 | 15.4 | 84 | 9.44 | ||||
| SDSS | 3505 | 1 | BCD | 18.1 | 182 | 13.24 | 3.80 | ||||||||
| 1716 | 7905 | 33 | Scd | 13.1 | 10.2 | 16.3 | 0.05 | 12.09 | 10.55 | ||||||
| SDSS | 7933 | 25 | Im | 17.9 | 58 | 10.73 | 0.18 | ||||||||
| MCG8-18-65 | 7956 | 28 | Sd | 17.0 | 65 | 11.30 | 0.75 | ||||||||
| 1744 | 3150 | 34 | Sd | 10.2 | 9.0 | 17.0 | 0.05 | 13.10 | 16.7 | 78 | 9.34 | ||||
| SDSS | 3127 | 14 | BCD | 18.2 | 157 | 11.00 | 1.66 | ||||||||
| 1782 | 9722 | 4 | Scd | 11.5 | 11.2 | 16.2 | 0.05 | 12.87 | 16.8 | 184 | 10.40 | ||||
| SDSS | 9674 | 28 | BCD | 17.6 | 117 | 11.49 | 1.09 | ||||||||
| 1880 | 5612 | 5 | Sd | 13.9 | 11.2 | 15.75 | 0.05 | 12.11 | 15.8 | 132 | 10.25 | ||||
| SDSS | 5528 | 34 | Im | 18.1 | 190 | 12.20 | 1.95 | ||||||||
| 1925 | 4162 | 1 | Sd | 11.7 | 11.7 | 16.1 | 0.10 | 13.23 | 15.7 | 88 | 9.51 | ||||
| U 6054Not.1 | 4270 | 8 | Sm | 18.0 | 13 | 11.23 | 1.72 | ||||||||
| 2111 | 5254 | 4 | Sd | 12.2 | 11.0 | 16.1 | 0.10 | 13.24 | 15.8 | 105 | 9.70 | ||||
| SDSS | 5146 | 10 | Sdm | 17.9 | 99 | 12.11 | 2.41 | ||||||||
| 2210 | 2452 | 2 | Scd | 11.6 | 10.1 | 14.9 | 0.11 | 12.37 | 13.9 | 94 | 9.38 | ||||
| UGC 7133 | 2567 | 7 | Sd | 14.9 | 204 | 12.51 | 3.13 | ||||||||
| 2474 | 1642 | 3 | Sm | 15.5 | 14.0 | 16.04 | 0.38 | 12.10 | 16.1 | 65 | 9.07 | ||||
| GALEX | 1450 | 45 | Im | 16.8 | 74 | 12.50 | 3.43 | ||||||||
| GALEX | 1509 | 45 | BCD | 16.9 | 199 | 12.62 | 3.55 | ||||||||
| 2546 | 6724 | 6 | Sc | 11.7 | 9.5 | 15.9 | 0.08 | 11.93 | 10.46 | ||||||
| SDSS | 6857 | 30 | Sm | 18.4 | 183 | 12.58 | 2.12 | ||||||||
| 2819 | 5832 | 2 | Scd | 11.7 | 10.5 | 15.58 | 0.11 | 11.50 | 15.7 | 144 | 10.52 | ||||
| SDSS | 5746 | 30 | Ir | 18.8 | 107 | 11.97 | 1.45 | ||||||||
| 3021 | 1915 | 3 | Sc | 10.6 | 8.5 | 13.9 | 0.41 | 10.6 | 14.5 | 113 | 9.91 | ||||
| UGC 9979 | 1961 | 3 | Im | 14.6 | 116 | 11.46 | 1.55 | ||||||||
| 3087 | 5694 | 3 | Sc | 11.2 | 10.2 | 16.7 | 0.23 | 13.60 | 15.6 | 99 | 9.68 | ||||
| SDSS | 5728 | 27 | BCD | 18.7 | 68 | 10.97 | 1.29 | ||||||||
| 3444 | 7178 | 10 | Sc | 11.1 | 9.6 | 16.2 | 0.50 | 11.74 | 14.4 | 199 | 10.61 | ||||
| 2MASX | 7074 | 45 | Sb | 16.2 | 94 | 12.08 | 1.47 | ||||||||
| 4081 | 4839 | 6 | Sc | 10.4 | 9.1 | 14.53 | 0.39 | 10.38 | 14.3 | 236 | 10.84 | ||||
| RFGC 4082 | 4720 | 3 | Sdm | 16.0 | 192 | 12.50 | 1.66 | ||||||||
| 4091 | 4961 | 2 | Scd | 11.1 | 10.1 | 15.4 | 0.20 | 11.30 | 14.8 | 134 | 10.49 | ||||
| 2MASX | 4739 | 235 | Sm | 16.0 | 80 | 12.68 | 2.19 | ||||||||
(10) the H I-flux (Jy km s-1), expressed in magnitudes according to the HyperLeda111http://leda-univ-lyon1.fr as; (11) the rotation curve amplitude from the HyperLeda (km s-1); (12) the log of the ultra-flat galaxy stellar mass (in );(13) the projected separation of the satellite in kpc; (14) the log of the orbital mass estimate (in ); (15) the log of the orbital-mass-to-stellar-mass ratio.
To estimate the orbital mass, we used the expression
| (1) |
valid at a random orientation of satellite orbits and the RMS orbit eccentricity value of kar1987:Karachentsev_n ; here is the gravitational constant, and is the radial velocity difference of the satellite and the UF galaxy.
When calculating the luminosity of a galaxy in the -band
| (2) | ||||
we accept the absolute -magnitude of the Sun, bin1998:Karachentsev_n and a correction for the Galactic extinction according to sch1998:Karachentsev_n .
As we can see from Table 1, only two ultra-flat galaxies (RFGC 1716 and 2474) have two satellites each within kpc, while in the remaining 26 UF galaxies the ‘‘escort’’ is presented by just one satellite.
normal \setcaptionmargin5mm
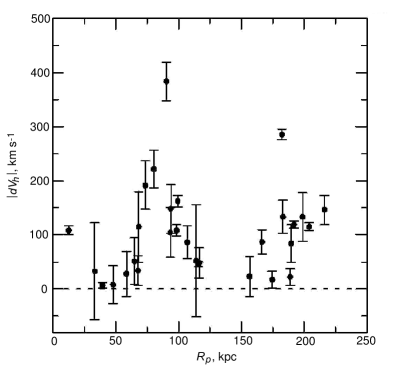
The distribution of ultra-flat galaxies and their satellites by the projected separation and the radial velocity difference modulus is shown in Fig. 2. The vertical bars on it correspond to the quadratic sum of errors for the pair components. In some cases, the error of the velocity difference is greater than the difference modulus itself. As can be seen from Fig. 2, the radial velocity differences are small. They exceed km s-1 only in two cases. The median value of the velocity difference modulus is km s-1. The orbital mass estimates for UF galaxies, presented in column (13) of Table 1 are characterized by a high scatter, a considerable part of which is due to random projection factors. The mean value of the orbital mass logarithm amounts to , which is close to the value of the median logarithm, . As far as we know from the literature, these estimates are the first estimates of the mass of the halo around the ultra-flat galaxies made on the scale of their effective halo radius.
3 MORPHOLOGICAL TYPES OF ULTRA-FLAT GALAXIES
As shown by Heidmann et al. hei1972:Karachentsev_n , the maximum apparent axial ratio in spiral galaxies increases along the Hubble sequence from the Sa type to Sd type, and then sharply drops for the irregular structure spirals, Sm type. According to kud1994:Karachentsev_n , the maximum apparent and the maximum intrinsic axial ratio for different types of spirals are characterized by the following values: and (Sb), and (Sbc), and (Sc), and (Scd), and (Sd).
Among the 30 considered ‘‘UF galaxy + satellite’’ pairs, in 26 cases an ultra-flat galaxy belongs to the Sc, Scd, Sd or , , morphological type on de Vaucouleurs scale. With the average error of classification of galaxies in the RFGC amounting to kar1997:Karachentsev_n , we can assume that almost all the ultra-flat galaxies have a uniform disk structure.
normal \setcaptionmargin5mm
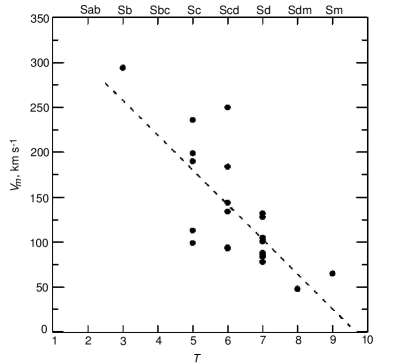
Figure 3 shows the distribution of UF galaxies from Table 1 by the morphological type and the rotation curve amplitude . Despite the small statistics, the figure shows a decrease of the rotation curve amplitude from early to late types. For the spirals of the Sdm and Sm types, the amplitude of regular motion, km s-1, becomes comparable with the average velocity of turbulent motions, km s-1, which impede the formation of ultra-thin disks.
The morphological types of the satellites of UF galaxies in column (4) of Table 1 belong to even later types than those of the ultra-flat galaxies themselves. We have classified more than a half of the satellites as Sm and BCD, what indicates that they dwell in the phase of active star formation.
4 STELLAR MASSES OF ULTRA-FLAT GALAXIES
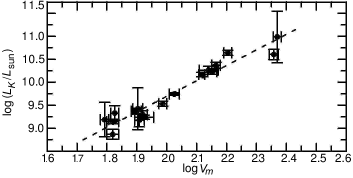
To determine the total stellar mass of a galaxy, its -band luminosity is typically used, assuming that bel2003:Karachentsev_n . The 2MASX catalog jar2000:Karachentsev_n ; jar2003:Karachentsev_n contains data on -magnitudes for roughly % of UF galaxies. However, being a shallow sky survey, 2MASS underestimates the luminosity of peripheric regions of galaxies, especially the blue objects of low surface brightness, to which quite a few UF galaxies belong. The top panel of Fig. 4 demonstrates the Tully-Fisher relation tul1977:Karachentsev_n between the -luminosity according to the 2MASS and the logarithm of the rotation curve amplitude for 23 galaxies from Table 1. The regression line for them is expressed as
| (3) | ||||
while the standard deviation from the regression line is . The parameters of this regression are close to the parameters obtained from the more extensive sample of RFGC galaxies kar2002:Karachentsev_n .
0mm \onelinecaptionstrue\captionstylenormal RFGC Type ) (1) (2) (3) (4) (5) (6) (7) (8) (9) (10) (11) 73 5287 Sdm 12.4 9.9 66 3 17.52 15.42 0.27 0.053 8.87 16.94 267 16186 Sd 11.0 9.1 – 17.72 12.86 0.07 0.049 10.86 – 415 11430 Sd 11.4 10.0 146 5 17.20 13.33 0.16 0.051 10.38 16.69 430 5620 Scd 10.1 11.0 106 4 17.19 13.39 0.07 0.112 9.74 16.63 500 4316 Sd 11.2 8.9 84 6 17.94 14.10 0.12 0.201 9.24 16.08 676 7619 Sd 15.1 13.1 – 17.71 13.50 0.11 0.126 9.96 – 769 6101 Sd 13.9 10.5 160 5 16.15 11.36 0.14 0.234 10.64 14.97 1587 4329 Sd 11.0 9.6 83 3 17.02 13.91 0.22 0.038 9.30 16.74 1672 2156 Scd 11.8 8.6 97 3 15.39 11.81 0.14 0.057 9.54 15.38 1761 3755 Sd 17.1 14.9 131 3 15.33 11.41 0.12 0.010 10.17 14.89 2260 1598 Sd 13.3 11.9 81 3 15.16 12.04 0.37 0.023 9.18 15.54 2295 4240 Sd 20.4 15.9 142 5 15.72 11.52 0.15 0.020 10.23 14.80 2928 2023 Sd 14.8 13.0 62 2 15.24 12.53 0.93 0.051 9.19 15.20 3064 10387 Scd 10.9 9.7 228 8 16.64 12.54 0.28 0.042 10.60 16.04 3274 2781 Sd 10.2 9.1 67 2 16.70 12.91 0.40 0.167 9.33 16.20 3385 4500 Scd 13.8 11.9 234 7 15.74 9.86 1.4 0.294 10.98 14.75 3468 – Scd 10.2 8.6 – 17.94 12.57 0.15 0.247 – – 3515 6008 Sd 14.3 10.4 138 10 16.89 12.27 0.21 0.225 10.26 – 3516 – Sc 11.1 9.7 – 17.79 14.07 0.14 0.169 – – 3549 – Sc 10.0 9.3 – 17.78 14.35 0.22 0.146 – – 3558 – Sc 12.3 9.1 – 18.59 13.59 0.10 0.057 – – 3659 5563 Scd 11.2 8.7 80 3 17.58 14.16 1.13 0.100 9.42 16.07 3779 – Scd 11.7 8.7 – 18.17 13.67 0.10 0.045 – – 3879 7827 Scd 10.6 10.2 79 3 17.84 15.02 0.16 0.067 9.37 17.06 4209 3865 Sd 11.2 10.1 66 3 17.29 14.06 0.12 0.089 9.15 16.68
Dalcanton and Bernstein dal2000:Karachentsev_n performed deep photometry of 49 RFGC-galaxies in the -, -, and -bands. Among them there proved to be 25 ultra-flat galaxies, the data on which are given in Table 2. Its columns contain: (1) the number of the galaxy in the RFGC catalog; (2) its heliocentric radial velocity; (3) morphological type; (4, 5) apparent axial ratio in the - and -bands from the RFGC; (6) the rotation curve amplitude and its error from the HyperLeda; (7) the apparent -magnitude within the isophote; (8) the apparent -magnitude within the isophote and its error; (9) the color excess due to Galactic extinction; (10) the logarithm of the -luminosity at ; (11) the H I-flux from the HyperLeda, expressed in magnitudes.
normal \setcaptionmargin5mm
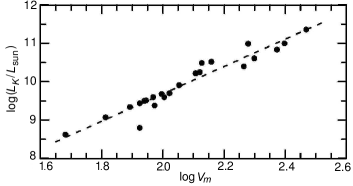
The Tully-Fisher diagram for 18 galaxies with individual -photometry from dal2000:Karachentsev_n is presented in the middle panel of Fig. 4. The regression line on it has the form
| (4) | ||||
with the variance of . The measurement errors of and are shown by the horizontal and vertical bars). The RMS errors of the luminosity and the rotation curve amplitude measurement for these galaxies are and , respectively. Given the slope of the regression line of this gives a total error of . Thus, the observed scatter of galaxies about the regression (4) is almost entirely conditioned by the and measurement errors. Taking into account the structural uniformity of UF galaxies, we can expect that their intrinsic (cosmic) variance in the Tully-Fisher diagram is extremely small, and the relation like (4) is suitable for a reliable determination of individual distances of UF galaxies.
We have applied relation (4) to determine the -luminosities of ultra-flat galaxies in Table 1 via in cases where the 2MASS survey data were not available.
As McGaugh has repeatedly brought to notice mcg2005:Karachentsev_n ; mcg2015:Karachentsev_n ,the relationship between the rotation curve amplitude and the total baryonic mass of the galaxy, has a more definite physical meaning. Taking into account the correction for the helium abundance, , and the ratio bel2003:Karachentsev_n we obtain the relation
| (5) |
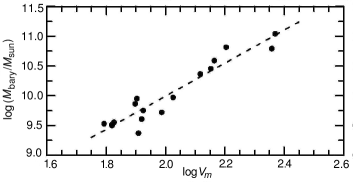
from which it follows that at the gaseous mass of a galaxy exceeds its stellar mass. Such objects constitute more than 40% both in Table 1 and Table 2. The baryonic version of the Tully-Fisher relation for UF galaxies from Table 2 is shown on the bottom panel of Fig. 4. The linear regression for them has the form
| (6) | ||||
with the variance . A flatter slope in relation (6) as compared with (3) and (4) is caused by a known fact that dwarf spirals contain much more gas per stellar mass unit than disks of high-luminosity galaxies.
normal \setcaptionmargin5mm
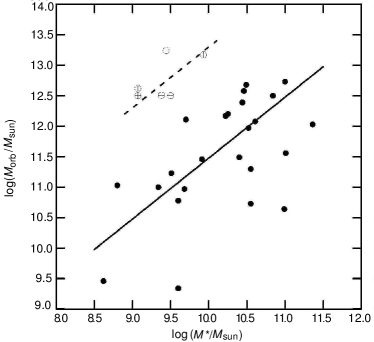
Table 3 gives a summary of different average characteristics of UF galaxies from the samples of Tables 1 and 2 with errors in mean. As follows from these data, the samples have approximately the same depth (), morphological structure, apparent axial ratio, rotation curve amplitude, -luminosity and color index (), corrected for Galactic extinction. Therefore, both samples may well be considered as taken from a single general population.
0mm \onelinecaptionstrue\captionstylenormal Parameter Galaxies Galaxies Table 2 Table 1 , km s-1 5100 620 5040 440 Type 6.72 0.14 6.23 0.23 12.77 0.63 11.90 0.28 10.90 0.51 10.52 0.25 , km s-1 114 12 129 13 9.76 0.15 10.03 0.13 3.33 0.16 3.54 0.13 3.02 0.20 3.23 0.18
normal \setcaptionmargin5mm
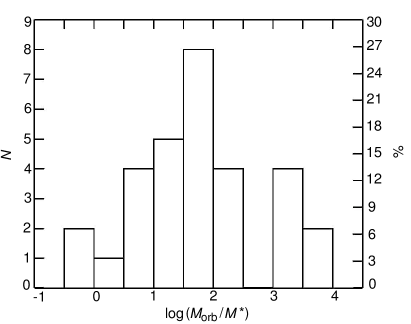
The distribution of 30 ‘‘UF galaxy + satellite’’ pairs by the orbital and stellar masses is represented in the logarithmic scale in Fig. 5 by circles. The distribution of their number by the ratio is shown in Fig. 6. In the range of values of there are six pairs, consisting of dwarf galaxies, the luminosity of which is fainter than that of the Large Magellanic Cloud. According to tul2006:Karachentsev_n such associations of dwarf galaxies are unbound systems with a formal virial-mass-to-stellar-mass ratio of approximately . The closest example of such a system is a dwarf quartet NGC 3109 + Sex A + Sex B + Antila. In Fig. 5 these six pairs are marked by light strikethrough symbols. For the other ‘‘UF galaxy + satellite’’ pairs there is a distinct tendency to follow the relation , found for the brightest spirals in nearby groups kar+kud2014:Karachentsev_n . The scatter in this diagram is to a large extend due to the projection effect.
In the presence in the sample of some admixtures of fictitious unbound pairs, the most robust estimate of the ratio is the median estimate, which amounts to or depending on the account or ignoring of 6 suspected unbound pairs.
Here we should note two factors that contribute to the reducing estimates. Determining , we have neglected the radial velocity errors. At the median difference in radial velocities of km s-1 and the median error of the difference of km s-1, an unbiased estimate of proves to be 15% smaller than that specified in Table 1.
Calculating the luminosity of ultra-thin galaxies, we have ignored the correction for the internal extinction in them. According to ver2001:Karachentsev_n this correction depends both on the axial ratio of the galaxy and the rotation curve amplitude:
| (7) |
At the given in Table 3 mean amplitudes of the rotation curve of – km s-1 and the average apparent axial ratios of –, the typical internal extinction in UF galaxies is – or –. Accounting for the internal extinction would on the average increase the stellar mass by about %. Taking into account both corrections, the median ratio of goes down to – in line with the typical ratio of for massive spirals in the nearby groups.
As follows from the data in Table 3, the average morphological type of UF galaxies on de Vaucouleurs scale for the two sub-samples is equal to . According to jar2003:Karachentsev_n , the average intrinsic color index of corresponds to this type. Comparing this value with the average value of in the penultimate line of Table 3, we get the average observed color excess in the UF galaxies due to internal absorption amounting to or the average internal extinction of . As we can see, the observed extinction in the disk of a typical ultra-flat galaxy proves to be about 2 times lower than the one of – expected from relation (7). This significant difference may indicate a scarcity of the dust component in the UF galaxies due to features of their evolution or an inapplicability of the Verheijen relation ver2001:Karachentsev_n to very thin disks of galaxies.
5 THE NEAREST ULTRA-FLAT GALAXY REPRESENTATIVES
Considering the cases of the nearest super-thin galaxies, we have the possibility to estimate in detail the features of the environment in which they reside. To this end, we have identified in the list kara2016:Karachentsev_n four UF galaxies with radial velocities relative to the centroid of the Local Group amounting to km s-1.
RFGC 1462 UGC 4704. This isolated Sdm type galaxy with the radial velocity of km s-1 and the apparent magnitude of has a close dwarf companion () at the projected separation of kpc with the velocity difference of km s-1. Apart from it, at a distance of kpc there is another dwarf companion () with the radial velocity difference of km s-1, which we have not included in Table 1 because of a large projected separation.
RFGC 1561 UGC 5047. This spiral Sdm-type galaxy with an apparent magnitude of and radial velocity of km s-1 has 17 neighbors within kpc in the range of radial velocities of km s-1. Some of the galaxies in the group are brighter than the UF galaxy itself, making the estimation of its mass by the orbital motions of its neighbors incorrect.
RFGC 1700 UGCA 193. A dwarf Sdm-type spiral with the radial velocity of km s-1 and the apparent magnitude of . It has 16 neighbors in the above range of and . This UF galaxy is a peripheral satellite of a massive S0 galaxy NGC 3115, located at a distance of Mpc.
RFGC 2246 UGC 7321. One of the thinnest Sd-type galaxies with the radial velocity of km s-1 and the apparent magnitude of thoroughly researched byMatthews matt1999:Karachentsev_n ; matt2000:Karachentsev_n ; matt2003a:Karachentsev_n ; matt2003b:Karachentsev_n . A subsystem of H II regions in it has a record high axial ratio of kar2015:Karachentsev_n . The galaxy is located on the far outskirts of the Virgo cluster at a distance of Mpc in a scattered group with other brighter members kar2011:Karachentsev_n .
RFGC 2937 ESO 274-01. This isolated Scd galaxy with the radial velocity of km s-1 and the apparent magnitude of is not included in the list of UF galaxies, since it is located on a low galactic latitude, . The ratio of the blue diameters of it is , but the ratio of red diameters , is a little smaller than the limit of we have adopted kara2016:Karachentsev_n . Nevertheless, this ‘‘almost UF’’ galaxy is interesting owing to its short distance Mpc, measured with high accuracy by the tip of the red giant branch kar2007:Karachentsev_n . At the projected separation of , or kpc from it a fainter Im-galaxy ESO 223-09 is located; the difference in their radial velocities amounts to km s-1. By the criterion we have adopted, this galaxy should be regarded as a physical companion of RFGC 2937. However, the distance to ESO 223-09 Mpc, also measured by the red giant branch kar2007:Karachentsev_n , points to an accidental optical proximity of these galaxies separated by a spatial distance of Mpc. The presence of such a flat galaxy in a sphere with the radius of just Mpc around the Milky Way may be indicative of a significant abundance of thin disk galaxies in the local universe.
6 FINAL REMARKS
The study of the properties of edge-on ultra-thin spiral galaxies has not yet gained a required systematic character. Selected UF galaxies were observed by different authors in the optical and radio domains mat2000:Karachentsev_n ; huc2005:Karachentsev_n ; mak1999:Karachentsev_n ; mak2001:Karachentsev_n ; dal2000:Karachentsev_n ; kre2004:Karachentsev_n . It has been suggested in ban2013:Karachentsev_n that the extreme flatness of UF galaxies is caused by a specific structure of their dark halo, in particular, a high halo-mass-to-stellar-disk-mass ratio. However, the first estimates of the ratio that we have presented for ultra-thin galaxies based on the kinematics of their satellites do not differ significantly from the typical value of for the brightest spirals like M 31, M 81 in the nearby groups. Note that the isolated spiral and elliptical galaxies from the 2MIG catalog have approximately the same ratios kara2011:Karachentsev_n . These galaxies are located in the low density regions, residing often in diffuse filaments and clouds. To refine in ultra-thin galaxies, a systematic search for new dwarf satellites around them with radial velocity measurements both in the H I line, similar to the AGES survey min2010:Karachentsev_n , and in the optical spectra is required. As noted above, the UF galaxy satellites are predominantly dwarf BCD and Im-galaxies, rich in gas and young stars, which makes them convenient objects for measuring the radial velocity. The list of 817 ultra-flat galaxies we have presented in kara2016:Karachentsev_n is a good basis for such a program.
Acknowledgements.
In our work we used the NED and HyperLeda databases. IDK thanks the Russian Science Foundation for the support (grant No. 14–02–00965).References
- (1) I. Karachentsev, Astronom. J.97, 1566 (1989).
- (2) S. J. Kautsch, Publ. Astronom. Soc. Pacific121, 1297 (2009).
- (3) X. Shao, K. Disseau, Y. B. Yang, et al., Astronom. and Astrophys.579, A57 (2015).
- (4) L. D. Matthews and W. van Driel, Astronom. and Astrophys. Suppl. Ser.143, 421 (2000).
- (5) I. D. Karachentsev, S. N. Mitronova, V. E. Karachentseva, et al., Astronom. and Astrophys.396, 431 (2002).
- (6) S. J. Kautsch, J. S. Gallagher, and E. K. Grebel, Astronomische Nachrichten 330, 1056 (2009).
- (7) M. Kregel, P. C. van der Kruit, and K. C. Freeman, Monthly Notices Roy. Astronom. Soc.358, 503 (2005).
- (8) J. W. Goad and M. S. Roberts, Astrophys. J. 250, 79 (1981).
- (9) J. Kormendy, Secular Evolution in Disk Galaxies (2013), p. 1.
- (10) S. Sachdeva, D. A. Gadotti, K. Saha, and H. P. Singh, Monthly Notices Roy. Astronom. Soc.451, 2 (2015).
- (11) V. E. Karachentseva, Y. N. Kudrya, I. D. Karachentsev, et al., Astrophysical Bulletin71, 1 (2016).
- (12) I. D. Karachentsev, V. E. Karachentseva, Y. N. Kudrya, et al., Bull. Spec. Astrophys. Obs.47 (1999).
- (13) I. D. Karachentsev, E. I. Kaisina, and D. I. Makarov, Astronom. J.147, 13 (2014).
- (14) I. D. Karachentsev and Y. N. Kudrya, Astronomische Naschrichten 336, 409 (2015).
- (15) I. D. Karachentsev and Y. N. Kudrya, Astronom. J.148, 50 (2014).
- (16) T. H. Jarrett, T. Chester, R. Cutri, et al., Astronom. J.119, 2498 (2000).
- (17) T. H. Jarrett, T. Chester, R. Cutri, et al., Astronom. J.125, 525 (2003).
- (18) I. D. Karachentsev, Dvojnye galaktiki (Double galaxies). (1987).
- (19) J. Binney and M. Merrifield, Galactic Astronomy (1998).
- (20) D. J. Schlegel, D. P. Finkbeiner, and M. Davis, Astrophys. J. 500, 525 (1998).
- (21) J. Heidmann, N. Heidmann, and G. de Vaucouleurs, Mem. R. Astr. Soc. 75, 85 (1972).
- (22) Y. N. Kudrya, I. D. Karachentsev, V. E. Karachentseva, and S. L. Parnovskii, Astron.Lett. 20, 8 (1994).
- (23) Y. N. Kudrya, V. E. Karachentseva, and I. D. Karachentsev, Astron.Lett. 23, 633 (1997).
- (24) E. F. Bell, D. H. McIntosh, N. Katz, and M. D. Weinberg, Astrophys. J. Suppl.149, 289 (2003).
- (25) R. B. Tully and J. R. Fisher, Astronom. and Astrophys.54, 661 (1977).
- (26) J. J. Dalcanton and R. A. Bernstein, Astronom. J.120, 203 (2000).
- (27) S. S. McGaugh, Astrophys. J. 632, 859 (2005).
- (28) S. S. McGaugh and J. M. Schombert, Astrophys. J. 802, 18 (2015).
- (29) R. B. Tully, L. Rizzi, A. E. Dolphin, et al., Astronom. J.132, 729 (2006).
- (30) M. A. W. Verheijen, Astrophys. J. 563, 694 (2001).
- (31) L. D. Matthews, J. S. Gallaher, and W. van Driel, Astronom. J.118, 2751(1999).
- (32) L. D. Matthews, Astronom. J.120, 1764 (2000).
- (33) J. M. Uson and L. D. Matthews, Astronom. J.125, 2455 (2003).
- (34) L. D. Matthews and K. Wood, Astrophys. J. 593, 721 (2003).
- (35) I. D. Karachentsev, S. S. Kaisin, and E. I. Kaisina, Astrophysics 58, 453 (2015).
- (36) I. D. Karachentsev, O. G. Nasonova, and H. M. Courtois, Astrophys. J. 743, 123 (2011).
- (37) I. D. Karachentsev, R. B. Tully, A. Dolphin, et al., Astronom. J.133, 504 (2007).
- (38) W. K. Huchtmeier, I. D. Karachentsev, V. E. Karachentseva, et al., Astronom. and Astrophys.435, 459 (2005).
- (39) D. I. Makarov, A. N. Burenkov, and N. V. Tyurina, Astron.Lett. 25, 706 (1999).
- (40) D. I. Makarov, A. N. Burenkov, and N. V. Tyurina, Astron.Lett. 27, 213 (2001).
- (41) M. Kregel, P. C. van der Kruit, and W. J. G. de Blok, Monthly Notices Roy. Astronom. Soc.352, 768 (2004).
- (42) A. Banerjee and C. J. Jog, Monthly Notices Roy. Astronom. Soc.431, 582 (2013).
- (43) V. E. Karachentseva, I. D. Karachentsev, and O. V. Melnyk, Astrophysical Bulletin66, 389 (2011).
- (44) R. F. Minchin, E. Momjian, R. Auld, et al., Astronom. J.140, 1093 (2010).