HII Region Ionization of the Interstellar Medium:
A Case Study of NGC 7538
Abstract
Using data from the Green Bank Telescope, we analyze the radio continuum (free-free) and radio recombination line (RRL) emission of the compact H II region NGC 7538 (Sharpless 158). We detect extended radio continuum and hydrogen RRL emission beyond the photodissociation region (PDR) toward the north and east, but a sharp decrease in emission toward the south and west. This indicates that a non-uniform PDR morphology is affecting the amount of radiation “leaking” through the PDR. The strongest carbon RRL emission is found in the western PDR that appears to be dense. We compute a leaking fraction % of the radio continuum emission measured in the plane of the sky which represents a lower limit when accounting for the three-dimensional geometry of the region. We detect an average abundance ratio by number of inside the H II region and a decrease in this ratio with increasing distance from the region beyond the PDR. Using Herschel Space Observatory data, we show that small dust temperature enhancements to the north and east of NGC 7538 coincide with extended radio emission, but that the dust temperature enhancements are mostly contained within a second PDR to the east. Unlike the giant H II region W43, the radiation leaking from NGC 7538 seems to only affect the local ambient medium. This suggests that giant H II regions may have a large effect in maintaining the ionization of the interstellar medium.
1 Introduction
Despite the fact that they are relatively rare, O-type stars have a large impact on the interstellar medium (ISM) at both large and small spatial scales. Their ultra-violet (UV) photons propagate through molecular clouds, dissociating molecules and ionizing the gas. Due to their intense radiation fields, O stars are surrounded by H II regions of ionized plasma (see Hoglund & Mezger, 1965; Mezger et al., 1967). At the interface between the fully ionized H II region and the neutral medium surrounding it there is a photo-dissociation region (PDR). The ionized gas within H II regions can be studied using radio recombination line (RRL) and radio free-free continuum emission, which have the benefit of being essentially free from the effects of extinction, whereas their PDRs can be studied using numerous molecular or atomic transitions.
The ISM of galaxies like the Milky Way contains low-density (0.1 cm-3) diffuse ionized gas known as the “warm interstellar medium” (WIM), first proposed by Hoyle & Ellis (1963). The WIM is a major, widespread component of the ISM, with a scale height of 1500 and temperatures between 6,000 and 10,000 (Reynolds, 1989; Haffner et al., 2009). Optical emission line measurements have shown that the WIM is in a lower ionization state and is ionized by a softer radiation field compared to gas in H II regions (Madsen et al., 2006). The “extended low-density medium” (ELDM; see Gottesman & Gordon, 1970; Mezger, 1978) is occasionally cited as another diffuse ionized component of the ISM, with a smaller scale height of 100 and a density of 1 to 10 cm-3. The distribution of the ELDM was found to be correlated with the location of H II regions (Alves et al., 2012).
It is still not completely understood how the WIM maintains its ionization (Haffner et al., 2009). While the radiation from supernovae can contribute, it cannot provide the total energy required (Hoopes & Walterbos, 2003). The most likely source of ionizing photons is O-type stars (Domgoergen & Mathis, 1994; Madsen et al., 2006), but it is unclear precisely how radiation from the luminous O-type stars is able to propagate across the kiloparsec size-scales required given the distribution of the WIM. One suggestion is that superbubbles created by supernovae and stellar winds provide low-density regions for photons to traverse Galactic distances (see Cox & Smith, 1974; Dove et al., 2000; Reynolds et al., 2001; Terebey et al., 2003; Dale et al., 2005). Another possibility is the existence of a two-component (Wood & Loeb, 2000) or fractal (Ciardi et al., 2002) ISM with a sufficient number of low-density paths.
If the O-type stars within H II regions are maintaining the ionization of the WIM, their radiation must either escape through their dense PDRs or their PDRs must be clumpy. In a clumpy PDR, photons could escape along low-density pathways in some directions and heat the ambient dust. For the Galactic H II region RCW 120, Anderson et al. (2010) found dust temperature enhancements that correlate with locations where the PDR shows discontinuities at m, which suggests that for this region radiation is leaking through such small-scale (0.3 pc) inhomogeneities in the PDR. This result was supported by CO observations by Anderson et al. (2015), who determined that these holes are spatially correlated with deficits in CO emission at distinct molecular velocities. They further noted that 5 % of the H emission of RCW 120 (as measured in the plane of the sky) is found directly outside these holes and that overall RCW 120 is leaking % of its emission beyond its PDR. Extended radio continuum and RRL emission has also been observed by Kim & Koo (2001) around ultracompact H II regions. They argue that these extended emission envelopes are mostly due to ionizing radiation from the exciting star of the compact region.
In a survey of 117 H II regions with multiple hydrogen RRL velocities, Anderson et al. (2015b) found that most multiple-velocity regions are clustered near large star-forming complexes in the inner Galaxy. They posited that the additional velocity components are caused by diffuse ionized gas along the line of sight, perhaps due to photons from these large complexes leaking into the ISM. Observations in Anderson et al. (2011) support this hypothesis, as they found that for multiple-velocity H II regions near W43, the strength of the diffuse velocity component decreases with increasing projected distance from the central position of W43. This suggests that leaking photons from W43 may be a major contributor to the WIM in these directions.
The main goal of the present study is to understand how a single H II region may contribute to the diffuse ionized gas detected by Anderson et al. (2011). While the Anderson et al. (2015b) study suggests a link between H II regions and diffuse ionized gas, additional research on individual regions is required. The region W43 is at the tip of the Galactic bar, along a very complicated sight line, so the relationship between the diffuse ionized gas and H II regions is still not clear.
Numerous studies of external galaxies indicate that a significant amount of ionizing radiation may leak from H II regions. Averaged over the entire NGC 157 galaxy, Zurita et al. (2002) found that 30 % of the emitted ionizing photons escape from H II regions based on their H emission model. Though this escape fraction by itself may not be sufficiently large to account for the total luminosity of the diffuse ionized gas, they suggested that almost all ionizing radiation escapes from the highest luminosity H II regions. As a result, the ionization of the diffuse gas could be maintained even with a much lower escape fraction of less luminous regions (see Zurita et al., 2000). Oey & Kennicutt (1997) compared the estimated stellar Lyman continuum flux to the H luminosities of the H II regions for the Large Magellanic Cloud. They estimated that up to 50 % of ionizing radiation escapes the nebulae. Pellegrini et al. (2012) used photoionization models of optically thin H II regions. They calculated a lower limit on the ionizing escape fraction of 42 % for the Large Magellanic Cloud and 40 % for the Small Magellanic Cloud. Giammanco et al. (2005) showed that models with optically thick clumps within the H II region are generally in better agreement with observations than models that allow photon transmission through optically thin clumps. They further found photon escape fractions of 30 % – 50 % for M51 and 60 % for M101.
The spectrum of the stellar radiation field outside an H II region PDR differs from that inside as some of the leaked photons undergo absorption and re-emission processes in the local ISM. Though these processes can be complex, a hardening in the H-ionizing continuum and a suppression of He-ionizing photons has been observed (Wood & Mathis, 2004). As there will be fewer photons with enough energy to ionize He compared to H outside the H II region, the observed ionic abundance ratio should thus be lower than it is inside (see Roshi et al., 2012). As well as photons being absorbed by the gas around H II regions, part of the radiation field is attenuated by interstellar dust. This becomes particularly important in PDRs, as they can absorb UV photons from the central source and re-emit them in the infrared (Hollenbach & Tielens, 1997a). Knowledge of the dust properties in and around the PDR can provide further understanding of the radiative transfer effects in these regions (see Compi egne et al., 2008).
 |
 |
Here we use radio observations of the H II region NGC 7538 as a case study to understand the role that leaking UV radiation from H II regions may have in creating the diffuse ionized gas detected by Anderson et al. (2011), and to better understand the connection between this diffuse ionized gas in the vicinity of H II regions and the WIM. NGC 7538 is located in the Perseus spiral arm at a distance of 2.65 (see Moscadelli et al., 2009) and is therefore close enough for detailed study. It lies in the Outer Galaxy where there is less confusion along the line of sight. We describe the radio continuum and RRL observations in Section 2 of this paper. We derive an estimate of the location of the PDR boundary, determine the percentage of leaking emission, and analyze the properties of ionized gas outside the PDR in Section 3. We discuss these results in Section 4 and conclude in Section 5.
2 Observations
We observed NGC 7538 in radio continuum and RRL emission at X-band (9 GHz; 3 cm) using the National Radio Astronomy Observatory Green Bank Telescope (NRAO GBT) from February 2013 to March 2014. For both the continuum and line data, we assume that the noise diodes, fired during data acquisition, provide accurate intensities at the 10 % level. We verified the flux density calibration of 3C147 in a nearly concurrent program in November 2012 that used the same instrumental configuration (Anderson et al., 2015a) and found agreement with Peng et al. (2000) to within 10 %. Throughout, we use a GBT X-band gain of 2 K Jy-1 to convert from antenna temperature to flux density (Ghigo et al., 2001).
2.1 Radio Continuum
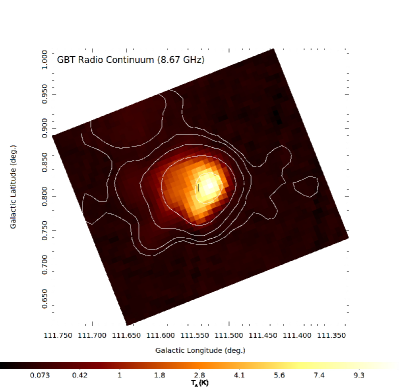
We mapped the radio continuum emission from a 40′ square region centered at (, ) = (111.544 ∘, 0.813 ∘) or (J2000 R.A., decl.) = (23:13:40, 61:30:13) using the Digital Continuum Receiver (DCR) on the GBT. Our central position for NGC 7538 corresponds to the 12 m Wide-Field Infrared Survey Explorer catalog (WISE; see Wright et al., 2010). The observations were done at 8665 with a bandwidth of 320 in two orthogonal polarizations (left and right circular). Radio continuum emission from H II regions at this frequency is caused by free-free emission. We slewed the telescope at a rate of 60 ′ min-1, while sampling the total power every 100 ms. We took data by scanning in Galactic longitude and Galactic latitude, and created maps by averaging the two directions and polarizations to minimize in-scan artifacts.
We show the radio continuum image in Figure 1. Here, all references to east or west refer to increasing or decreasing Galactic Longitude, respectively, and references to north or south refer to increasing or decreasing Galactic Latitude. Most of the emission is peaked slightly west of the central location, but there is extended emission toward the east that appears in two lobes. There is also faint extended emission toward the north, but little toward the south and west.
 |
 |
 |
 |
 |
 |
 |
 |
 |
 |
 |
 |
 |
 |
 |
 |
2.2 Radio Recombination Lines
We made RRL observations using the AutoCorrelation Spectrometer (ACS) on the GBT using our standard techniques (Bania et al., 2010; Balser et al., 2011; Anderson et al., 2011). We employed position switching with On– and Off–source integrations of 6 minutes per scan. The Off–source scans tracked the same azimuth and zenith angle path as the On–source scans and were observed offset 6.5 minutes in right ascension. We simultaneously measured 7 Hn RRL transitions, H87 to H93 (at rest frequencies of 9812.0, 9505.0, 9183.0, 8877.0, 8584.8, 8300.0, and 8045.6), in two orthogonal polarizations. Each observation therefore resulted in 14 independent spectra. Each spectrum spans 50 and is sampled by 4096 channels, for a spectral resolution of 0.4 per channel. The GBT HPBW at these frequencies ranges from 73′′ to 90′′. We take the average of 82′′ for all further RRL data analyses.
| Source | PDRaa “out” = outside the PDR, “on” = on the PDR, “in” = inside the PDR. | Line | rms | |||||||||
|---|---|---|---|---|---|---|---|---|---|---|---|---|
| (deg.) | (deg.) | (mK) | (mK) | (km s-1) | (km s-1) | (km s-1) | (km s-1) | (mK) | (min) | |||
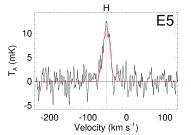
| E5 | 111.649 | 0.813 | out | H | 11.6 | 0.3 | 20.8 | 0.6 | 52.3 | 0.3 | 1.6 | 24 |
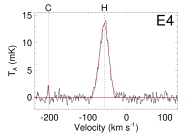
| E4 | 111.627 | 0.813 | out | H | 13.3 | 0.1 | 28.2 | 0.3 | 58.4 | 0.1 | 0.6 | 216 |
| C | 2.3 | 0.2 | 3.4 | 0.4 | 59.1 | 0.2 | ||||||
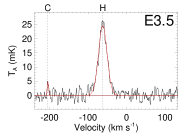
| E3.5 | 111.616 | 0.813 | out | H | 24.6 | 0.3 | 26.3 | 0.3 | 61.9 | 0.1 | 1.5 | 24 |
| C | 4.8 | 0.5 | 4.2 | 0.5 | 55.1 | 0.2 | ||||||
| E3 | 111.605 | 0.813 | out | H | 44.9 | 0.3 | 25.0 | 0.2 | 60.9 | 0.1 | 1.5 | 24 |
| He | 6.1 | 0.3 | 16.8 | 1.1 | 59.7 | 0.4 | ||||||
| C | 7.5 | 0.6 | 4.5 | 0.4 | 56.5 | 0.2 | ||||||
| E2 | 111.582 | 0.813 | on | H | 165.0 | 0.4 | 25.8 | 0.1 | 58.1 | 0.1 | 2.4 | 12 |
| He | 18.8 | 0.4 | 18.7 | 0.4 | 58.2 | 0.2 | ||||||
| C | 6.6 | 0.7 | 5.5 | 0.7 | 59.3 | 0.3 | ||||||
| E1 | 111.559 | 0.813 | in | H | 199.5 | 1.0 | 33.1 | 0.2 | 57.2 | 0.1 | 1.9 | 12 |
| He | 19.2 | 0.4 | 31.5 | 0.9 | 56.9 | 0.3 | ||||||
| W1 | 111.530 | 0.813 | in | H | 930.8 | 1.6 | 28.4 | 0.1 | 60.6 | 0.1 | 3.3 | 12 |
| He | 95.0 | 0.8 | 24.5 | 0.3 | 60.8 | 0.1 | ||||||
| C | 8.9 | 0.5 | 6.4 | 0.5 | 57.4 | 0.2 | ||||||
| W2 | 111.507 | 0.813 | on | H | 181.2 | 0.6 | 24.6 | 0.1 | 61.1 | 0.1 | 2.0 | 12 |
| He | 21.7 | 0.4 | 18.6 | 0.4 | 61.5 | 0.2 | ||||||
| C | 19.0 | 0.5 | 6.8 | 0.2 | 58.7 | 0.1 | ||||||
| W3 | 111.484 | 0.813 | out | H | 3.3 | 0.3 | 34.1 | 3.0 | 60.8 | 1.3 | 1.6 | 24 |
| C | 5.2 | 0.8 | 2.6 | 0.5 | 59.8 | 0.2 | ||||||
| W4 | 111.461 | 0.813 | out | 1.4 | 24 | |||||||
| N2 | 111.544 | 0.896 | out | H | 3.0 | 0.2 | 27.2 | 1.9 | 57.1 | 0.8 | 1.4 | 36 |
| N1 | 111.544 | 0.873 | out | H | 16.5 | 0.4 | 30.5 | 0.9 | 64.0 | 0.3 | 0.9 | 12 |
| He | 3.1 | 0.3 | 32.8 | 4.6 | 65.1 | 1.6 | ||||||
| C | 111.544 | 0.813 | in | H | 506.7 | 2.2 | 31.3 | 0.2 | 58.2 | 0.1 | 3.3 | 12 |
| He | 50.8 | 0.8 | 26.7 | 0.5 | 57.2 | 0.2 | ||||||
| S1 | 111.544 | 0.752 | out | H | 3.6 | 0.2 | 24.7 | 1.9 | 59.7 | 0.8 | 1.5 | 24 |
| S2 | 111.544 | 0.730 | out | C | 5.8 | 0.5 | 4.4 | 0.4 | 53.4 | 0.2 | 2.4 | 12 |
| SE | 111.603 | 0.762 | out | H | 18.3 | 0.2 | 27.8 | 0.3 | 48.6 | 0.1 | 1.1 | 84 |
Note. — All uncertainties are 1.
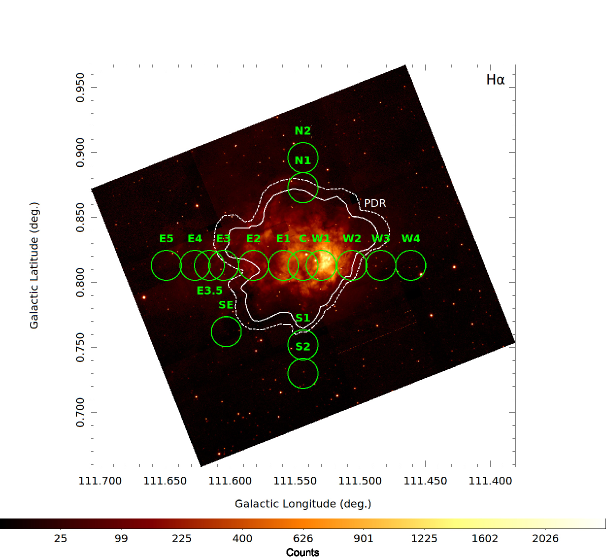
Figure 1 shows our GBT 8.7 radio continuum map of NGC 7538 overlaid with the positions of the RRL measurements. We observed a total of 16 positions, of which 15 are in a “cross” with arms of constant latitude and longitude to trace variations across the PDR boundaries. Eleven of the observed positions are on a line of constant Galactic Latitude, which we refer to as the East-West (EW) direction, and five positions are on a line of constant Galactic Longitude. The cross directions intersect at the central position at (, ) = (111.544 ∘, 0.813 ∘) or (J2000 R.A., decl.) = (23:13:39.8, 61:30:13). We observed one additional position offset to the south-east at (, ) = (111.603 ∘, 0.762 ∘) or (J2000 R.A., decl.) = (23:14:16.5, 61:28:40). Based on our definition of the location of the PDR boundary of NGC 7538 (see Section 3.1), most of the observed positions are outside the PDR, with only three positions located within the PDR and two on the PDR.
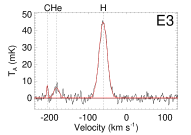
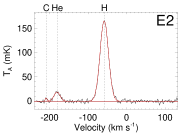
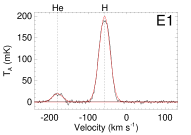
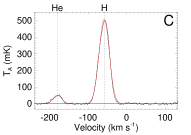
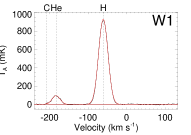
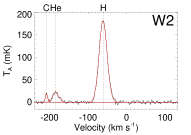
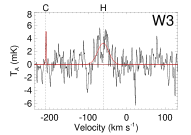
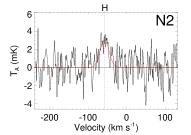
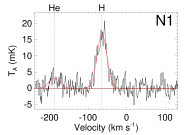
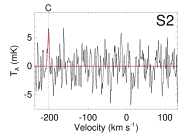
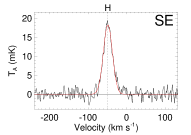
We reduce and analyze the data in TMBIDL111V7.1, see https://github.com/tvwenger/tmbidl.git. (Bania et al., 2014). For each position we average all 14 spectra together to increase the RRL signal-to-noise ratio (see Balser, 2006) after first re-gridding to the velocity resolution of the H87 data (which has the poorest resolution) and shifting the spectra so they are aligned in velocity. When averaging, we use a weighting factor of , where is the integration time and is the system temperature. We smooth the resultant spectrum to a resolution of 1.86 and fit a third-order polynomial baseline. We fit Gaussian models to the H, He, and C profiles if their peak signal was two times the rms noise defined in a line-free portion of the spectrum. We thus derive the peak line heights, their full width at half maximum (FWHM) values, and LSR velocities for all detected H, He, and C components. In spectra with strong He lines, the carbon RRLs are often blended with He. This makes it difficult to fit both lines simultaneously. In these cases, we fit the He RRLs first, subtract the He Gaussian models, and then fit the C lines (see Quireza et al., 2006). In Figure 2, we show the RRL data and Gaussian fits from all observed positions.
Of the 16 positions observed, we detect a hydrogen line at 14 positions, a helium line at 7 positions, and a carbon line at 8 positions. We summarize the observations and RRL analysis in Table 1, which lists the source, the Galactic longitude and latitude, the location of the observed position with respect to the PDR based on our PDR definition in Section 3.1 (“on” for on the PDR, “in” for inside the PDR, “out” for outside the PDR), the line, the line intensity, the FWHM line width, the LSR velocity, the rms noise in the spectrum, and the total integration time for each position, including all corresponding uncertainties of the Gaussian fits.
3 Ionized Gas in and around NGC 7538
3.1 The PDR Boundary
If the origin of the WIM is linked to escaping ionizing photons from H II regions, we should detect a significant amount of radio continuum emission “leaking” through the PDR. In order to quantify this amount, we need to define the inner PDR boundary. Radio emission outside this boundary can then be classified as “leaked”, whereas emission inside the boundary can be associated with the H II region itself.
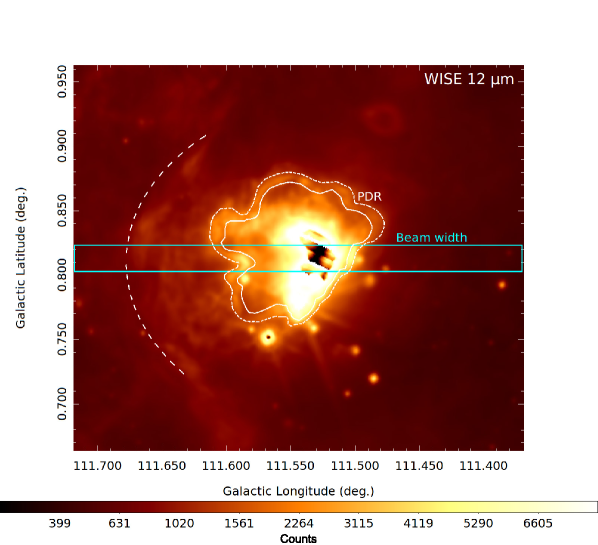
We use the 12 µm WISE map shown in Figure 3 to define inner and outer PDR boundaries. Within the 12 µm band is strong emission from a polycyclic aromatic hydrocarbon (PAH; e.g. Hollenbach & Tielens, 1997b). This emission occurs in PDRs of H II regions, allowing us to use the image to estimate the PDR extent. Following the enhanced 12 µm intensity, we trace by hand the inner and outer PDR boundaries around the region. While the PDR to the north and east of the region is bright and well-defined at 12 µm, the sharp decrease in intensity to the south-west makes a clear distinction from the surrounding medium more difficult.
To test the plausibility of this PDR definition along the EW direction (the line of = 0.813 ∘), we convolve the WISE 12 µm data with a Gaussian of FWHM , the HPBW of the GBT at the frequency of the radio continuum data (Figure 4). This gives us a smoothed intensity distribution of the 12 µm emission along the EW direction that can easily be compared to the radio data. We assume that the center of the PDR can be identified from peaks in the WISE intensity, which are located at (, ) = (111.585 ∘, 0.813 ∘) and (, ) = (111.503 ∘, 0.813 ∘), respectively. We then fit a Gaussian to these peaks and define the width of the PDR as the FWHM of the fits, resulting in a total width of 0.012 ∘ for the eastern PDR boundary and 0.010 ∘ in the west. Due to the convolution with the GBT HPBW these widths may be broadened. This analysis agrees well with the visual definition (see Figure 4). PDRs, however, are characterized by a multitude of emission lines (Hollenbach & Tielens, 1997b). Using other emission lines to trace the PDR may shift its location and therefore our characterization of the PDR structure is by no means unique. Throughout the remainder of this work we use the visual definition of the PDR boundary defined in Figure 3.
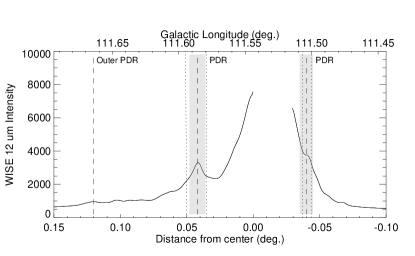
There is, however, a second PDR structure visible to the east in the WISE 12 µm data of Figure 3 (indicated by the dashed white curve). This second PDR may be an additional boundary that prevents photons from escaping great distances from the region. This second PDR is barely visible as a slight enhancement in Figure 4 at .
3.2 The Leaking Emission Fraction
Since extinction due to interstellar dust is negligible at 8.7, we can use the radio continuum intensity to estimate the percentage of emission escaping the inner PDR boundary of the region. To determine this percentage of leaked emission, or escape fraction, , from the radio data the intensity inside and outside the PDR boundary must be known. Assuming that the continuum emission is completely thermal and that the continuum background intensity is negligible, we sum the radio continuum map pixel values inside the visually-defined PDR boundary to find the radio continuum intensity of the H II region. We then estimate the total intensity (inside and outside the PDR boundary) by summing the pixel values from a circle of radius 0.13 ∘ centered at (, ) = (111.545 ∘, 0.813 ∘) as shown in Figure 1. A faint source of radio continuum emission is found to the north-eastern side of NGC 7538. We assume it is from a background radio source and manually subtract its contribution to the intensity by excluding the source from the outside aperture. Since the source is faint and the continuum background intensity is insignificant, we assume that the uncertainty associated with the source subtraction is negligible.
Using a gain of 2 K Jy-1, we derive the total flux densities inside and outside the PDR boundary of 17.3 Jy and 3.0 Jy, respectively, for 20.3 Jy total. Our flux density value for NGC 7538 itself (inside the PDR) is in rough agreement with those found by other authors. Gregory & Condon (1991) found a value of 15.5 Jy at 4.85 GHz and Becker et al. (1991) found 23.7 Jy at 4.85 .
We can calculate the expected flux density by making assumptions about the ionizing sources in NGC 7538. If two stars, O3V and O9V, are responsible for the observed emission (Puga et al., 2010), we estimate the number of emitted H-ionizing photons per second to be (see Martins et al., 2005). From this, we calculate the expected flux density using (see Rubin, 1968; Anderson, 2010)
| (1) |
where is the number of H-ionizing photons per second, is the integrated flux density at frequency , is the electron temperature of the region (see Section 3.5), and is the distance to NGC 7538. This yields an expected flux density of 60 Jy, about three times the measured value. There is, however, debate about the spectral classification of the ionizing sources in NGC 7538. Puga et al. (2010) identify the main source of H-ionizing photons as a O3V star, whereas Ojha et al. (2004) classify it as a O5V star. Following the classification of Ojha et al. (2004), we would get an estimated of 22.4 Jy, much closer to the measured value of 20.3 Jy. Moreover, part of the radiation field may be absorbed by dust grains within the ionized region (see Arthur et al., 2004) which would lower the observed flux density.
We calculate the escape fraction, %, from the ratio of the outside to total (inside plus outside) radio continuum flux density using the inner PDR boundary from Figure 1. Using the outer PDR as our boundary, decreases to 8 %. We estimate the uncertainty in from two contributions. We measure the effect of the uncertainty in the PDR location by shifting the PDR by half its thickness and recomputing . This gives a variation of 30 % in , which is the largest contribution to the total uncertainty. We also evaluate uncertainties in the flux measurements due to the noise in the radio continuum map (10 % contribution in ). The uncertainty in takes into account both effects, added in quadrature.
As an alternative method, we measure the 656 nm H escape fraction of NGC 7538 using the Isaac Newton Telescope Photometric H-Alpha Survey of the Northern Galactic Plane (IPHAS) shown in Figure 5 (Drew et al., 2005; Barentsen et al., 2014). The H IPHAS map has 80 times higher spatial resolution than the radio data. The disadvantages of using H is that extinction affects the results to an unknown degree and stellar subtraction in regions of bright H emission is difficult. We determine the leaking emission fraction, , using the same methods as for the radio continuum data (i.e., without performing stellar subtraction) and find %. The uncertainty includes the same contributions used for the radio data. These, added in quadrature, result in an estimated uncertainty of 5 %. Since the southern region of NGC 7538 shows less emission in H inside the PDR compared to the radio map, we assume the H data is affected by extinction here, which would artificially increase . To account for this, we add an additional 5 % uncertainty contribution estimated by measuring variations in the H to radio continuum intensity ratio.
Because of the rather large GBT beam compared to the size of the region, some of the radio continuum emission that appears outside the H II region PDR may actually be from inside the PDR. To investigate the magnitude of this effect, we smooth the H map with the GBT’s 87 ′′ beam. We find the same leaking fraction, %, indicating that the GBT beam size has not significantly affected our determination of .
Since NGC 7538 is observed in the plane of the sky, we cannot readily distinguish emission beyond the PDR along the line of sight from that within the PDR. This effect would artificially increase the amount of emission we associate with the H II region since “leaked” emission is superposed on top of the region itself. As a result, and represent lower limits on the total leaking emission fraction.
3.3 Ionic abundance ratio
We use our RRL measurements to characterize the state of the ionized gas inside and outside the PDR. Previous observational (Hoopes & Walterbos, 2003) and theoretical work (Wood & Mathis, 2004) shows that radiation escaping the H II region has a softer spectrum due to absorption and re-emission processes in the surrounding gas. This would indicate a decrease in the ionic abundance ratio by number outside the PDR. We derive using
| (2) |
where and are the line strengths of He and H, respectively, and and are the corresponding FWHM line widths (Peimbert et al., 1992). If He was not detected, we use upper limits of and to find . Here, the constant is the average line width ratio from our RRL data. This value is in agreement with Wenger et al. (2013), who found , averaged over 54 individual H II regions.
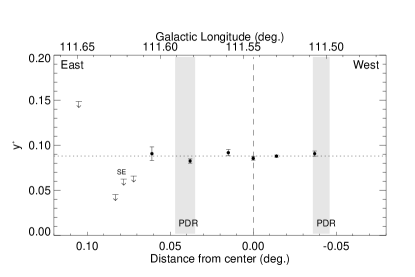
Results for the ionic abundance ratio, , electron temperatures (see Section 3.5), and dust temperatures (see Section 3.6) are summarized in Table 2. Listed are the Galactic longitude and latitude, the location of the observation with respect to the PDR (“on” for on the PDR, “in” for inside the PDR, “out” for outside the PDR), the ionic abundance ratio, the LTE electron temperature, and the estimated dust temperature (see next section). All uncertainties are . In Figure 6, we show along the EW direction. Though not located along the EW direction, we also include the source SE at (, ) = (111.603 ∘, 0.762 ∘) in the plot. This position is surrounded by a faint lobe of radio continuum emission outside the PDR similar to the eastern locations.
The ionic abundance ratio declines outside the PDR boundary but remains relatively constant inside. We find an average total ionic abundance ratio inside/on the PDR of . Directly outside the eastern PDR boundary at a distance of ∘ at position E3, is , and then decreases with increasing distance. The large upper limit at a distance of ∘ at position E5 is a result of the low signal-to-noise ratio of the observation and does not necessarily indicate an actual increase of . We estimate an upper limit on the average for all locations with He non-detections outside the PDR. The decline in with increasing distance suggests that the radiation field softens as the radiation passes through the PDR (Reynolds & Tufte, 1995; Hoopes & Walterbos, 2003; Wood & Mathis, 2004; Roshi et al., 2012). Since at position E3, which is directly outside our 12 m-defined PDR boundary, is comparable to that inside, it may indicate that the PDR extends slightly further to the east than our 12 m-definition.
3.4 Carbon RRLs
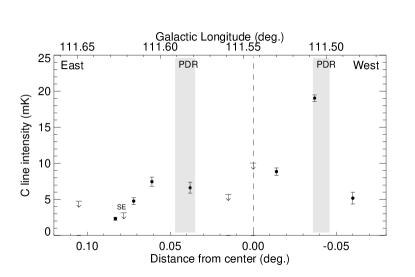
Carbon RRL emission is primarily observed in PDRs (see Hollenbach & Tielens, 1999). Because of its lower first ionization potential (11.2 eV), carbon can be ionized by softer radiation than H (13.6 eV) and He (24.6 eV). This softer radiation is better able to pass through the H II region and into the PDR surrounding it. Figure 7 shows the observed intensity of the carbon RRL, , along the EW direction, again including the position SE. If C was not detected, an upper limit defined by 3 times the observed rms is used. Here, we use the original spectral resolution of 1.86 as the typical C line profile is more narrow compared to H and He. As expected, we find the largest carbon RRL intensities near the PDR boundaries of the H II region.
The observed intensity of the line at position W2 on the western PDR is mK, which is two times higher than that detected at any other pointing. It is probably no coincidence that the W2 position falls on the PDR. We hypothesize that this PDR is dense and is absorbing the C-ionizing photons. Position E2 on the weaker eastern PDR also has a detected carbon line, although only at an intensity of mK, comparable to values found both inside and outside the H II region.
| Source | PDRaa “out” … outside the PDR, “on” … on the PDR, “in” … inside the PDR. | |||||||
|---|---|---|---|---|---|---|---|---|
| (deg.) | (deg.) | (K) | (K) | (K) | ||||
| E5 | 111.649 | 0.813 | out | 0.149 | 20.6 | |||
| E4 | 111.627 | 0.813 | out | 0.045 | 20.6 | |||
| E3.5 | 111.616 | 0.813 | out | 0.066 | 20.5 | |||
| E3 | 111.605 | 0.813 | out | 0.091 | 0.008 | 10,550 | 180 | 19.3 |
| E2 | 111.582 | 0.813 | on | 0.083 | 0.002 | 8,330 | 50 | 21.8 |
| E1 | 111.559 | 0.813 | in | 0.092 | 0.003 | 8,250 | 60 | 22.8 |
| C | 111.544 | 0.813 | in | 0.086 | 0.002 | 7,890 | 50 | 23.9 |
| W1 | 111.530 | 0.813 | in | 0.088 | 0.001 | 7,520 | 20 | 26.4 |
| W2 | 111.507 | 0.813 | on | 0.091 | 0.003 | 9,440 | 60 | 25.8 |
| SE | 111.603 | 0.762 | out | 0.063 | 19.8 |
Note. — All uncertainties are 1.
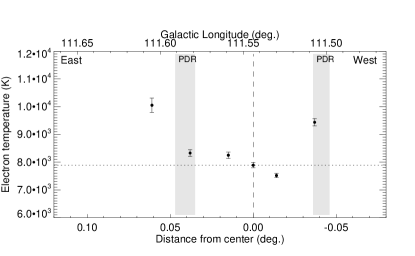
3.5 Electron Temperature
The electron temperature, , is an important physical parameter of H II regions that can be used to assess the efficiency of cooling processes. There is debate in the literature about the relationship between the electron temperature inside and outside the H II region PDR. While previous observations of H II regions have found a fairly homogeneous spatial distribution (see Roelfsema et al., 1992; Adler et al., 1996; Krabbe & Copetti, 2002; Rubin et al., 2003), an increase in scatter has been observed at the edges of NGC 346 (Oliveira et al., 2008). For the well-studied Orion nebula, the results are inconclusive, with optically-derived values of the same inside and outside the PDR (McCall, 1979) or different findings for different species (Walter, 1994; Weilbacher et al., 2015). Recently, Wilson et al. (2015) found a decrease in the radio-derived electron temperature with angular offset for Orion A.
We calculate the electron temperature assuming local thermal equilibrium (LTE) for all RRL positions where a He line could be detected, using
| (3) |
where GHz is the average frequency of our Hn recombination lines, is the continuum antenna temperature, is the H line antenna temperature, is the FWHM line width, and is the ionic abundance ratio found by Eq. 2 (see Quireza et al., 2006). We derive errors in by propagating errors in , , , and via Eq. 3. Here, the uncertainty of the continuum antenna temperature, , is due to random temperature fluctuations found by taking the rms of an Off-source location in the map close to NGC 7538. Uncertainties of all line parameters are based on the Gaussian fits used to characterize the line.
We show the derived electron temperature values as a function of distance from the central location in Figure 8. We find an average temperature of within the PDR of the region. The peak of the radio emission (position W1) has K. Our E3 position outside the PDR is much hotter with K, similar to the W2 position on the PDR ( K). The electron temperature at the E2 position that is also located on the PDR, however, is closer to the average value inside with K. It appears that remains roughly constant within the PDR but may increase outside the PDR boundary. Previous work at the same observing frequencies reports average electron temperatures for NGC 7538 of (Quireza et al., 2006) and (Balser et al., 2011) which are slightly higher than our results. This is likely due to uncertainties in the observed continuum antenna temperatures. Quireza et al. (2006) assigns a quality factor of “B” to the continuum data of NGC 7538, whereas Balser et al. (2011) gives a quality factor of only “C” (“A” is highest quality). Additionally, observations at slightly different locations may result in differences in the calculated electron temperatures. Quireza et al. (2006) observed at (, ) = (111.53 ∘, 0.82 ∘) and Balser et al. (2011) observed at (, ) = (111.525 ∘, 0.816 ∘). These positions are offset from our W1 position by 25′′ and 22′′, respectively.
3.6 Dust properties
Higher dust temperatures outside the PDR may be correlated with the locations along the PDR that have significant fractions of escaping radiation. Anderson et al. (2012) and Anderson et al. (2015) show that for the H II region RCW 120 the locations of dust temperature enhancements outside the PDR are correlated with “holes” in the PDR. These results indicate that radiation can escape through these holes to heat the ambient medium. This effect has yet to be investigated in detail for other H II regions, although it may be related to the extended radio continuum emission around ultra-compact H II regions observed by Kim & Koo (2001).
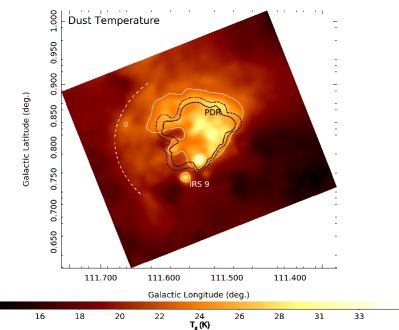
We use Herschel Space Observatory data at 160, 250, 350, and 500 µm from the HOBYS key-time program (Motte et al., 2010) to derive dust temperature and column density maps of NGC 7538. The HOBYS data of NGC 7538 were first shown in Fallscheer et al. (2013). Here we use a similar method to create these maps by fitting grey-body models pixel-by-pixel, after regridding to the common spatial resolution of the 350 µm data (see Anderson et al., 2012). In the fits we assume a dust emissivity index . We subtract an offset from all data at the position , as this location is relatively devoid of emission. To convert to column density, we assume a dust-to-gas ratio of 100, and an opacity .
 |
 |
We show the dust temperature map of NGC 7538 in Figure 9. The contour in the left panel of Figure 9 is at 23, as this temperature best highlights the features of the dust temperature distribution near the PDR. We see higher dust temperatures to the north and east of the PDR compared to the west and south, which may suggest that leaking radiation is heating the ambient material. Within the second PDR to the east (defined in Figure 3) we detect higher dust temperatures of 22 compared to 20 outside. This indicates that the second PDR is an additional barrier to the propagation of photons from the region further into the ISM. The point-like temperature enhancement to the south of the region is associated with the infrared source IRS 9 and is not related to dust heating by NGC 7538 itself.
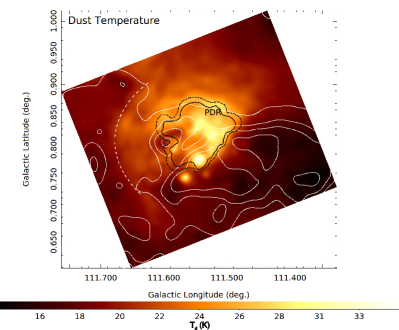
The contours in the right panel of Figure 9 are of column density. The dust temperature is higher in directions where the column density along the PDR is lower, namely toward the north and east. There is a small region of high column density on the eastern PDR. This region is presumably leading to the two “lobes” of radio emission seen in this direction (Figure 1). Toward the south and west there is high column density material along the PDR that is spatially correlated with lower dust temperatures.
4 Discussion
Studies of external galaxies suggest that % of the emitted hydrogen-ionizing photons escape from H II regions into the ISM (e.g. Oey & Kennicutt, 1997; Zurita et al., 2002; Giammanco et al., 2005; Pellegrini et al., 2012). In our Galaxy, however, information on radiation leaking from H II regions is sparse. Furthermore, Galactic studies are often contaminated by confusion since we reside in the Galactic plane (see Anderson et al., 2015b). Here we use the Outer Galaxy H II region NGC 7538 as a case study since there is less confusion along the line of sight to this source.
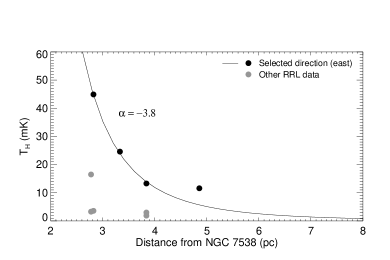
The detection of radio continuum and RRL emission outside the PDR of NGC 7538 hints that the ionizing photons from H II regions could be responsible for some of the diffuse RRL emission detected in the plane of the Galaxy (Anderson et al., 2011, 2015b). The intensity of this emission outside the PDR, however, decreases rapidly with increasing distance. To quantify this decrease, we fit a power law of the form to the H RRL intensity outside the PDR. Here, the model parameter is the antenna temperature value at a distance of 1 pc from the center of the region at (, ) = (111.544 ∘, 0.813 ∘), is the distance in pc from the center, and is the power law index. Since the antenna temperature on the PDR varies with direction, we have to fit each direction separately. We only fit RRL intensities towards the east of the region due to a lack of data points in the other directions. We find , indicating a very steep decrease with distance. These results are shown in the top panel of Figure 10.
We repeat this analysis for the complex W43 region (bottom panel of Figure 10) using RRL data from Anderson et al. (2015b) for which the emission has been identified as “diffuse” (i.e. not from within the PDR of a discrete H II region). These data were taken and reduced using the same methodology employed here and so are directly comparable to our data for NGC 7538. We use all RRL detections within 2 ∘ of W43 that have velocities between 80 and 120 and assume the maser parallax distance for W43 of 5.5 kpc (Zhang et al., 2014). We split our analysis into sectors of 10 ∘ opening angle around W43 and fit each separately. This allows us to detect spatial asymmetries of the diffuse emission around W43 similar to the analysis of NGC 7538 above. The power law fits range from to , with an average of , indicating that the decrease in diffuse RRL intensity for W43 is significantly less steep than that for NGC 7538. A representative power law fit (the 10 ∘ sector centered at 295 ∘ from Galactic north) for W43 is shown in Figure 10 for illustration purposes.
|
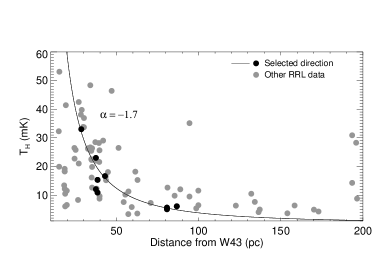 |
What would lead to the difference in power law indices? W43 is much more luminous than NGC 7538. Smith et al. (1978) list a flux density of 86.5 for W43 at 5 . Given their respective Heliocentric distances, and assuming that both regions are optically thin, this implies that W43 is 20 times more luminous than NGC 7538. Zurita et al. (2000) show that in a model suggested by Beckman et al. (2000), leaking radiation from very luminous H II regions is sufficient to ionize the diffuse gas. The model, based on a change in slope in H luminosity functions of H II regions, assumes that high luminosity H II regions are primarily density-bounded. This is consistent with their data on a sample of six spiral galaxies and would allow a large number of ionizing photons to escape into the surrounding medium. If the extended emission around W43 is due to W43 itself, the shallow power law may imply that this is the case here. As a result, a significant fraction of the leaked radiation would be able to ionize the diffuse gas. Along the W43 sight line, however, it is difficult to disentangle the possible contribution from the numerous H II regions. We therefore cannot be sure that all the diffuse radiation is due to W43 itself. Another model, proposed by Anantharamaiah (1986), suggests that the extended emission could be due to low-density envelopes of size 100 pc around individual compact H II regions. Due to the high population of H II regions around W43, our line of sight could cross many of these envelopes. Roshi & Anantharamaiah (2001) argue that this model is in good agreement with RRL observations at 327 MHz in the Galactic plane.
The steep power law of NGC 7538 shows the difficulty in detecting radio emission far from such compact H II regions. We see from Figure 10 that 5 pc from the center the fitted RRL intensity is just 5 . Furthermore, there is clearly a second PDR seen toward the east, visible at 12 µm in Figure 3. The zone interior to this second PDR has a higher dust temperature with a sharp boundary (see Figure 9). This implies that in this direction the radiation is leaking through the primary PDR. This radiation, however, is being further attenuated by the secondary PDR and is not truly escaping the region.
Our results cast doubt on whether compact H II regions like NGC 7538 can be responsible for the diffuse ionized gas detected in the inner Galaxy. Since this is a case study of only one such region, however, the broader implications are unclear. While giant H II region complexes such as W43 seem to leak a significant fraction of their ionizing radiation into the ISM, more study is required on individual regions. Larger H II regions in the Outer Galaxy such as W3/W4/W5 may be suitable targets for future observations as there is little confusion along the line of sight.
5 Summary
We observed the H II region NGC 7538 with the NRAO Green Bank Telescope (GBT) in 8.7 GHz continuum and recombination line emission to investigate the escape of radiation through the PDR into the local interstellar medium. This leaked radiation from H II regions could be an important source of photons that maintain the ionization of the WIM.
Using the radio continuum intensity, we estimate the leaked radiation fraction from NGC 7538. We first visually define the PDR using WISE 12 m infrared images and sum the pixel values of the radio continuum map inside and outside the PDR to find the total intensity of NGC 7538. We calculate a total intensity of 17.3 Jy inside the region which would roughly be expected from a single O5V star. Using the ratio of the outside to total radio continuum intensity, we compute the percentage of leaked emission, , to be % in the plane of the sky. We also use H data from IPHAS to repeat the calculation and find %. Due to the three-dimensional geometry of the region, these numbers represent lower limits on the total leaked emission.
The leaking radiation is not found everywhere around the region, but rather is mostly in the north and east. These are also the directions where we identify dust temperature enhancements, and locations along the PDR of decreased column density. This shows how, due to a non-uniform PDR, radiation can escape the region in some directions to heat the ambient medium while it is confined in other directions.
RRL measurements of NGC 7538 are consistent with a decrease in the ionic abundance number ratio with increasing distance outside the PDR and an increased carbon line emission in the PDR, suggesting a softening of the radiation field. We compute an average LTE electron temperature of K inside the region, which is marginally lower than that derived in previous work (Balser et al., 1999; Quireza et al., 2006).
The RRL intensity from NGC 7538 decreases rapidly outside the PDR. This decrease is much steeper than that seen for the high mass star formation complex W43. Furthermore, the existence of an additional PDR boundary further from NGC 7538 implies that the “leaked” emission is not able to traverse large distances. This seems to imply that maintaining the WIM might rather be caused by giant H II region complexes regions such as W43 than “normal” compact H II regions like NGC 7538.
References
- Adler et al. (1996) Adler, D. S., Wood, D. O. S., & Goss, W. M. 1996, ApJ, 471, 871
- Alves et al. (2012) Alves, M. I. R., Davies, R. D., Dickinson, C., et al. 2012, MNRAS, 422, 2429
- Anantharamaiah (1986) Anantharamaiah, K. R. 1986, JApA, 7, 131
- Anderson (2010) Anderson, L. D. 2010, PhD thesis, Boston University
- Anderson et al. (2015a) Anderson, L. D., Armentrout, W. P., Johnstone, B. M., et al. 2015a, ApJS, 221, 26
- Anderson et al. (2011) Anderson, L. D., Bania, T. M., Balser, D. S., & Rood, R. T. 2011, ApJS, 194, 32
- Anderson et al. (2015b) Anderson, L. D., Hough, L. A., Wenger, T. V., Bania, T. M., & Balser, D. S. 2015b, ApJ, 810, 42
- Anderson et al. (2010) Anderson, L. D., Zavagno, A., Rodón, J. A., et al. 2010, A&A, 518, L99
- Anderson et al. (2012) Anderson, L. D., Zavagno, A., Deharveng, L., et al. 2012, A&A, 542, 27
- Anderson et al. (2015) Anderson, L. D., Deharveng, L., Zavagno, A., et al. 2015, ApJ, 800, 101
- Arthur et al. (2004) Arthur, S. J., Kurtz, S. E., Franco, J., & Albarrán, M. Y. 2004, ApJ, 608, 282
- Balser (2006) Balser, D. S. 2006, AJ, 132, 2326
- Balser et al. (1999) Balser, D. S., Bania, T. M., Rood, R. T., & Wilson, T. L. 1999, ApJ, 510, 759
- Balser et al. (2011) Balser, D. S., Rood, R. T., Bania, T. M., & Anderson, L. D. 2011, ApJ, 738, 27
- Bania et al. (2014) Bania, T., Wenger, T., Balser, D., & Anderson, L. 2014, tmbidl: TMBIDL v7.1, Zenodo, 10.5281/zenodo.32790
- Bania et al. (2010) Bania, T. M., Anderson, L. D., Balser, D. S., & Rood, R. T. 2010, ApJL, 718, L106
- Barentsen et al. (2014) Barentsen, G., Farnhill, H. J., Drew, J. E., et al. 2014, MNRAS, 444, 3230
- Becker et al. (1991) Becker, R. H., White, R. L., & Edwards, A. L. 1991, ApJS, 75, 1
- Beckman et al. (2000) Beckman, J. E., Rozas, M., Zurita, A., Watson, R. A., & Knapen, J. H. 2000, AJ, 119, 2728
- Ciardi et al. (2002) Ciardi, B., Bianchi, S., & Ferrara, A. 2002, MNRAS, 331, 463
- Compi egne et al. (2008) Compi egne, M., Abergel, A., Verstraete, L., & Habart, E. 2008, A&A, 491, 797
- Cox & Smith (1974) Cox, D. P., & Smith, B. W. 1974, ApJL, 189, L105
- Dale et al. (2005) Dale, J. E., Bonnell, I. A., Clarke, C. J., & Bate, M. R. 2005, MNRAS, 358, 291
- Domgoergen & Mathis (1994) Domgoergen, H., & Mathis, J. S. 1994, ApJ, 428, 647
- Dove et al. (2000) Dove, J. B., Shull, J. M., & Ferrara, A. 2000, ApJ, 531, 846
- Drew et al. (2005) Drew, J. E., Greimel, R., Irwin, M. J., et al. 2005, MNRAS, 362, 753
- Fallscheer et al. (2013) Fallscheer, C., Reid, M. A., Di Francesco, J., et al. 2013, ApJ, 773, 102
- Ghigo et al. (2001) Ghigo, F., Maddalena, R., Balser, D., & Langston, G. 2001, GBT Commisioning Memo 10
- Giammanco et al. (2005) Giammanco, C., Beckman, J. E., & Cedrés, B. 2005, A&A, 438, 599
- Gottesman & Gordon (1970) Gottesman, S. T., & Gordon, M. A. 1970, ApJL, 162, L93
- Gregory & Condon (1991) Gregory, P. C., & Condon, J. J. 1991, ApJS, 75, 1011
- Haffner et al. (2009) Haffner, L. M., Dettmar, R.-J., Beckman, J. E., et al. 2009, RvMP, 81, 969
- Hoglund & Mezger (1965) Hoglund, B., & Mezger, P. G. 1965, Science, 150, 339
- Hollenbach & Tielens (1997a) Hollenbach, D. J., & Tielens, A. G. G. M. 1997a, ARA&A, 35, 179
- Hollenbach & Tielens (1997b) —. 1997b, ARA&A, 35, 179
- Hollenbach & Tielens (1999) Hollenbach, D. J., & Tielens, A. G. G. M. 1999, RvMP, 71, 173
- Hoopes & Walterbos (2003) Hoopes, C. G., & Walterbos, R. A. M. 2003, ApJ, 586, 902
- Hoyle & Ellis (1963) Hoyle, F., & Ellis, G. R. A. 1963, AJP, 16, 1
- Kim & Koo (2001) Kim, K.-T., & Koo, B.-C. 2001, ApJ, 549, 979
- Krabbe & Copetti (2002) Krabbe, A. C., & Copetti, M. V. F. 2002, A&A, 387, 295
- Madsen et al. (2006) Madsen, G. J., Reynolds, R. J., & Haffner, L. M. 2006, ApJ, 652, 401
- Martins et al. (2005) Martins, F., Schaerer, D., & Hillier, D. J. 2005, A&A, 436, 1049
- McCall (1979) McCall, M. L. 1979, ApJ, 229, 962
- Mezger (1978) Mezger, P. G. 1978, A&A, 70, 565
- Mezger et al. (1967) Mezger, P. G., Burke, B. F., Reifenstein, III, E. C., & Wilson, T. L. 1967, AJ, 72, 817
- Moscadelli et al. (2009) Moscadelli, L., Reid, M. J., Menten, K. M., et al. 2009, ApJ, 693, 406
- Motte et al. (2010) Motte, F., Zavagno, A., Bontemps, S., et al. 2010, A&A, 518, L77
- Oey & Kennicutt (1997) Oey, M. S., & Kennicutt, R. C. J. 1997, MNRAS, 291, 827
- Ojha et al. (2004) Ojha, D. K., Tamura, M., Nakajima, Y., et al. 2004, ApJ, 616, 1042
- Oliveira et al. (2008) Oliveira, V. A., Copetti, M. V. F., & Krabbe, A. C. 2008, A&A, 492, 463
- Peimbert et al. (1992) Peimbert, M., Rodriguez, L. F., Bania, T. M., Rood, R. T., & Wilson, T. L. 1992, ApJ, 395, 484
- Pellegrini et al. (2012) Pellegrini, E. W., Oey, M. S., Winkler, P. F., et al. 2012, ApJ, 755, 40
- Peng et al. (2000) Peng, B., Kraus, A., Krichbaum, T. P., & Witzel, A. 2000, A&AS, 145, 1
- Puga et al. (2010) Puga, E., Mar n-Franch, A., Najarro, F., et al. 2010, A&A, 517, A2
- Quireza et al. (2006) Quireza, C., Rood, R. T., Balser, D. S., & Bania, T. M. 2006, ApJS, 165, 338
- Quireza et al. (2006) Quireza, C., Rood, R. T., Bania, T. M., Balser, D. S., & Maciel, W. J. 2006, ApJ, 653, 1226
- Reynolds (1989) Reynolds, R. J. 1989, ApJL, 339, L29
- Reynolds et al. (2001) Reynolds, R. J., Sterling, N. C., & Haffner, L. M. 2001, ApJL, 558, L101
- Reynolds & Tufte (1995) Reynolds, R. J., & Tufte, S. L. 1995, ApJL, 439, L17
- Roelfsema et al. (1992) Roelfsema, P. R., Goss, W. M., & Mallik, D. C. V. 1992, ApJ, 394, 188
- Roshi & Anantharamaiah (2001) Roshi, D. A., & Anantharamaiah, K. R. 2001, ApJ, 557, 226
- Roshi et al. (2012) Roshi, D. A., Plunkett, A., Rosero, V., & Sravani, V. 2012, ApJ, 749, 49
- Rubin (1968) Rubin, R. H. 1968, ApJ, 154, 391
- Rubin et al. (2003) Rubin, R. H., Martin, P. G., Dufour, R. J., et al. 2003, MNRAS, 340, 362
- Smith et al. (1978) Smith, L. F., Biermann, P., & Mezger, P. G. 1978, A&A, 66, 65
- Terebey et al. (2003) Terebey, S., Fich, M., Taylor, R., Cao, Y., & Hancock, T. 2003, ApJ, 590, 906
- Walter (1994) Walter, D. K. 1994, Publications of the Astronomical Society of the Pacific, 106, 106
- Weilbacher et al. (2015) Weilbacher, P. M., Monreal-Ibero, A., Kollatschny, W., et al. 2015, A&A, 582, A114
- Wenger et al. (2013) Wenger, T. V., Bania, T. M., Balser, D. S., & Anderson, L. D. 2013, ApJ, 764, 34
- Wilson et al. (2015) Wilson, T. L., Bania, T. M., & Balser, D. S. 2015, ApJ, 812, 45
- Wood & Loeb (2000) Wood, K., & Loeb, A. 2000, ApJ, 545, 86
- Wood & Mathis (2004) Wood, K., & Mathis, J. S. 2004, MNRAS, 353, 1126
- Wright et al. (2010) Wright, E. L., Eisenhardt, P. R. M., Mainzer, A. K., et al. 2010, AJ, 140, 1868
- Zhang et al. (2014) Zhang, B., Moscadelli, L., Sato, M., et al. 2014, ApJ, 781, 89
- Zurita et al. (2002) Zurita, A., Beckman, J. E., Rozas, M., & Ryder, S. 2002, A&A, 386, 801
- Zurita et al. (2000) Zurita, A., Rozas, M., & Beckman, J. E. 2000, A&A, 363, 9