A near infrared line list for NH3: Analysis of a Kitt Peak spectrum after 35 years
Abstract
A Fourier Transform (FT) absorption spectrum of room temperature NH3 in the region 7400 - 8600 cm-1 is analysed using a variational line list and ground state energies determined using the MARVEL procedure. The spectrum was measured by Dr Catherine de Bergh in 1980 and is available from the Kitt Peak data center. The centers and intensities of 8468 ammonia lines were retrieved using a multiline fitting procedure. 2474 lines are assigned to 21 bands providing 1692 experimental energies in the range 7000 - 9000 cm-1. The spectrum was assigned by the joint use of the BYTe variational line list and combination differences. The assignments and experimental energies presented in this work are the first for ammonia in the region 7400 - 8600 cm-1, considerably extending the range of known vibrational-excited states.
keywords:
Room temperature , Ammonia , Absorption Intensities , FTIR spectroscopy , Experimental energies , BYTe , line assignments1 Introduction
Being one of the simplest polyatomic molecules and present in many environments, including the interstellar medium, brown dwarfs and solar system planets, NH3 is a very important molecule for astronomers. It also has several applications in industry, such as the reduction of NOx emissions in smoke stacks [1] and the manufacture of hydrogen cyanide by the Andrussow process [2]. This has motivated over 140 experimental studies on its spectrum, recent work includes high [3, 4, 5, 6] and low [7, 8] temperature studies in various spectral regions. A comprehensive compilation of measured NH3 rotational and ro-vibrational spectra can be found in a recent MARVEL study [9].
The MARVEL (measured active rotation-vibration energy levels) algorithm [10, 11] simultaneously analyses all available assigned and labelled experimental lines, thus yielding the associated energy levels. The recent study for NH3 analysed 29,450 measured transitions and yielded 4961 accurately-determined energy levels. The critically reviewed and validated high resolution experiments employed by this study, cover the region 0.7 - 17,000 cm-1 with a large gap between 7000 – 15,000 cm-1. In fact there is an overall lack of detailed and accurate information for NH3 transitions in this region.
The band model parameters of Irwin et al [12] cover the region 400 to 11000 cm-1, but was intended for analysis at low spectral resolution so the measurements were obtained at a spectral resolution of only 0.25 cm-1 and not assigned. The HITRAN database [13], a major source of experimental data, contains no information for NH3 above 7000 cm-1.
A number of variational line lists are available for NH3 [14, 15, 16]. In this work we use BYTe [15] which is a variationally computed line list for hot NH3 that covers the range 0 - 12,000 cm-1. BYTe is expected to be fairly accurate for all temperatures up to 1500 K (1226 ∘C). It comprises of 1 138 323 251 transitions constructed from 1 373 897 energy levels lying below 18 000 cm-1. It was computed using the NH3-2010 potential energy surface [17], the TROVE ro-vibrational computer program [18] and an ab initio dipole moment surface [14]. However this line list is known to be less accurate for higher wavenumber transitions [19, 20, 21], and assigned high resolution laboratory spectra in poorly characterised regions is needed.
The reason for the void between 7000 and 15,000 cm-1 is the complexity of the NH3 spectrum making analysis of experimental spectra using the established method of fitting Hamiltonians tricky [22, 23]. In the present work we take on this challenge by employing the same technique used previously [3, 6] to study high temperature spectra, to study the room temperature, near infrared spectrum of NH3 in the 7400 – 8600 cm-1 region. This region is of present interest. For example there are peaks in NH3 opacity between 1.210 m and 1.276 m which are important features in late type T dwarfs [24]. In wavenumbers this region is 7836 - 8265 cm-1 which is covered by an unanalysed 1980 room temperature spectrum in the Kitt Peak Archive. This spectrum was recently used by Campargue et al [25] to identify residual NH3 lines in their ultra-long pathlength water spectra.
This article has the following structure. Section 2 describes the Kitt Peak spectrum and the construction of the experimental line list. Section 3 gives an overview of the assignment procedure. Section 4 comes in two parts. The accuracy of BYTe is assessed in Section 4.1 by a direct comparison with the experimental line list. A summary of all assignments and new experimental energies is presented in Section 4.2. Finally Section 5 gives our conclusions and discusses avenues for further work.
2 Experimental Data
2.1 The Kitt Peak spectrum
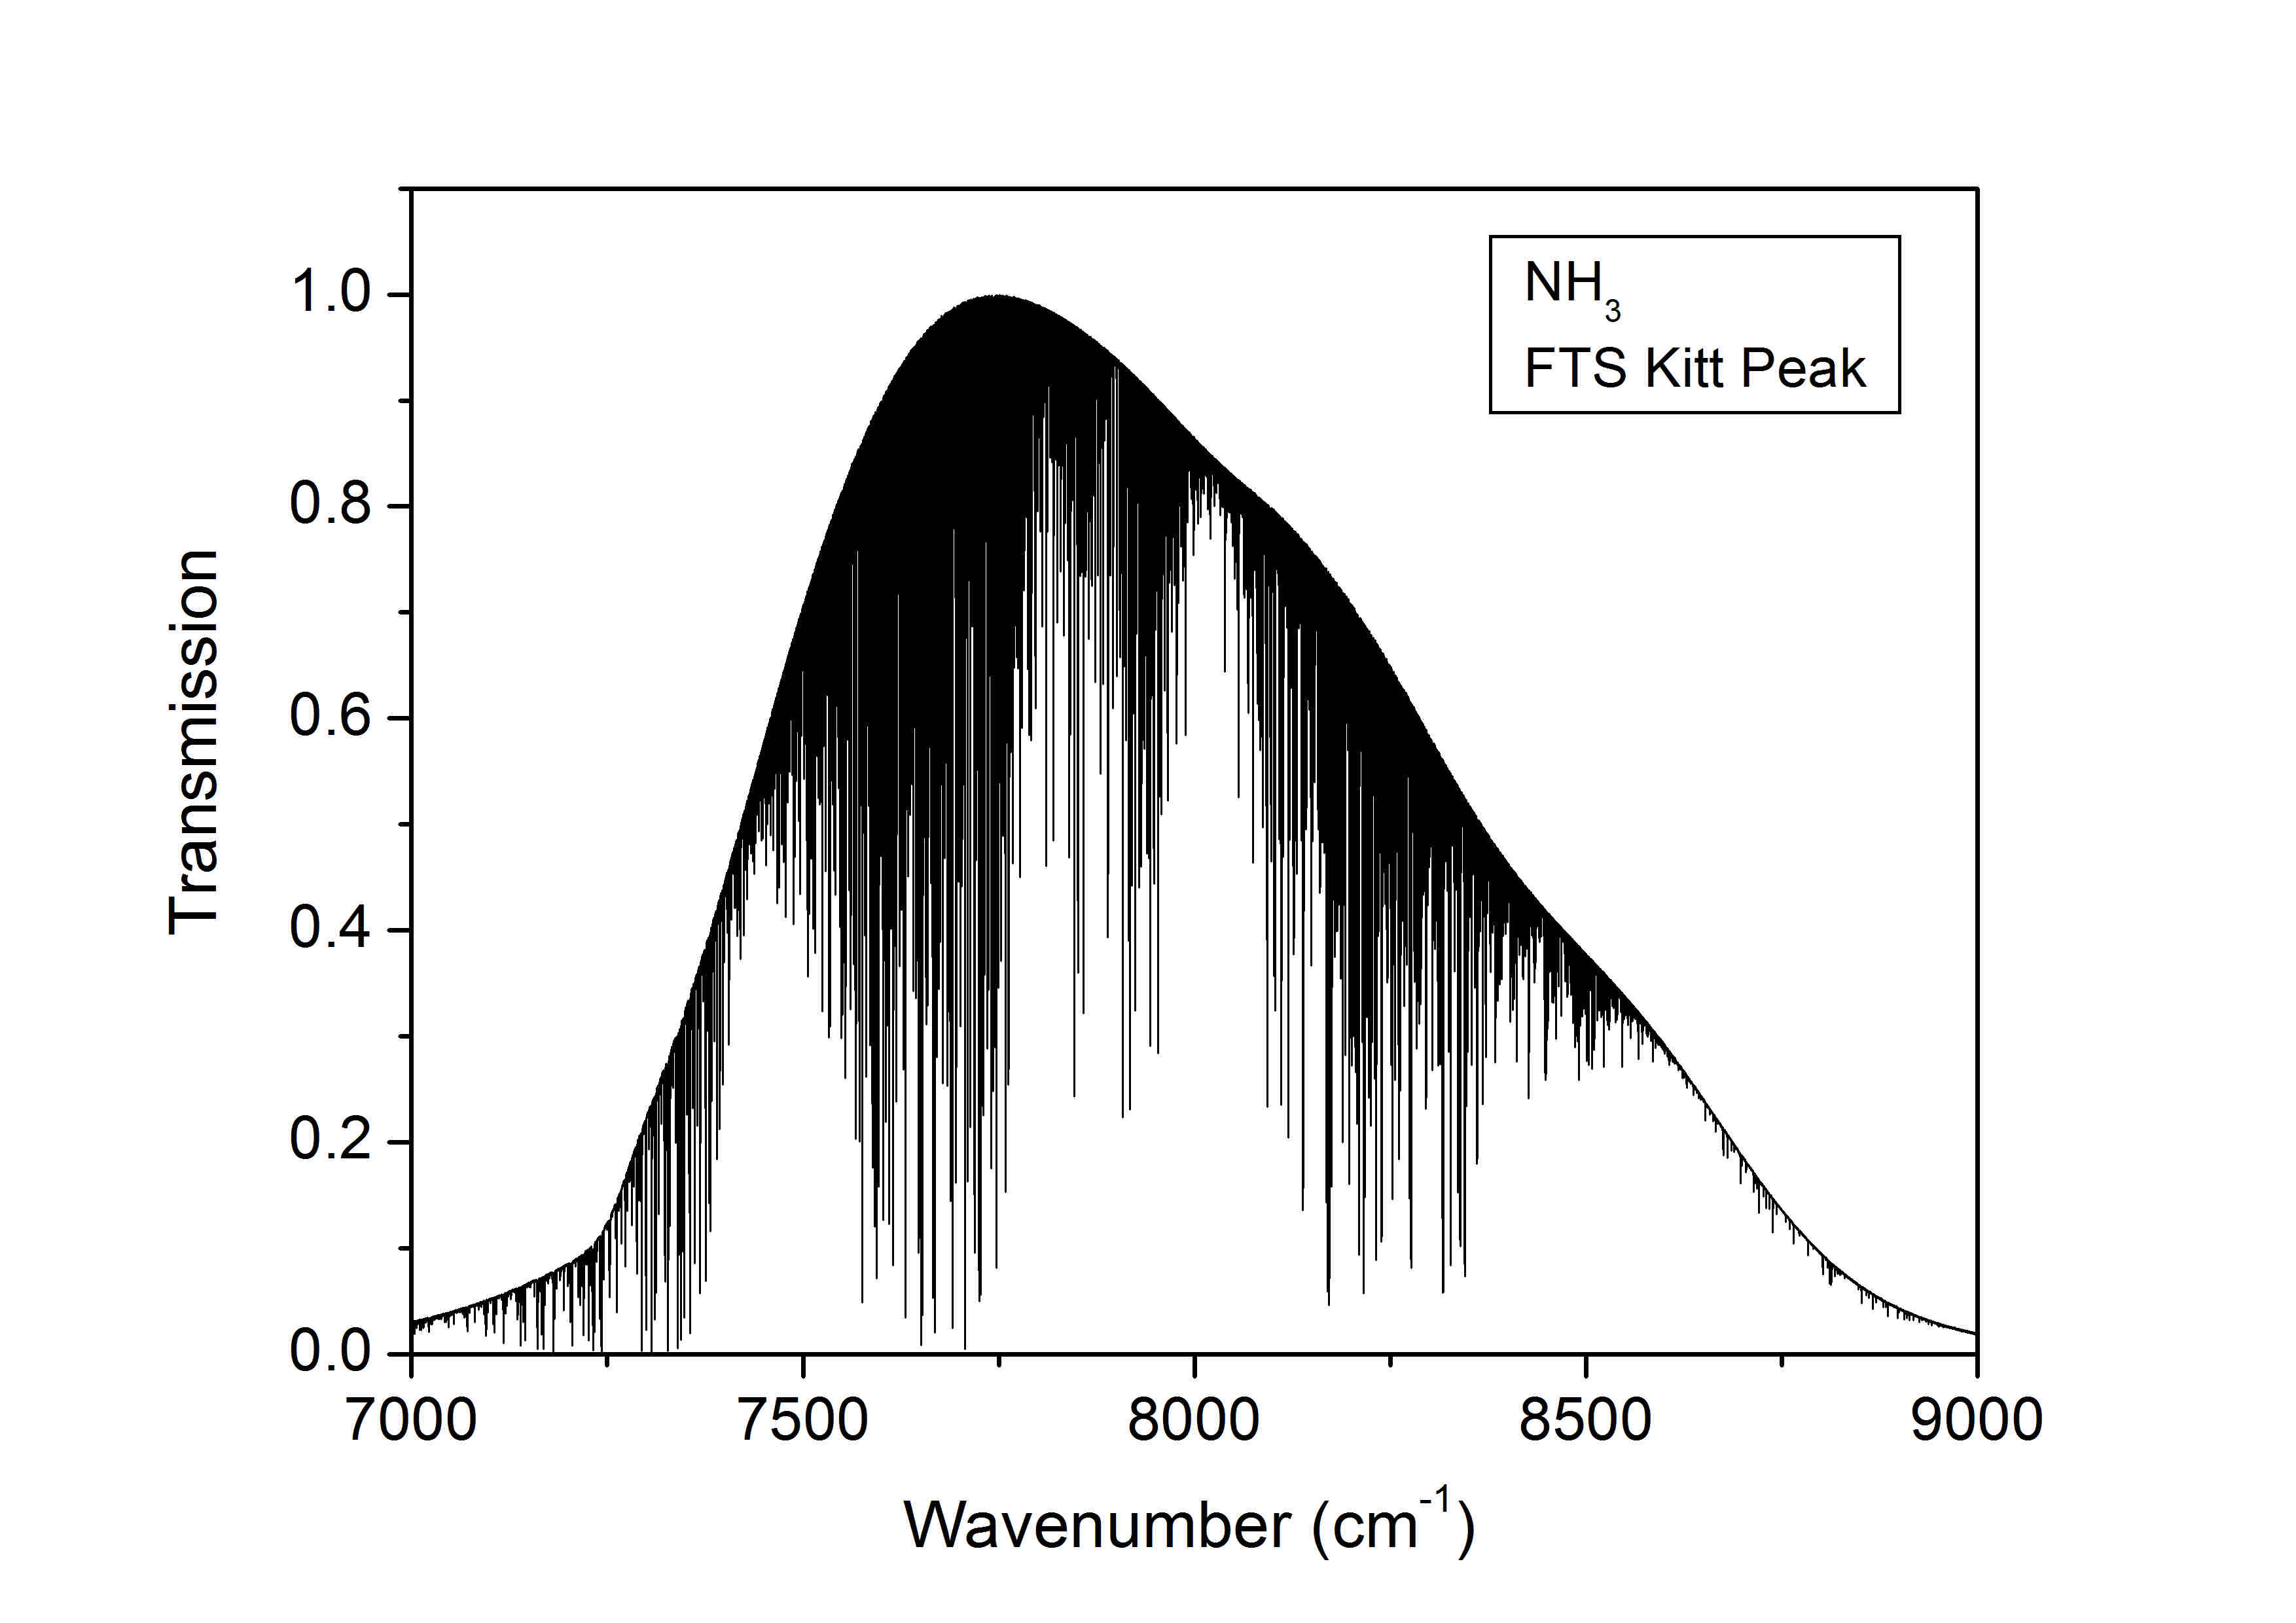
The Kitt Peak data center provides open access to laboratory Fourier Transform (FT) spectra recorded at Kitt Peak. The room temperature laboratory absorption spectrum of NH3 analysed by the present work (800407R0.004) was recorded by Dr. Catherine de Bergh using a one metre FT spectrometer. The spectrometer in question was a permanent instrument on the McMath Solar Telescope, the largest solar telescope in the world [26], and was used for both solar and laboratory analysis. In 2012 the instrument was transferred to Old Dominion University [27]. The spectrum was recorded at a resolution of 0.01 cm-1 and generated from an average of 12 scans. Some key information provided in the FITS header is presented in Table 1. The first and last wavenumber are listed as 5797 cm-1 and 9682 cm-1 respectively but our study focusses on the region 7400 - 8600 cm-1. Figure 1 gives an overview of the spectrum.
| Archive Name | 800407R0.004 |
|---|---|
| Temperature | 21.5 ∘C |
| Pressure | 5 Torr |
| Resolution | 0.01109469 cm-1 |
| Path length | 25 m |
| Date | 07/04/1980 |
| Spectral Type | Absorption |
| Wavenumber Start | 5786.89 |
| Wavenumber Stop | 9682.65 |
2.2 Construction of the line list
The wavenumber scale was calibrated using water lines which are clearly apparent around 7500 and 8600 cm-1. The correction term fitted as a linear function of the wavenumbers was found to be -0.028 cm-1 at 8000 cm-1. It is worth noting that the shape of the water lines indicates that they involve a sharp contribution due to water molecules present as an impurity in the low pressure sample, and a broader contribution due to atmospheric water present in the spectrometer. The quality of the wavenumber calibration was checked in two ways: by comparison of ammonia line positions observed at the low energy range of the spectrum with positions provided in the HITRAN database below 7000 cm-1 and by comparison to the positions of ammonia lines identified in the high sensitivity CRDS spectrum of water [25]. As a result, the accuracy of the reported line positions is estimated to be of the order of cm-1 for isolated lines of intermediate intensity.
The line centers and intensities were retrieved by multiline fitting of the spectrum using a homemade three step suite of programs written in Labview and C++ (see [28] for details). First the transmittance spectrum was converted to absorbance neglecting the apparatus function
After correction of the baseline, a peak finder procedure is used to construct a peak list (line center, peak height). A synthetic spectrum is then simulated by attaching a default profile to each peak. Taking into account the different factors limiting the accuracy of the intensity retrieval (line overlapping, baseline uncertainty, spectrometer apparatus function, significant line broadening), an effective default profile was determined from a small number of relatively isolated lines. Their profiles were fitted using a Voigt function whose averaged Gaussian and Lorentzian components were adopted as default values. From a visual comparison of the spectrum with the simulation, lines not detected by the peak finder were added manually. Then an automatic multiline fit was performed over the entire analysed region by adjusting only the line center and integrated line absorbance, the shape of all lines being fixed to the default Voigt profile. Finally, a manual adjustment was performed by further refining the profile parameters and adding/deleting weak lines. In the case of highly blended features, we tried to limit the number of components and preferred to relax the constraints on the parameter profiles within reason than to add lines in order to minimise the residuals.
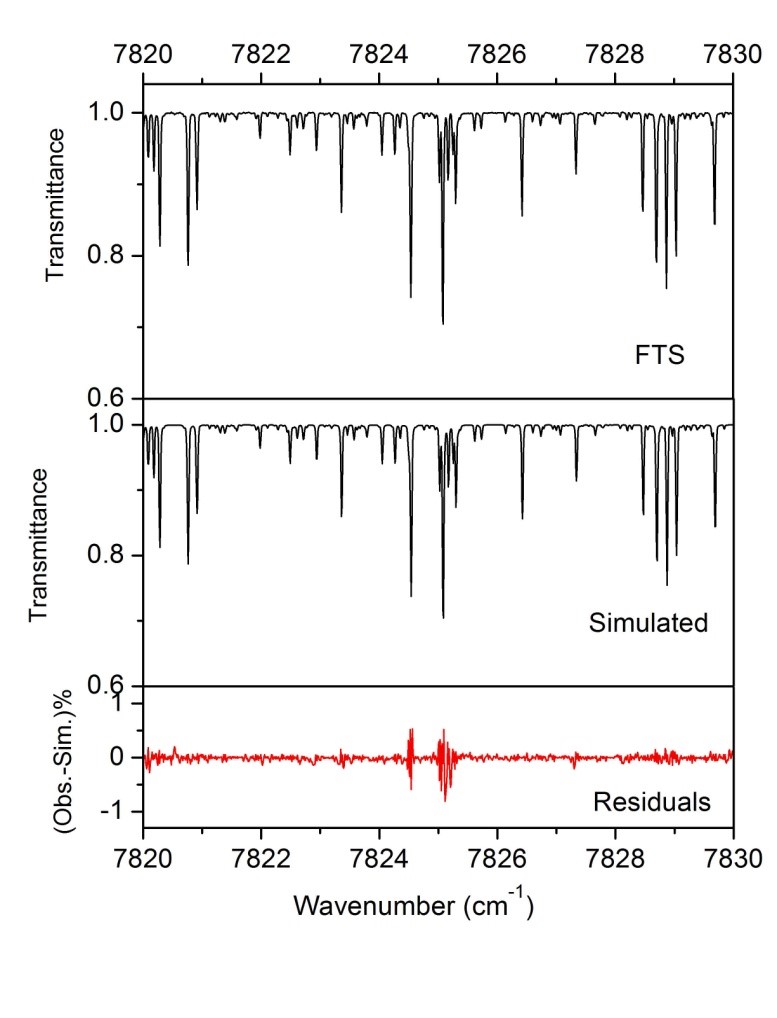
The apparatus function (neglected in the above tratement) introduces a significant underestimate of the intensity of the lines with transmittance smaller than 30 %. On the basis of spectral simulations, a correction curve was constructed for the line intensities; this curve was validated using lines near 7000 cm-1 with intensity provided in the HITRAN database and applied to all the intensities. The correction is on the order of 20 % for line intensities of cm/molecule. Figure 2 illustrates the quality of the final spectral reproduction achieved.
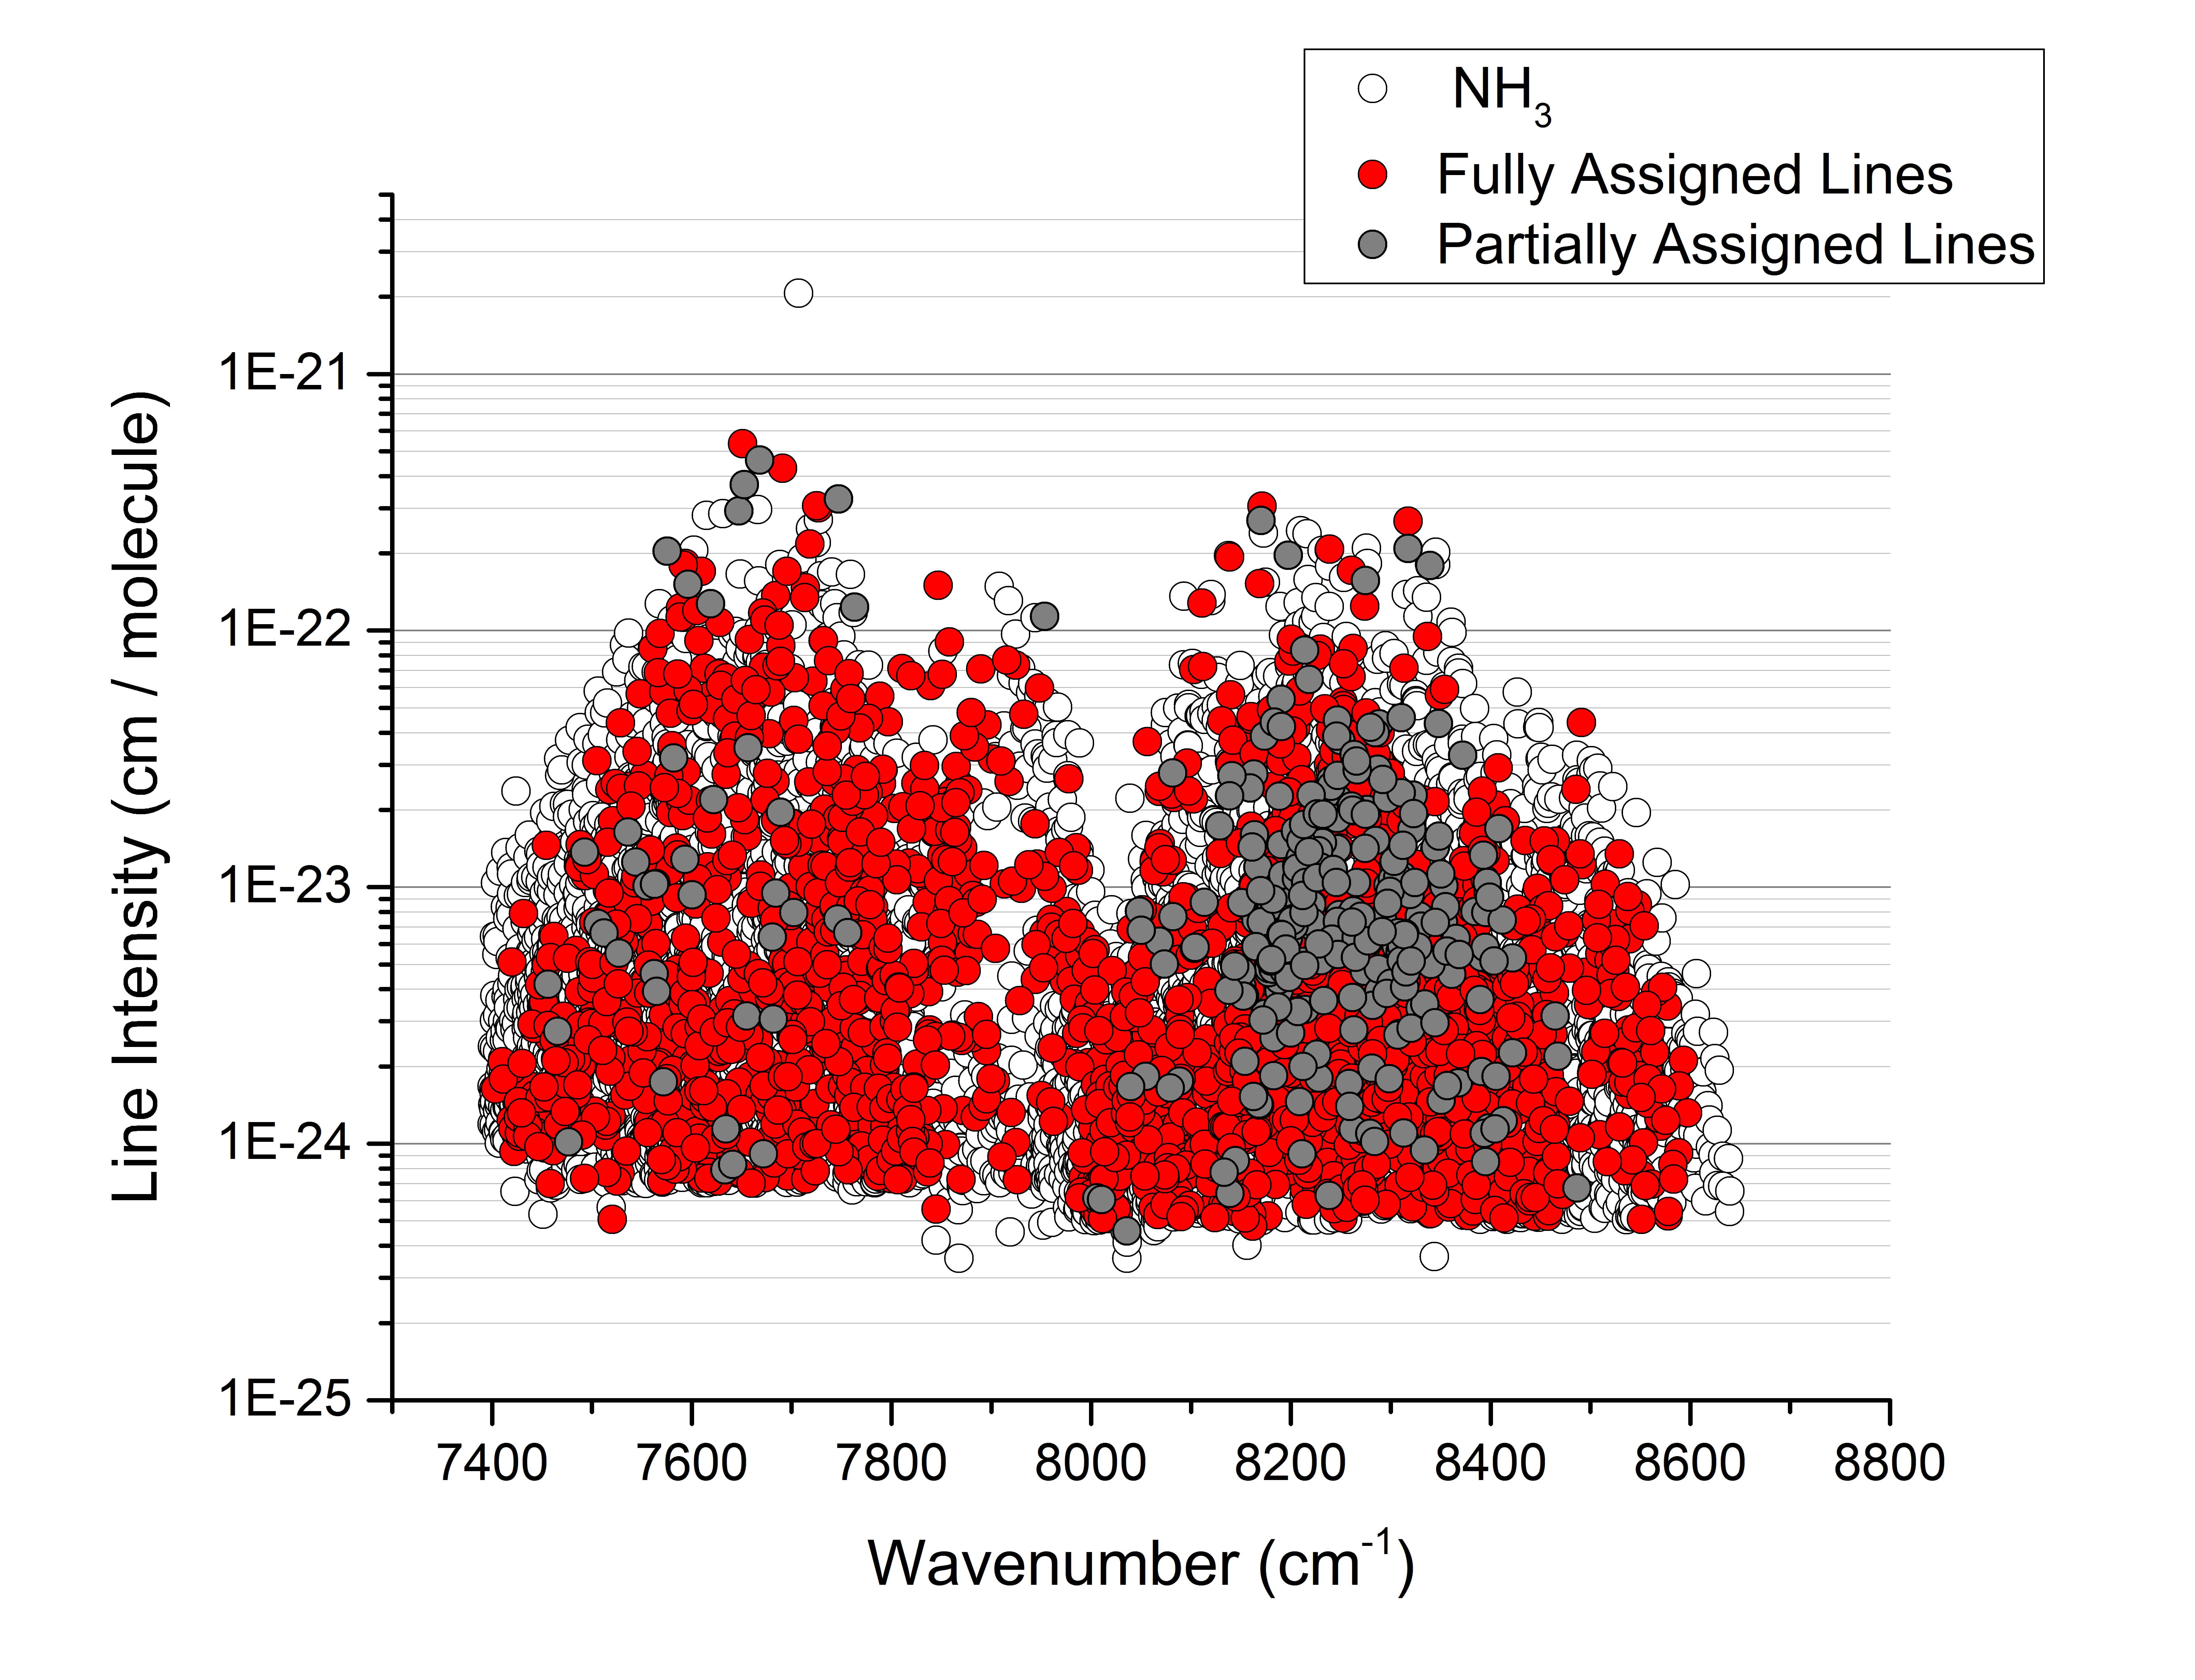
After removal of some water lines located at the low and high energy borders of the 7400 - 8640 cm-1 studied spectral region, the overall list presented in Fig. 3 includes 8468 lines with intensities ranging between about and cm/molecule. We suspect the retrieved intensity for the strongest experimental line (I cm/molecule) is at least an order of magnitude too strong. This is because the strongest BYTe lines are all of the order cm/molecule which is consistent with the remaining strongest experimental lines
Fully assigned lines and partially assigned lines are separately highlighted in Fig. 3; details of this distinction are discussed in Section 4.2. The average uncertainty on the retrieved line intensities is estimated to be of the order 15 % for isolated lines of intermediate intensity. This uncertainty value is consistent with the agreement we obtained by comparison to HITRAN intensity values for a sample of lines located in the 6950 - 7000 cm-1 range. It is nevertheless important to clarify that for the small fraction of lines with intensities larger than cm/molecule, the uncertainty values may significantly exceed 15%. For these lines, the transmission at the line center is of the order of only a few percent and biases related to the zero transmission or a not fully characterized apparatus function may be significant.
3 Data Analysis
This study employs the BYTe [15] variational line list and ground state energies determined using the MARVEL procedure [9].
A list of observable BYTe lines for the experimental conditions was compiled. This list included all lines with an absorption intensity greater that cm/molecule at 292.5 K (21.5 ∘C).
3.1 Assignment Procedure
Tentative assignments were given to the strongest experimental lines by comparison with the strongest BYTe lines (see Figure 5). Combination difference partners for these tentative assignments were found in the list of observable BYTe lines and assigned to experimental lines where possible. In this case the BYTe intensity should be within 55% of the experimental intensity and have a residual (observed minus calculated difference) up to about 3 cm-1. Upper state energies for resulting combination difference pairs (PQ, RQ or PR) or triplets (PQR) were calculated by adding the experimental line positions to the energy for the lower state associated with the transition. As all bands considered in this work go to the ground state and are limited to a rotational excitation of , these energies are known to very high accuracy (of the order 10-4 cm-1) and are available from the recent MARVEL study [9]. If the calculated upper energies agreed within 0.006 cm-1 for intermediate intensity unblended lines or 0.02 cm-1 for weak or blended lines these assignments were confirmed. Table 2 gives an subset of assignments confirmed by combination differences. In some cases the derived upper state energies were supported by more than three transitions.
Confirmed combination difference pairs and triplets for the same vibrational band provide an expected observed minus calculated (Obs. - Calc.) difference for all lines in that band. This Obs. - Calc. difference was used to shift the BYTe line positions for vibrational bands with at least 5 combination difference pairs or triplets and hence make further assignments to those bands. This is the method of branches [29], which exploits the systematic behavior of variational calculations that give an overall band shift but largely preserve the rotational structure. Table 3 gives a subset of assignments made using the method of branches.
The final assignment list is a compilation of all combination difference (CD) and branch (Br) assignments. Due to the inaccuracy of BYTe in the region 7400 - 8600 cm-1 (see Section 4.1) unconfirmed assignments made by simple line list comparison were discarded. Finally, we note that it is possible to identify further transitions that can satisfy CD criteria; however these transitions do not fall into clear bands so we have left these lines for future analysis.
| Obs. | Calc. [15] | Upper | Lower | Type | Upper State Energy |
|---|---|---|---|---|---|
| cm-1 | cm-1 | Quanta | Quanta | P/Q/R | cm-1 |
| 7555.8782 | 7554.8133 | 4 2 | 5 0 | P | 7853.5211 |
| 7588.2929 | 7587.2278 | 4 2 | 4 3 | Q | 7853.5204 |
| 7687.4314 | 7686.3683 | 4 2 | 3 0 | R | 7853.5209 |
| 7734.2821 | 7733.2204 | 4 2 | 3 3 | R | 7853.5205 |
| 7766.8616 | 7765.7996 | 4 2 | 5 3 | P | 7853.5206 |
| 7710.9095 | 7708.0570 | 6 1 | 7 2 | P | 8250.7546 |
| 7837.5170 | 7834.6673 | 6 1 | 6 1 | Q | 8250.7549 |
| 7849.1070 | 7846.2574 | 6 1 | 6 2 | Q | 8250.7551 |
| 7967.8183 | 7964.9705 | 6 1 | 5 2 | R | 8250.7555 |
| 7519.4722 | 7517.1594 | 6 5 | 7 7 | P | 7894.5792 |
| 7537.0004 | 7534.6874 | 6 5 | 6 4 | Q | 7894.5846 |
| 7655.9330 | 7653.6210 | 6 5 | 5 4 | R | 7894.5856 |
| 8161.8067 | 8159.5253 | 8 5 | 9 7 | P | 8872.6632 |
| 8321.9021 | 8319.6317 | 8 5 | 7 1 | R | 8872.6608 |
| Obs. | Calc. [15] | J′ | K′ | J′′ | K′′ | Type | Obs. - Calc. |
|---|---|---|---|---|---|---|---|
| cm-1 | cm-1 | P/Q/R | cm-1 | ||||
| 7833.3464 | 7833.3464 | 1 | 1 | 2 | 2 | P | 2.3824 |
| 7847.1197 | 7847.1197 | 0 | 0 | 1 | 1 | P | 2.3859 |
| 7704.1322 | 7704.1322 | 10 | 10 | 11 | 11 | P | 2.3772 |
| 7813.0536 | 7813.0536 | 8 | 5 | 8 | 4 | Q | 2.4110 |
| 7822.9094 | 7822.9094 | 7 | 4 | 7 | 3 | Q | 2.4245 |
| 7895.3264 | 7895.3264 | 10 | 8 | 10 | 9 | Q | 2.4227 |
| 8008.9997 | 8008.9997 | 12 | 11 | 11 | 10 | R | 2.4134 |
| 8010.4040 | 8010.4040 | 12 | 7 | 11 | 6 | R | 2.4159 |
| 8000.4518 | 8000.4518 | 11 | 9 | 10 | 8 | R | 2.3839 |
4 Results and Discussion
The accuracy of BYTe in the region 7400 - 8600 cm-1 is assessed by comparison to the experimental line list. BYTe is then employed to initiate assignments by combination differences and the method of branches. The experimental line list (with full or partial quantum labels for assigned lines) and new energy level information derived from the assignments are presented in supplementary data.
4.1 Direct Comparison with BYTe
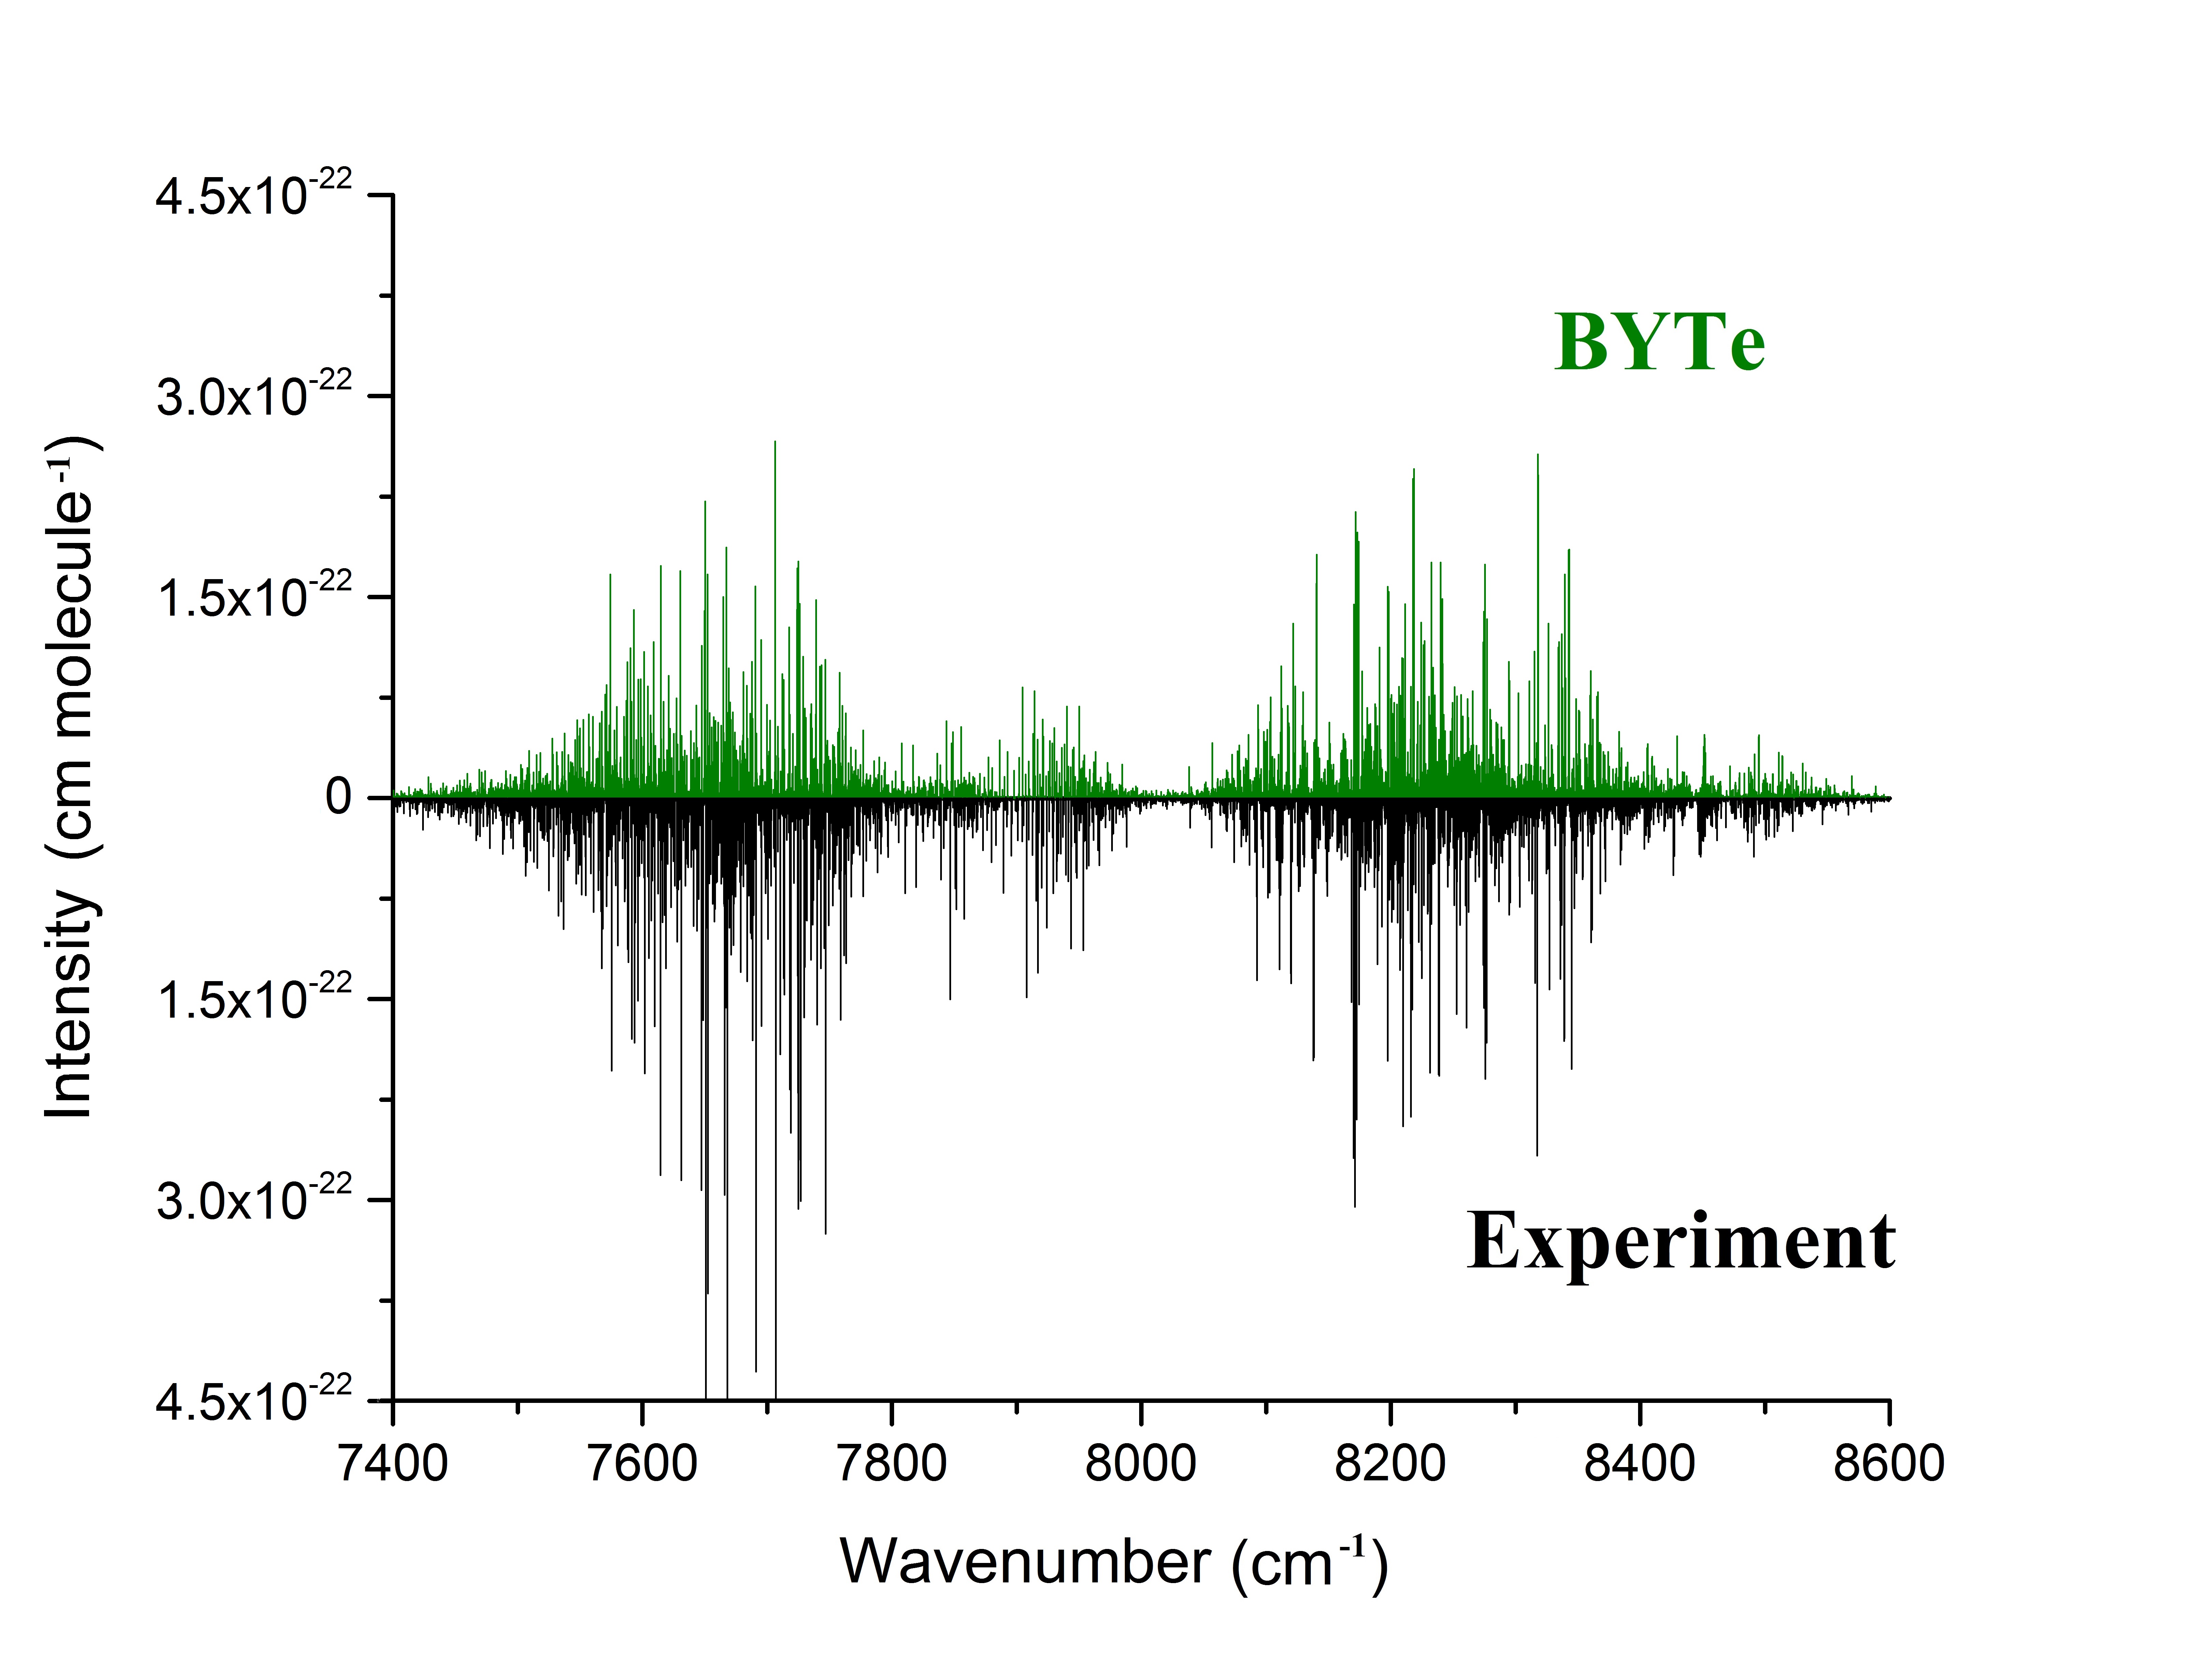
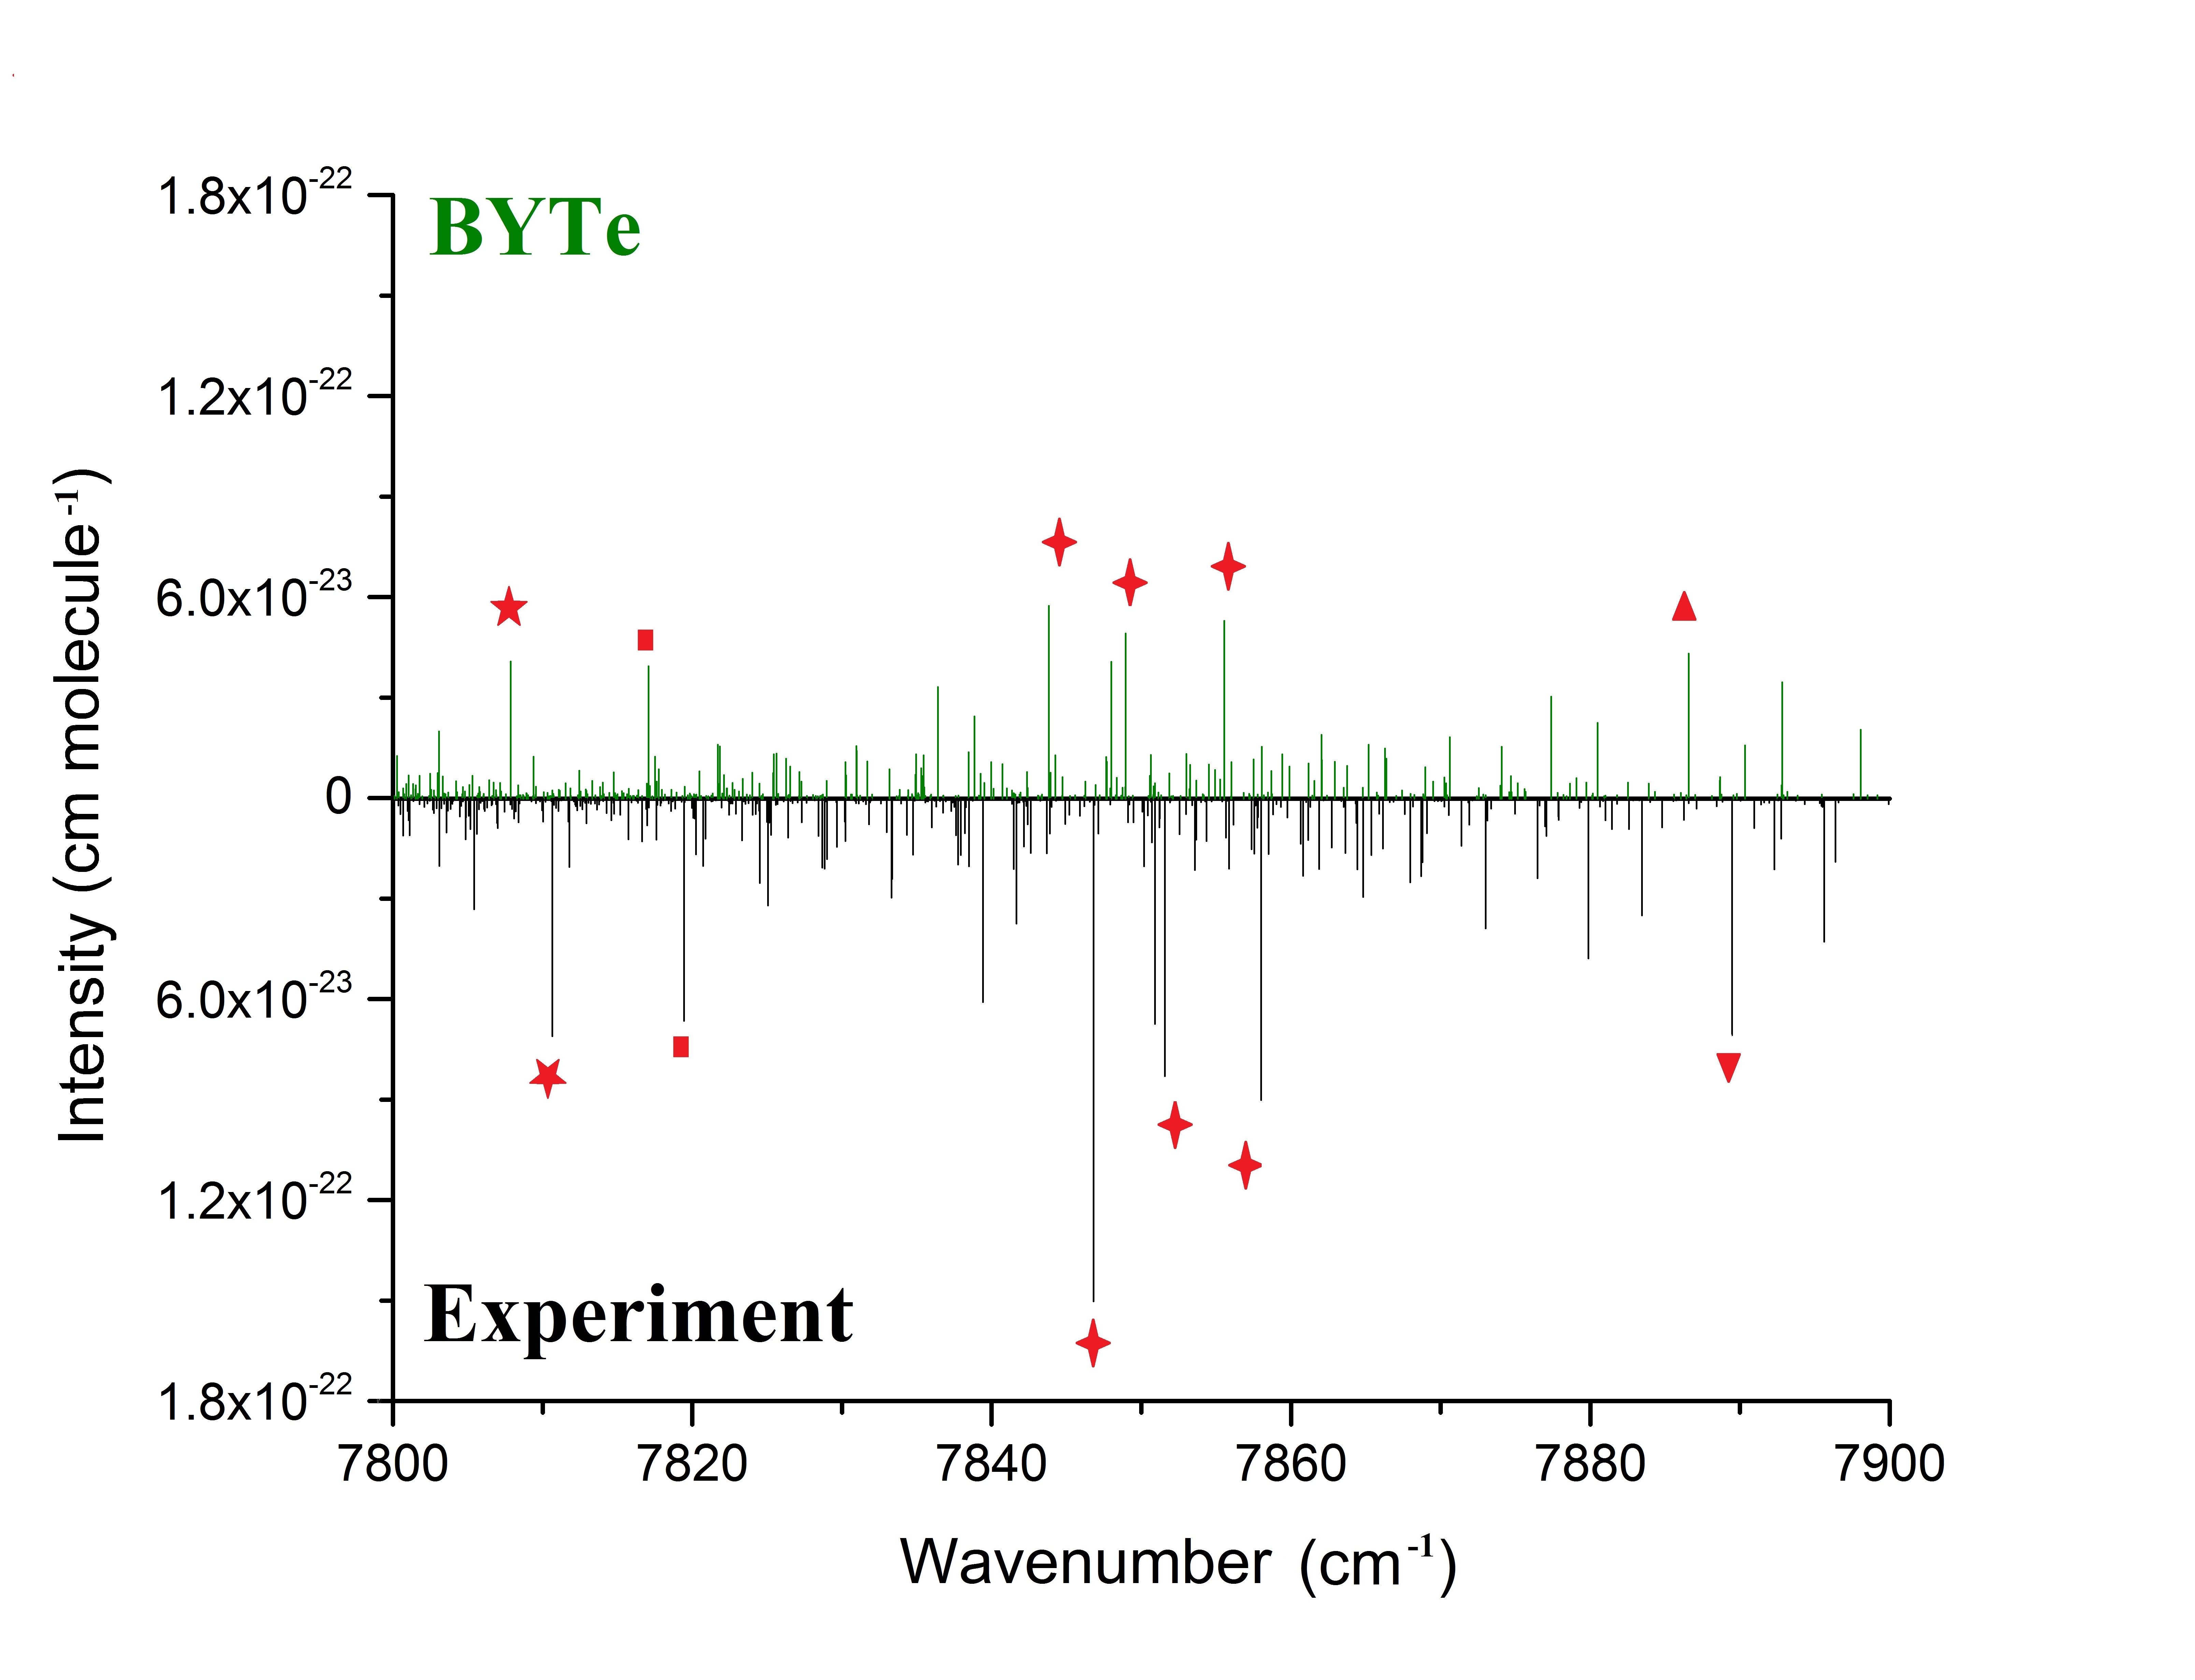
The BYTe variational line list covers the range 0 – 12,000 cm-1, but is known to be less accurate in higher wavenumber ranges [19, 20, 21]. For example, there are shifts in line position of up to 1.8 cm-1 around 6500 cm-1 [21]. Here we assess the accuracy of BYTe in the range 7400 - 8600 cm-1. Experimental vs theoretical stick spectra at 21.5 ∘C for the whole region is shown in Figure 4. On the whole there is reasonable agreement, although at high resolution BYTe line positions are shifted from experimental ones by up to 3 cm-1 with an average of 1.6 cm-1. Overall BYTe intensities are within 20 - 55% of the retrieved experimental ones, through the difference is worse in a few cases. Figure 5 illustrates the comparison for the region 7800 – 7900 cm-1. Although the accuracy of BYTe is not enough to make reliable assignments by line list comparison, there are clear coincidences in strong lines (examples shown by symbols in Figure 5) which gave us confidence that the experimental NH3 lines could be assigned using BYTe as a starting point to initialise more rigorous methods.
4.2 Assignments
All assignments, vibrational bands and experimental energies discussed below are new or observed for the first time in this work.
8468 experimental lines were retrieved in the region 7400 - 8600 cm-1, in total 2474 of these have been assigned, 1343 by combination differences (CD) and 1131 by the method of branches (Br). 2170 assigned lines have unique upper and lower energy state quantum labels in BYTe. These are fully assigned with 26 quantum labels, 13 per rotation-vibration state as recommended by Down et al [30]. The additional 304 do not have unique upper state labels in BYTe hence only the rigorous quantum state labels (total angular momentum and total symmetry) can be trusted. These are partially assigned with 13 lower state labels, as recommended by Down et al [30], and 2 upper state labels, and . The 5994 unassigned experimental lines either did not have a CD partner or did not correspond to a shifted BYTe line for any of the vibrational bands analysed in this work. Most of these are weak lines that probably belong to other vibrational bands, perhaps hot bands, that have too few observed lines in the current experiment to be properly characterized. Around 1200 unassigned lines could be classified as strong or intermediate. These lines may belong to other bands not included in the present analysis, else the assignment of these lines may have been hampered by the uncertainty in experimental and theoretical intensities. The experimental line list with full or partial quantum labels for assigned lines is presented as supplementary data to this paper.
Upper state energies were computed using MARVEL ground state energies and the line position of the strongest line assigned to that state. These are presented as supplementary data to this paper and summarised in Table 5 and Table 6.
Lines with full assignments belong to one of 15 different bands. Table 4 gives a summary of the observed bands including the number of lines assigned to each. The bands are listed in order of vibrational band origin (VBO) which is either the computed upper energy for the observed P(0) transition (E) or the BYTe prediction shifted by the average observed minus calculated difference for the band (B). For simplicity abbreviated vibrational labels are used to identify bands in this table. and are vibrational angular momentum quantum numbers corresponding to doubly degenerate and vibrational modes respectively. is the inversion symmetry of the vibrational mode which can be positive (+, symmetric) or negative (-, asymmetric). The full 26 quantum labels for each transition, 13 per vibration-rotation state as recommended by Down et al [30], are given in the supplementary data.
Lines with partial assignments belong to one of 6 different bands. In the absence of unique vibrational labels these bands are simply named Band 1 - 6. Line assignments and derived energies for these bands, totalling 304 and 223 respectively, are summarised in Table 6. Full lower and partial upper quantum labels for the assignments are given in the supplementary data. These bands are not the first observed ammonia bands for which the vibrational quantum numbers have yet to be determined [31, 32].
The CD assignments can be divided into two categories, those where the calculated upper energies agree within 0.006 cm-1 and those where the calculated upper energies agree within 0.02 cm-1.
The former can be considered secure, as the calculated upper energies consistently agree within the higher experimental uncertainty for given CD pair and triplets or groups of transitions sharing the same upper energy state.
In the latter case, the real transition(s) involved in the CD relation are obscured in the experimental spectrum by (a) stronger line(s). In other words the assigned line position is the nearest, rather than the true, peak-centre. Hence these are more tentative.
The accuracy of Br assignments depends on the determination of the Obs. - Calc. for a given vibrational band.
Strong bands with 10s of CD and Br assignments, such as , are well characterised and the stability of the Obs. - Calc. through the band can be clearly seen from the calculated energies tabulated in the supplementary data. Hence lines assigned to these bands by Br are reliable.
Weaker bands, such as , are more tentative. Although the overall consistency of our CD and Br results gives us confidence in all our assignments.
| Band | VBO / cm-1 | CD | Br | |
|---|---|---|---|---|
| 7572.9549 E | 143 | 76 | 67 | |
| 7603.1713 E | 134 | 69 | 65 | |
| 7656.8700 E | 162 | 103 | 59 | |
| 7673.84 B | 135 | 72 | 63 | |
| 7854.3892 E | 145 | 101 | 44 | |
| 7864.0831 E | 152 | 106 | 46 | |
| 8086.5926 E | 64 | 12 | 52 | |
| 8089.59 B | 63 | 14 | 49 | |
| 8174.7017 E | 224 | 135 | 89 | |
| 8177.4358 E | 217 | 120 | 97 | |
| 8253.7494 E | 159 | 109 | 50 | |
| 8257.5341 E | 152 | 91 | 61 | |
| 8266.3284 E | 120 | 73 | 47 | |
| 8463.2901 E | 151 | 54 | 97 | |
| 8463.8719 E | 149 | 55 | 94 |
| Band | Obs.-Calc. | |||
|---|---|---|---|---|
| 104 | 14 | 14 | 2.3 | |
| 99 | 14 | 14 | 3.0 | |
| 101 | 16 | 16 | 0.6 | |
| 92 | 15 | 15 | 1.0 | |
| 85 | 15 | 15 | 2.9 | |
| 88 | 14 | 14 | 2.4 | |
| 58 | 13 | 13 | 1.2 | |
| 56 | 14 | 13 | 1.3 | |
| 151 | 15 | 15 | -1.9 | |
| 105 | 16 | 16 | -0.6 | |
| 101 | 14 | 14 | 2.3 | |
| 104 | 14 | 13 | 2.2 | |
| 81 | 11 | 11 | 1.5 | |
| 123 | 13 | 13 | 2.4 | |
| 121 | 12 | 12 | 2.2 |
| Band | Range (approx.) | VBO / cm-1 | CD | Br | Obs.-Calc. | |||
|---|---|---|---|---|---|---|---|---|
| 1 | 7450 - 8000 | 7491.18 B | 36 | 18 | 18 | 27 | 8 | 2.3 |
| 2 | 8000 - 8450 | 8282.30 B | 63 | 30 | 33 | 46 | 11 | -1.9 |
| 3 | 8000 - 8450 | 8283.5189 E | 69 | 24 | 45 | 56 | 11 | -0.6 |
| 4 | 8000 - 8400 | 8211.24 B | 52 | 35 | 17 | 34 | 9 | 2.3 |
| 5 | 8100 - 8400 | 8212.04 B | 50 | 21 | 29 | 39 | 10 | 2.2 |
| 6 | 8050 - 8400 | 8281.65 B | 34 | 25 | 9 | 21 | 9 | 1.5 |
5 Summary
In this paper we present an experimental line list for, and an analysis of, a 35 year old room temperature spectrum of NH3 in the region 7400 – 8600 cm-1. The centers and intensities of 8468 ammonia lines were retrieved using a multiline fitting of the spectrum. For isolated lines of intermediate strength the accuracy of retrieved line position and intensities is estimated to be of the order 3 cm-1 and 15 % respectively. Although it should be noted that the uncertainty in the retrieved intensity may significantly exceed 15% for lines stronger that cm/molecule.
A comparison between the measurements and BYTe shows in general good agreement but there are shifts in line position of up to 3 cm-1 throughout the region and experimental line intensities are only reproduced with 20 - 55 % at best. Work towards a new, more accurate, hot NH3 line list is currently being carried out as part of the ExoMol Project [33].
The use of BYTe and MARVEL has allowed the assignment of 2474 lines, 1343 by combination differences and a further 1131 by the method of branches. In total 1692 new experimental energies between 7000 - 9000 cm-1 have been derived. Assignments associated with strong bands with tens of combination difference and branch assignments should all be reliable, as these bands are well characterised and have stable observed minus calculated differences throughout the band. The remaining assignments should also be safe, as all results from the two assignment procedures have proven very consistent, though these are more tentative.
We note that a room temperature spectrum for NH3 in the 9000 – 10,000 cm-1 region, also measured by Dr Catherine de Bergh in 1980, is available from the Kitt Peak Archive. We plan to make this a focus of future work although it is to be anticipated that current line lists will be less reliable at these higher wavenumbers.
Acknowledgements
This work was supported by a grant from Energinet.dk project N. 2013-1-1027, by UCL through the Impact Studentship Program and the European Research Council under Advanced Investigator Project 267219.
References
- Trimble [2011] D. C. Trimble, AIR QUALITY: Information on Tall Smokestacks and Their Contribution to Interstate Transport of Air Pollution, Technical Report, GAO U.S. Government Accountability Office, 2011. Published: May 11. Publicly Released: Jun 10.
- Pirie [1958] J. M. Pirie, Platinum Metals Rev. 2 (1958) 7–11.
- Zobov et al. [2011] N. F. Zobov, S. V. Shirin, R. I. Ovsyannikov, O. L. Polyansky, S. N. Yurchenko, R. J. Barber, J. Tennyson, R. Hargreaves, P. Bernath, J. Mol. Spectrosc. 269 (2011) 104–108.
- Hargreaves et al. [2012a] R. J. Hargreaves, G. Li, P. F. Bernath, J. Quant. Spectrosc. Radiat. Transf. 113 (2012a) 670–679.
- Hargreaves et al. [2012b] R. J. Hargreaves, G. Li, P. F. Bernath, Astrophys. J. 735 (2012b) 111.
- Barton et al. [2015] E. J. Barton, S. N. Yurchenko, J. Tennyson, S. Clausen, A. Fateev, J. Quant. Spectrosc. Radiat. Transf. 167 (2015) 126–134.
- Cermák et al. [2014] P. Cermák, J. Hovorka, P. Veis, P. Cacciani, J. Cosléou, J. E. Romh, M. Khelkhal, J. Quant. Spectrosc. Radiat. Transfer 137 (2014) 13–22.
- Cacciani et al. [2014] P. Cacciani, P. Cermák, J. Cosléou, J. El Rohm, J. Hovorka, M. Khelkhal, Mol. Phys. 112 (2014) 2476–2485.
- Al Derzi et al. [2015] A. R. Al Derzi, T. Furtenbacher, S. N. Yurchenko, J. Tennyson, A. G. Császár, J. Quant. Spectrosc. Radiat. Transf. 161 (2015) 117–130.
- Furtenbacher et al. [2007] T. Furtenbacher, A. G. Császár, J. Tennyson, J. Mol. Spectrosc. 245 (2007) 115–125.
- Furtenbacher and Császár [2012] T. Furtenbacher, A. G. Császár, J. Quant. Spectrosc. Radiat. Transf. 113 (2012) 929–935.
- Irwin et al. [1999] P. G. J. Irwin, S. B. Calcutt, K. Sihra, F. W. Taylor, A. L. Weir, J. Ballard, W. B. Johnston, J. Quant. Spectrosc. Radiat. Transf. 62 (1999) 193–204.
- Rothman et al. [2013] L. S. Rothman, I. E. Gordon, Y. Babikov, A. Barbe, D. C. Benner, P. F. Bernath, M. Birk, L. Bizzocchi, V. Boudon, L. R. Brown, A. Campargue, K. Chance, E. A. Cohen, L. H. Coudert, V. M. Devi, B. J. Drouin, A. Fayt, J.-M. Flaud, R. R. Gamache, J. J. Harrison, J.-M. Hartmann, C. Hill, J. T. Hodges, D. Jacquemart, A. Jolly, J. Lamouroux, R. J. Le Roy, G. Li, D. A. Long, O. M. Lyulin, C. J. Mackie, S. T. Massie, S. Mikhailenko, H. S. P. Müller, O. V. Naumenko, A. V. Nikitin, J. Orphal, V. Perevalov, A. Perrin, E. R. Polovtseva, C. Richard, M. A. H. Smith, E. Starikova, K. Sung, S. Tashkun, J. Tennyson, G. C. Toon, V. G. Tyuterev, G. Wagner, J. Quant. Spectrosc. Radiat. Transf. 130 (2013) 4 – 50.
- Yurchenko et al. [2009] S. N. Yurchenko, R. J. Barber, A. Yachmenev, W. Thiel, P. Jensen, J. Tennyson, J. Phys. Chem. A 113 (2009) 11845–11855.
- Yurchenko et al. [2011] S. N. Yurchenko, R. J. Barber, J. Tennyson, Mon. Not. R. Astron. Soc. 413 (2011) 1828–1834.
- Huang et al. [2011] X. Huang, D. W. Schwenke, T. J. Lee, J. Chem. Phys. 134 (2011) 044321.
- Yurchenko et al. [2011] S. N. Yurchenko, R. J. Barber, J. Tennyson, W. Thiel, P. Jensen, J. Mol. Spectrosc. 268 (2011) 123–129.
- Yurchenko et al. [2007] S. N. Yurchenko, W. Thiel, P. Jensen, J. Mol. Spectrosc. 245 (2007) 126–140.
- Huang et al. [2011a] X. Huang, D. W. Schwenke, T. J. Lee, J. Chem. Phys. 134 (2011a) 044320.
- Huang et al. [2011b] X. Huang, D. W. Schwenke, T. J. Lee, J. Chem. Phys. 134 (2011b) 044321.
- Sung et al. [2012] K. Sung, L. R. Brown, X. Huang, D. W. Schwenke, T. J. Lee, S. L. Coy, K. K. Lehmann, J. Quant. Spectrosc. Radiat. Transfer 113 (2012) 1066–1083.
- Kleiner et al. [1995] I. Kleiner, G. Tarrago, L. R. Brown, J. Mol. Spectrosc. 173 (1995) 120–145.
- Kleiner et al. [1999] I. Kleiner, L. Brown, G. Tarrago, Q. Kou, N. Picque, G. Guelachvili, V. Dana, J. Mandin, J. Mol. Spectrosc. 193 (1999) 46–71.
- Canty et al. [2015] J. I. Canty, P. W. Lucas, J. Tennyson, S. N. Yurchenko, S. K. Leggett, C. G. Tinney, H. R. A. Jones, B. Burningham, D. J. Pinfield, R. L. Smart, Mon. Not. R. Astron. Soc. 450 (2015) 454–480.
- Campargue et al. [2015] A. Campargue, S. N. Mikhailenko, B. G. Lohan, E. V. Karlovets, D. Mondelain, S. Kassi, J. Quant. Spectrosc. Radiat. Transf. 157 (2015) 135–152.
- The Association of Universities for Research in Astronomy, Inc. [1999] The Association of Universities for Research in Astronom, Inc., McMath-Pierce Solar Telescope, 1999. Accessed 09-11-2015.
- Old Dominion University Office of University Relations [2012] Old Dominion University Office of University Relations, Sophisticated Spectrometer Moving from Arizona to ODU, 2012. Accessed 16-11-2015.
- Beguier et al. [2015] S. Beguier, A. W. Liu, A. Campargue, J. Quant. Spectrosc. Radiat. Transf. 166 (2015) 6–12.
- Polyansky et al. [1997] O. L. Polyansky, N. F. Zobov, S. Viti, J. Tennyson, P. F. Bernath, L. Wallace, Astrophys. J. 489 (1997) L205–L208.
- Down et al. [2013] M. J. Down, C. Hill, S. N. Yurchenko, J. Tennyson, L. R. Brown, I. Kleiner, J. Quant. Spectrosc. Radiat. Transf. 130 (2013) 260–272.
- Coy and Lehmann [1986] S. L. Coy, K. K. Lehmann, J. Chem. Phys. 84 (1986) 5239–5249.
- Lehmann and Coy [1988] K. K. Lehmann, S. L. Coy, J. Chem. Soc. Faraday Trans. II 84 (1988) 1389–1406.
- Tennyson and Yurchenko [2012] J. Tennyson, S. N. Yurchenko, Mon. Not. R. Astron. Soc. 425 (2012) 21–33.