Monte-Carlo study of the MRPC prototype for the upgrade of BESIII
Abstract
A GEANT4-based simulation is developed for the endcap time of flight (ETOF) upgrade based on multi-gap resistive plate chambers (MRPC) for the BESIII experiment. The MRPC prototype and the simulation method are described. Using a full Monte-Carlo simulation, the influence of high voltage and threshold on time resolution and detection efficiency are investigated. The preliminary results from simulation are presented and are compared with the experimental data taken with the prototype MRPC modules.
1 Introduction
The BESIII experiment [1] is designed to study -charm physics (=2-4.6 GeV) in collisions at the double-ring Beijing Electron-Positron Collider (BEPCII). The time-of-flight (TOF) subdetector of BESIII plays an important role in particle identification (PID). In 2013, BESIII started an endcap TOF (ETOF) upgrade based on multi-gap resistive plate chambers (MRPC), which could effectively reduce the influence of multiple scattering effects with the main drift chamber (MDC) [2], and significantly improve the PID ability [3]. In 2015, two prototype MRPC modules were installed for performance check, and participated in data taking during physics runs under a series of high voltages and thresholds.
Monte-Carlo (MC) simulation is necessary in understanding the behavior of the MRPC detector and minimizing systematic uncertainties in the future physics analysis at the BESIII experiment. Therefore a reliable simulation software is desirable to describe the new detector and physical interactions. A simulation package has been built based on GEANT4 [4]. It has been implemented into the BESIII Offline Software System (BOSS) [5], capable to perform full simulation and reconstruction. In this paper, the MRPC prototype and the simulation method are described in detail. The performance is studied related with time resolution and detection efficiency based on the experimental data taken with the prototype modules.
2 Experiment setup
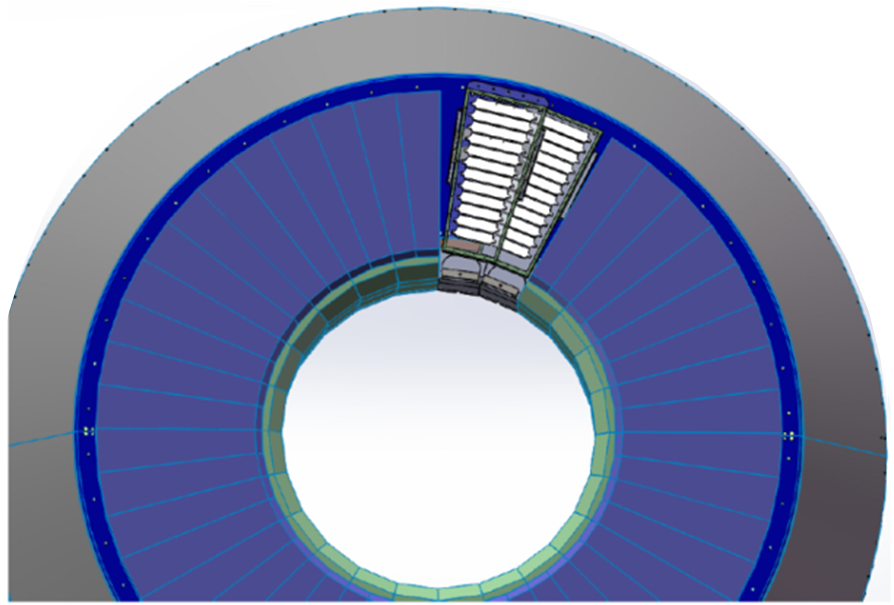
The BESIII detector is a general-purpose spectrometer consisting of five main components arranged cylindrically symmetric around the interaction point. Starting from the innermost, it consists of a MDC, a scintillator TOF, a crystal electromagnetic calorimeter (EMC), a superconducting solenoid magnet surrounding the EMC barrel with an axial uniform magnetic field of 1.0 T, and an outermost muon chamber (MUC) embedded within the return yoke of the magnet. The ETOF system is mounted inside the EMC endcap. Two prototype MRPC modules are installed into ETOF, taking place of four scintillators with a coverage of 1/18 in azimuth, as shown in Figure 1.
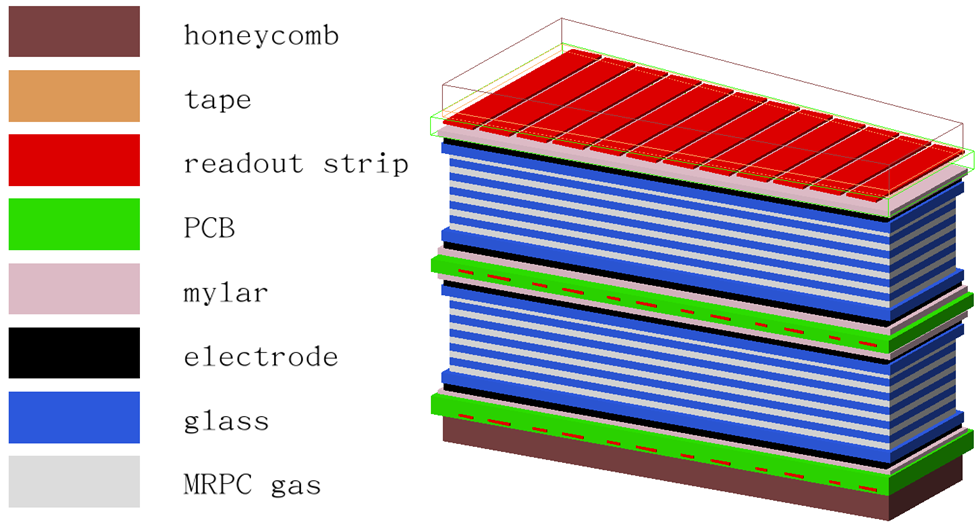
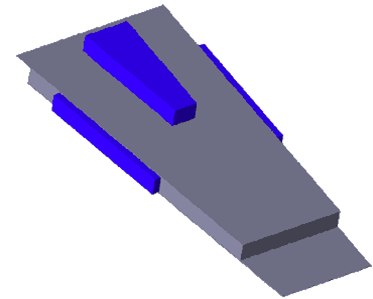
The design of one MRPC module is shown in Figure 1. It has 12 gas gaps arranged in a double stack. The gaps are 0.22 mm thick separated by 0.4 mm thick inner glasses, which are used as resistive plates with volume resistivity of about cm. The 0.55 mm thick outer glasses are coated with graphite film, which is used as the electrodes. The electrodes are separated from the readout strips by mylar films. In each module, there are 12 double-ended readout strips embedded in printed circuit boards (PCB), each of which is 25 mm wide with a 4 mm interval between them. PCBs are covered with honeycomb boards to hold the whole structure. The module is enclosed in a 25 mm thick gas-tight aluminum box shown in Figure 1, which is filled with a gas mixture of 90% C2F4H2, 5% SF6 and 5% iso-C4H10. The front-end electronics (FEE) are contained in the additional boxes at both sides and on the top of the aluminum box.
3 Simulation method
The exact description of the geometry and material and the physics processes involving the interaction between the incident particles and the working gas, are realized using GEANT4. The main processes in simulation consist of primary ionization, electron multiplication, signal induction, and conversion from charge signals to time information. These processes have been discussed in Ref. [6, 7, 3]. Here we mainly present some primary results related to each process.
3.1 Primary ionization
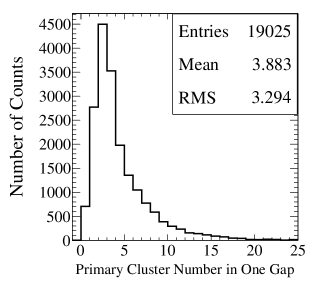
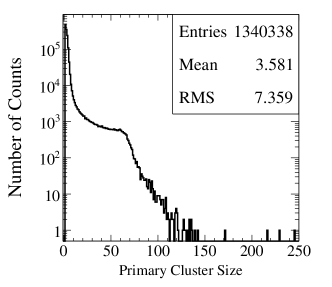
The primary ionization is characterized by the average number of clusters per unit length and the probability distribution of the number of electrons per cluster. In simulation these parameters of the working gas are determined by GEANT4. The simulation results are illustrated in Figure 2: there is an average of about 4 clusters in one gap, and each cluster most likely starts from 3-4 primary electrons.
3.2 Electron multiplication
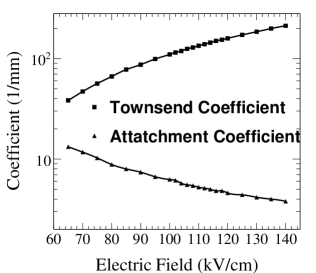
Two parameters are used to characterize the multiplication process: one is the Townsend coefficient describing the probability of multiplication due to secondary ionization, and the other is the attachment coefficient describing the probability of attachment. The variation of both coefficients with electric field are calculated using MAGBOLTZ [8], as is shown in Figure 3 for the working gas under standard temperature and pressure.
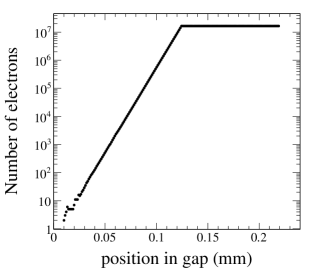
Figure 3 shows the development of one avalanche along the gas gap starting from 0.01 mm. It grows almost exponentially at the early stage, and stops growing when the avalanche contains electrons more than (1.5 in this study, close to the limit for avalanche-streamer transition [9]) for consideration about the space charge effect. An accurate simulation of the space charge effect involving the dynamic calculation of the electric field contributed by the avalanche charges is investigated in Ref. [10]. In this study, a simple cut-off is used because the time resolution and detection efficiency which really concern us are only sensitive to the early stage of an avalanche where the space charge effect can be neglected. We vary the value of and observe no obvious change in the resolution and efficiency of the collision data.
3.3 Signal induction
The signal caused by positive and negative ions is neglected because their velocities are very small. The induced current from electrons is calculated using the Ramo’s theorem [11]:
| (3.1) |
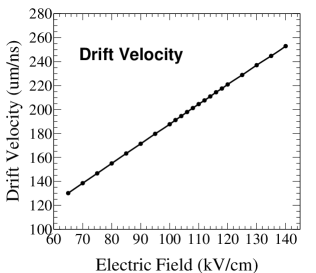
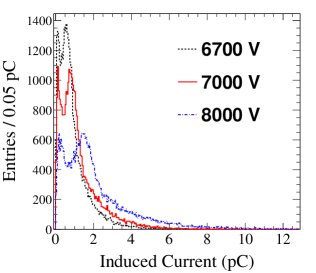
with being the weighting field [7], the drift velocity, the electron charge, and the number of electrons at time . The variation with the electric field is calculated using MAGBOLTZ, as is shown in Figure 4. The induced charge spectra under different electric fields are illustrated in Figure 4. The peak of the charge spectrum moves towards the right side with the increase of the electric field. Each spectrum has double peaks: the right peak represents the most possible charge, while the left one is caused by the hits at the chamber boarders or under the strip intervals. Under the electric field of 7000 V, we have a spectrum peaking around 1 pC.
3.4 Signal charge to time conversion
The signal information measured by the detector is the absolute timing of the leading edge (TDC) and the time over threshold (TOT). TDC is considered as the sum of the flight time of the particle (), the threshold crossing time of the avalanche () and the propagation time along the strip (). TOT denotes the delay between the leading-edge and trailing-edge timing, which is used in the time slewing correction to remove the timing uncertainty introduced by fixed-threshold leading-edge discrimination in the offline calibration.
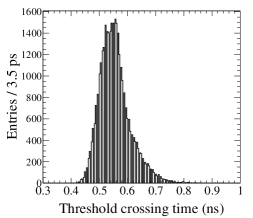
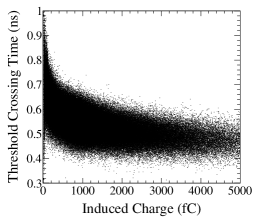
In simulation, is defined as the time of the first hit in the sensitive detector, which is provided by GEANT4. is determined as the time when the charge induced on the strips exceeds the threshold charge. is calculated using the extrapolated position information from the MDC tracks and a propagation speed assumed to be 0.8 ( denotes the velocity of light in a vacuum.) Uncertainties of TDC are considered by smearing the measured time with a Gaussian function with the corresponding standard deviation. In this study uncertainties from the following sources are considered: the jitter of the leading edge of the NINO chips, which depends on the input charge with the relationship empirically obtained; TDC resolution (27 ps); ambiguity of the 12 gaps where the signal is generated (10 ps); electronic components such as cables (20 ps); and an additional component with the noise, etc (15 ps). The distribution of the resulting is shown in Figure 5, and the dependence of on the input charge is illustrated in Figure 5.
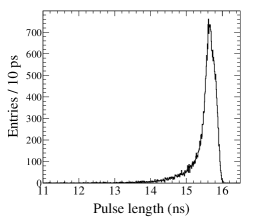
TOT is calculated from the input charge based on a conversion function relating the TOT measurement and the input charge, which is experimentally obtained. Then the central value will be smeared by a Gaussian to take uncertainties into account: the jitter of the pulse length depending on the input charge, and an additional uncertainty of 27 ps for TDC resolution. Both of them are obtained from experiments. The TOT distribution is shown in Figure 5.
4 Comparison with experimental results
The data used in this study are events collected by the two prototype modules under seven high voltages (HV) (6700, 6850, 7000, 7150, 7300, 7450 V) with Threshold of 200 mV, and four Thresholds (110, 150, 200, 250 mV) with HV of 7000 V. We generate MC samples at different working conditions for comparison with the experimental data. Both the experimental and MC samples are fully reconstructed in the same way in BOSS. In the reconstruction process, we define as the time difference between the corrected measured time and the expected flight time :
| (4.1) |
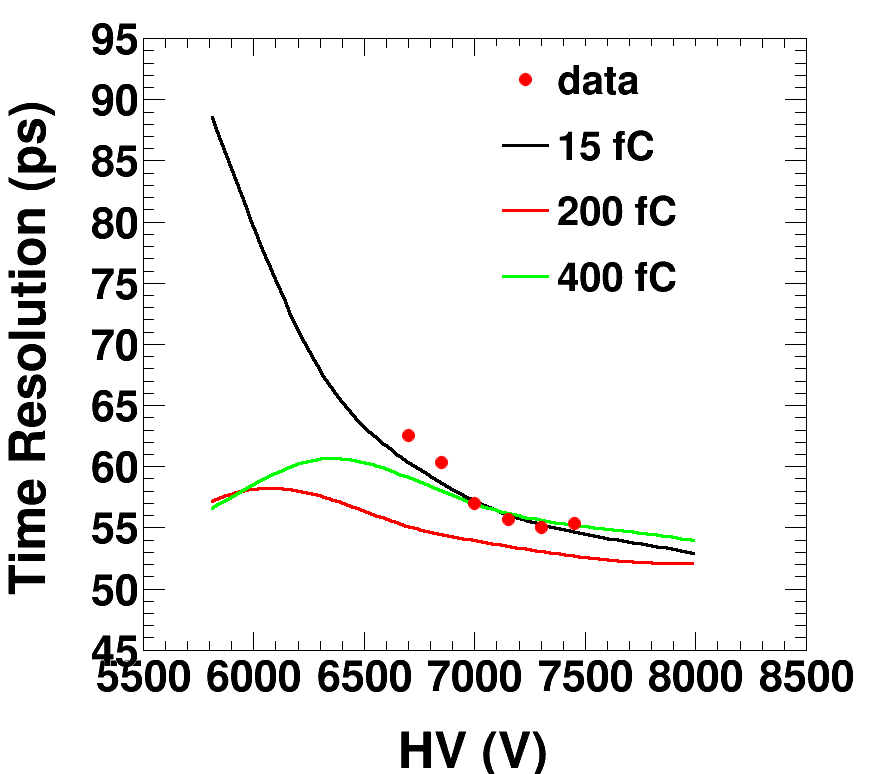
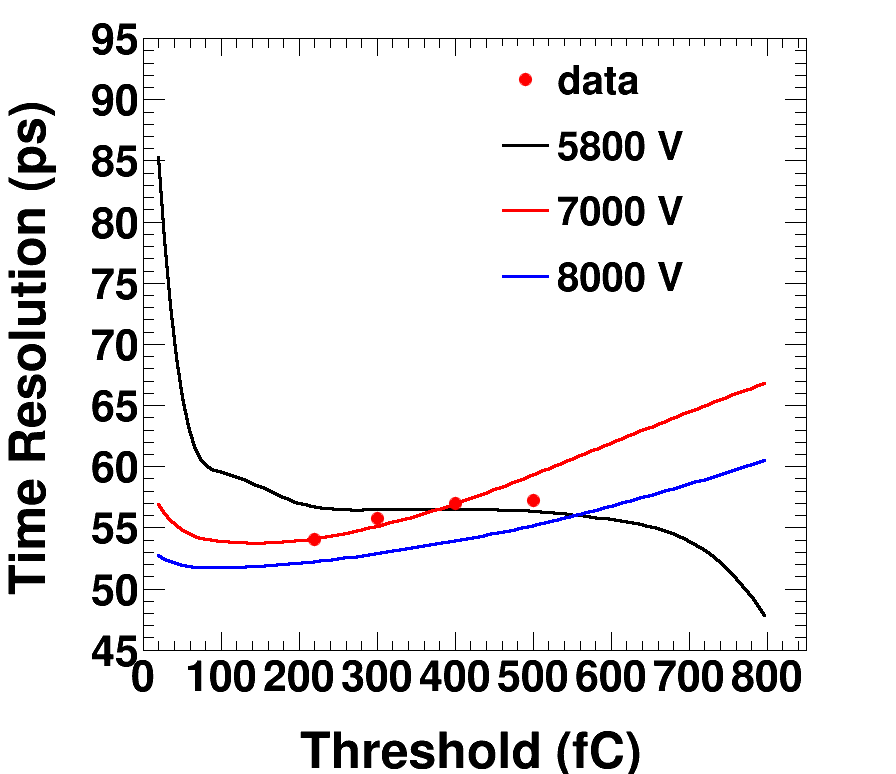
Time resolution is obtained by fitting the distribution with a Gaussian function and taking the fitted standard deviation. Figure 6 illustrates the variation of time resolution with HV in the left plot and with Threshold in the right plot. The resolution at the favored working condition (HV=7000 V, Threshold=200 mV) is around 57 ps. The simulation results are basically consistent with those from the experimental data. But in the case with a combination of HV<6500 V and Threshold>400 fC, the reason of the inverse trend of time resolution variation is still not clear.
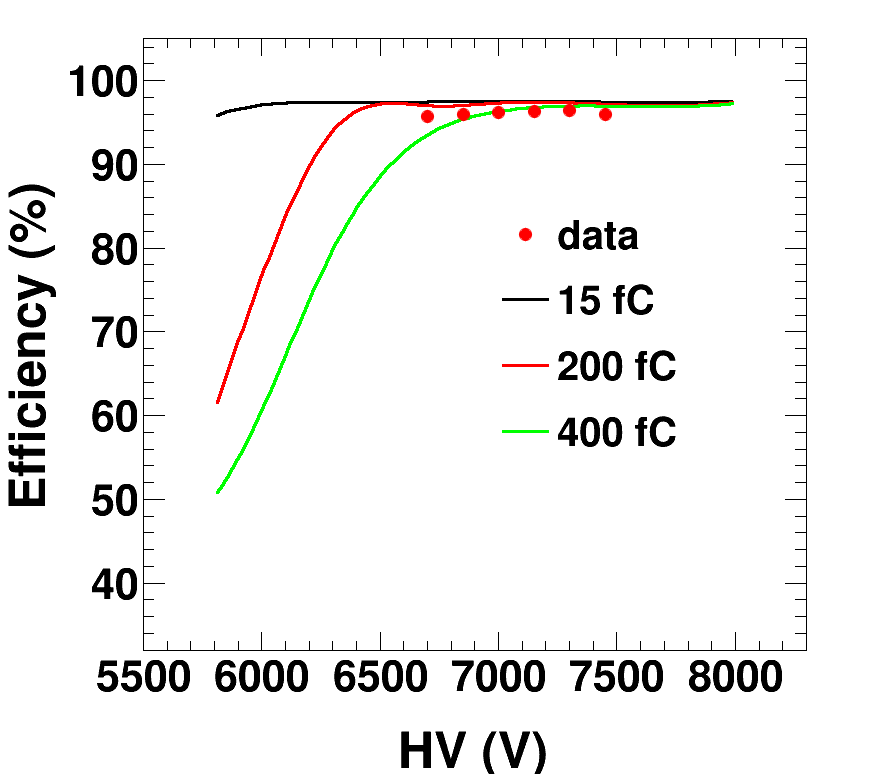
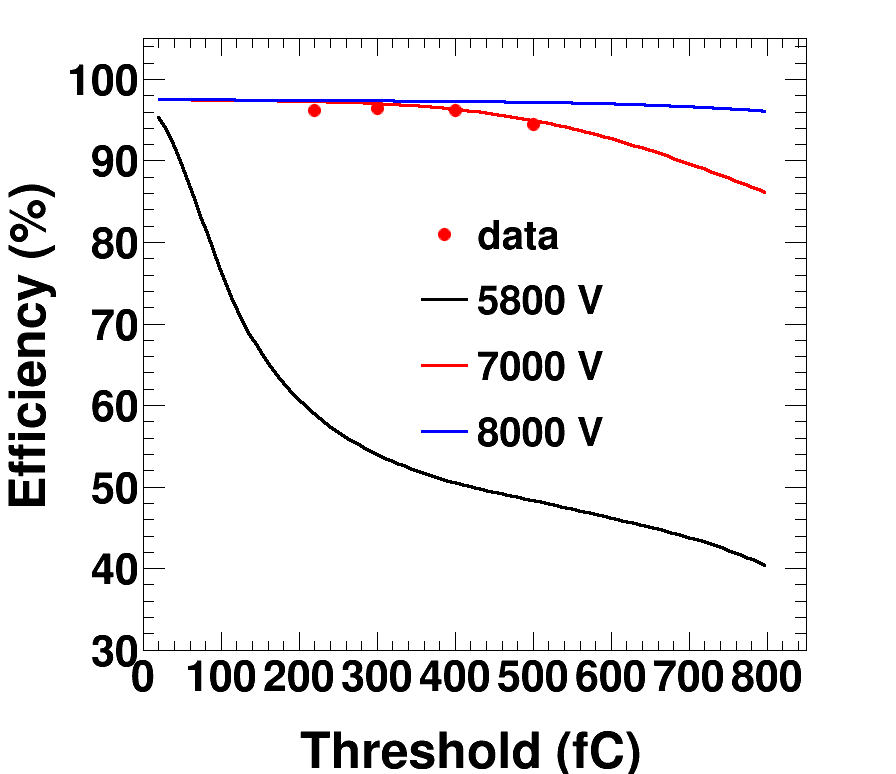
Detection efficiency is defined as
| (4.2) |
where denotes the number of well reconstructed tracks with ns, and denotes the number of extrapolated MDC tracks. The efficiency variation versus HV and Threshold is illustrated in Figure 7. The efficiency plateau is around 97%. The simulation results can well reproduce the behavior of the experimental data. But there is something interesting in the right plot when HV equals 5800 V: the efficiency decreases sharply when Threshold is small. This phenomenon indicates that under low electric field, the majority of the induced signals are as small as the 100 fC level.
5 Conclusion
A simulation package of MRPC based on Geant4 is developed for the upgrade of the BESIII ETOF system. Two prototype MRPC modules have been installed into the BESIII detector and have taken data during physics runs under a series of high voltages and thresholds. Simulation results of time resolution and detection efficiency under different working conditions are presented, which agree well with those from the experimental data. In order to achieve the high precision physics goal of BESIII, further study of digitization and MC tunning will be performed to optimize the parameters utilized in simulation based on the upcoming experimental data taken by the complete MRPC-based ETOF.
Acknowledgments
This work is supported by National Natural Science Foundation of China (NSFC) under Contracts No. 11575225 and National Key Basic Research Program of China under Contracts No. 2015CB856706.
References
- [1] M. Ablikim et al., Design and construction of the BESIII detector, Nucl. Instrum. Meth. (2010) 345.
- [2] H. Zhang et al., A GEANT4 Simulation Study of BESIII endcap TOF Upgrade, Chin. Phys. C 37, No. 9, 096002 (2013).
- [3] M. Ullrich, W. Kuhn, Y. Liang, B. Spruck and M. Werner, Simulation of the BESIII Endcap Time of Flight Upgrade, Nucl. Instrum. Meth. (2015) 32.
- [4] S. Agostinelli, et al. (GEANT4 Collaboration), Nucl. Instrum. Meth. (2003) 250.
- [5] W. Li, et al., The offline software for the BESIII experiment, The Proceedings of CHEP06, Mumbai (2006).
- [6] Riegler W, Lippmann C and Veenhof, Detector physics and simulation of resistive plate chambers, Nucl. Instrum. Meth. (2003) 144.
- [7] M. Shao, et al., Simulation Study on the operation of a multi-gap resistive plate chamber, Meas. Sci. and Technol. (2006) 123.
- [8] S. Biagi, Monte Carlo simulation of electron drift and diffusion in counting gases under the influence of electric and magnetic fields, Nucl. Instrum. Meth. (1999) 234.
- [9] P. Fonte, V. Peskov and F. Sauli, Feedback and breakdown in parallel-plate chambers, Nucl. Instrum. Meth. (1991) 91.
- [10] Lippmann C and Riegler W, Space charge effects in Resistive Plate Chambers, Nucl. Instrum. Meth. (2004) 54.
- [11] S. Ramo, Currents Induced by Electron Motion, Proc. IRE (1939) 584.