Numerical study on the effect of design parameters and spacers on RPC signal and timing properties
Abstract
Numerical calculations have been performed to understand the reason for the observed non-uniform response of a Resistive Plate Chamber (RPC) in a few critical regions such as near edge spacers and corners of the device. In this context, the signal from a RPC due to the passage of muons through different regions has been computed. Also, a simulation of RPC timing properties is presented along with the effect of the applied field, gas mixture and geometrical components.
1 Introduction
The India-based Neutrino Observatory (INO) [1], the proposed underground laboratory
facility in India will host a magnetized Iron CALorimeter (ICAL) to conduct precise measurements
of neutrino oscillation related parameters by studying atmospheric neutrinos. A stack of
Resistive Plate Chambers (RPC) in the ICAL detector will provide the timing and 3D spatial
information of passing muons, produced in the interaction of the atmospheric neutrinos with the
iron layers. About 30,000 RPCs of dimension 2 m 2 m will be deployed in the ICAL setup.
In the last few years, a good amount of R&D effort has been delivered on various issues related to
the performance optimization of ICAL. An observation of reduced response towards the edges and
corners of the RPC [2] has been regarded as a major motivation for
the present work.
Numerical simulation is a good tool to investigate the different processes behind the operation
of the detector to analyze the experimental results. This can also be used to optimize different
design parameters to improve the detector performance. In the present study, the signal induced
on the readout strips for the passage of muons through the RPC has been simulated. To study the effect
of the device geometry, the signal has been computed at different regions of the device for different
voltages. Some of the results have been compared to actual measurements to validate the calculation
procedure. An appropriate approach for this study would be to find out the signal in the presence of a
dynamic electric field as the space charges created in the avalanche process tend to modify it [3].
Also the time dependence of the electric field owing to the finite bulk resistivity of the RPC plate
should be taken into account in order to carry out an extensive signal simulation. However, the
present work involves calculations assuming a static electric field configuration
where the RPC is described as a multi-dielectric planar capacitor.
Accurate timing information from the RPC layers of the ICAL setup will help identifying the direction of
the passing muon tracks. The parameters of importance in the timing performance of RPC are the
average signal arrival time and the time resolution, which in turn rely upon the electric field configuration
of the device and the gas mixture used.
In this work, the variation of timing properties of a RPC with the applied voltage has been studied.
In order to study the effects of the device, the simulation has been carried out generating
the timing response for several critical regions. The dependence on the gas mixture has been
investigated through simulations with different SF6 concentrations. This component of the
gas mixture is known to be important for restricting the streamer mode activity. The results have
been compared to measurements wherever available.
The experimental setup and a brief description of the numerical methods are presented
in section 2.
Section 3 is dedicated to the discussion of the results and the final remarks
are made in section 4.
2 Experiment and Simulation Methodologies
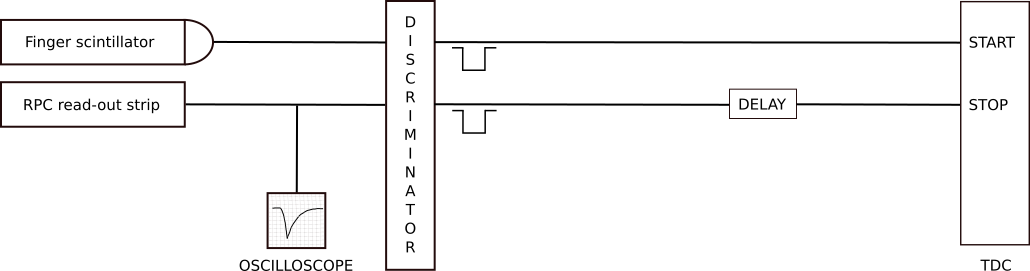
One bakelite RPC of dimension 30 cm 30 cm with 2 mm gas gap has been operated with a gas mixture of R-134A and Isobutane in 95 : 5 ratio. The schematic diagram of the experimental setup used for carrying out the measurements of the RPC and timing properties is shown in figure 1. A finger scintillator of width 4 cm has been placed aligned with one of the RPC readout strips.
In our numerical simulation, a bakelite RPC of dimension 30 cm 30 cm has been modelled as
described in [4]. The Garfield [5] simulation framework has been
used to calculate the signal and timing properties of RPC along with its toolkits like neBEM [6],
HEED [7] and Magboltz [8] performing different stages of the calculation.
neBEM is used to calculate the electrostatic field map, while HEED computes the
primary ionization produced by the relativistic charged particles in the gas mixture. The transport
properties of electrons in the gas mixture are generated by Magboltz and finally Garfield simulates
the drift of primary and avalanche electrons to produce the current induced on readout strips due
to the movement of this charge cloud. The field in the gas chamber has been produced by applying
bias voltage across the readout panels, to overcome some technical restrictions discussed
in [4].
The timing properties of the RPC have been computed by passing 2 GeV muons with incidence
angle varying randomly in the range 0∘ - 10∘ through a region away from any
imperfection (regular region). The passage of a muon track triggers an avalanche of electrons and
ions which move towards respective electrodes and induce currents on the readout strips. The current
signals for the passage of 5000 muons have been calculated using Garfield.
The average signal arrival time and the time resolution were determined as the mean and RMS,
respectively, of the distribution of the time corresponding to the crossing of 20% of the signal amplitude.
The same calculations have been performed setting different threshold values in the range 10% - 50%
of the signal amplitude. No significant dependence on the threshold value has been observed
except for a shift in the average signal arrival time towards higher values for higher thresholds, which
is obvious from the fact that higher current values appear at a later time. Small fluctuations in the
currents have been observed at very small values of time which has been avoided by using an
optimum threshold set to 20% of signal amplitude.
In the present study, no effect of ion movements or electronics has been considered.
3 Result
3.1 RPC Signal
A typical signal waveform as seen on an oscilloscope, due to the passage of muons through the
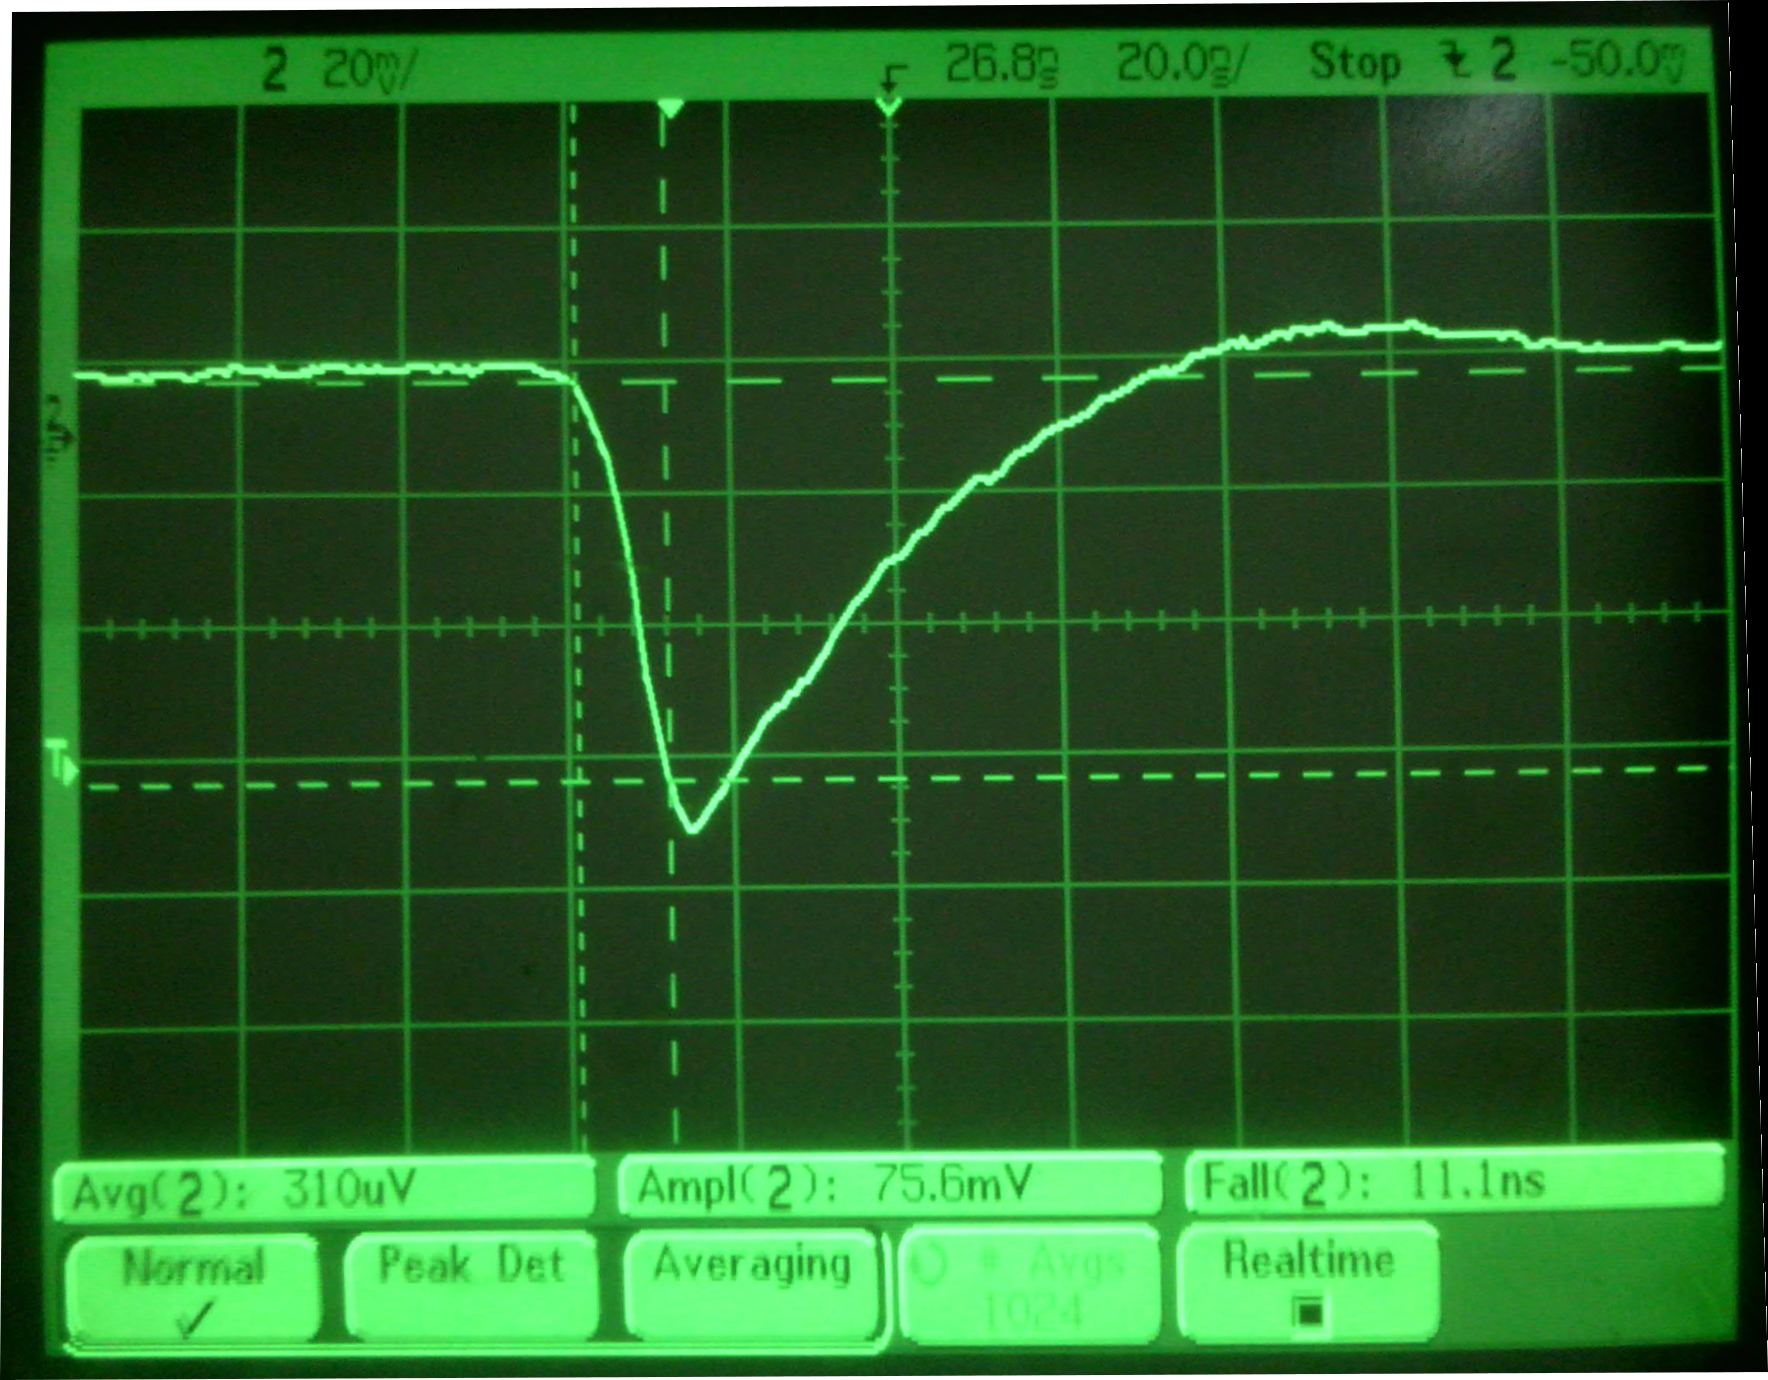
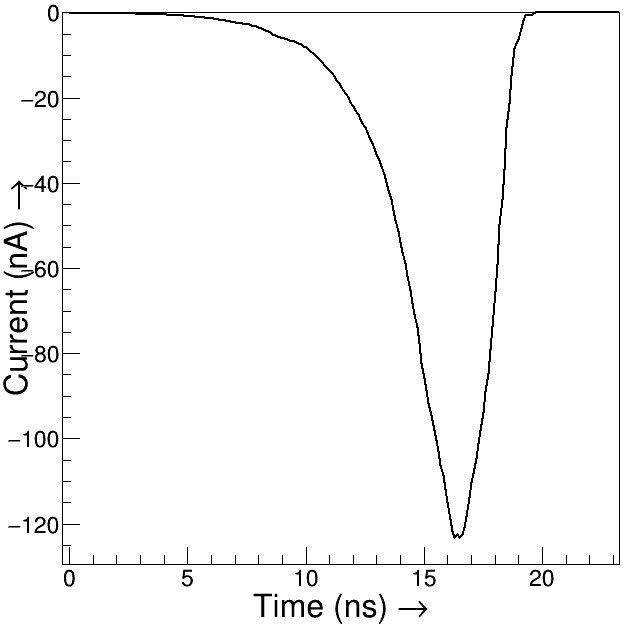
RPC is shown in figure 2. Figure 2 shows a typical signal waveform as calculated numerically for the passage of 2 GeV muons at an angle 5∘ with the vertical direction.
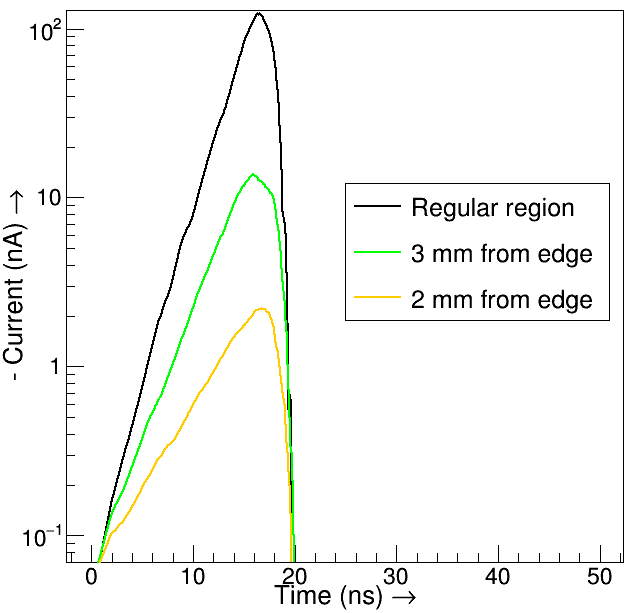
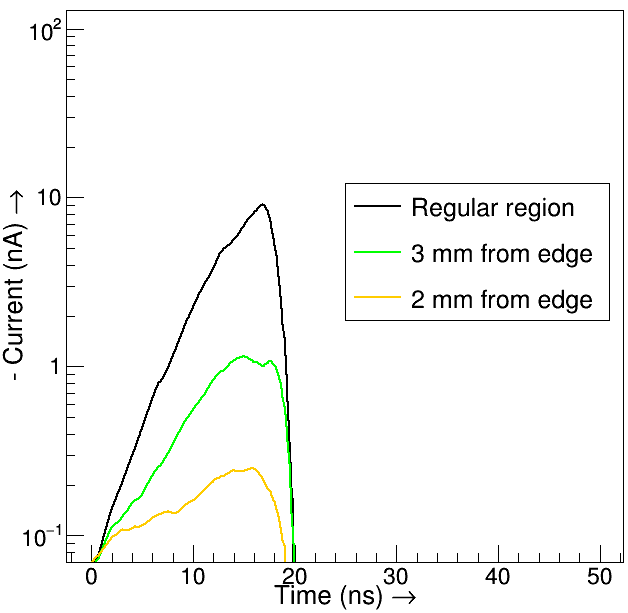
As neither the effect of ion movement nor the electronics have been taken into account, only the rising edge of the signal of 7 ns has been compared with the experimental form with a rise time of 11 ns. To see the effect of edge spacers, 100 muons with 2 GeV energy have been sent through a regular region and regions near the edge. The waveform of signals averaged over the 100 events in those regions have been calculated and are shown in figure 3 for two different voltages. It can be seen that the amplitude of the signal falls as one approaches the edge spacer which is obvious as the electric field suffers from an edge effect [4]. Consequently, the loss of response at those regions can lead to less efficient or dead regions near the edges of the RPC.
3.2 RPC Timing Properties
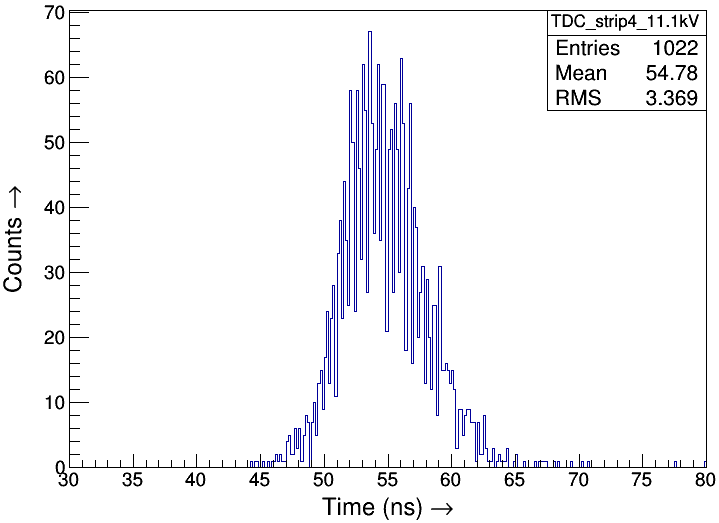
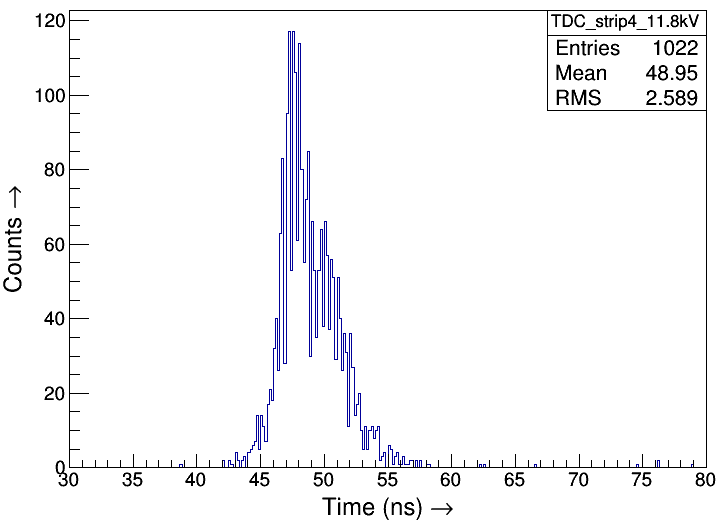
The typical TDC spectra measured for two different voltages are shown in figure 4. The mean and the RMS values of the histogram give the average signal arrival time and the time resolution respectively.
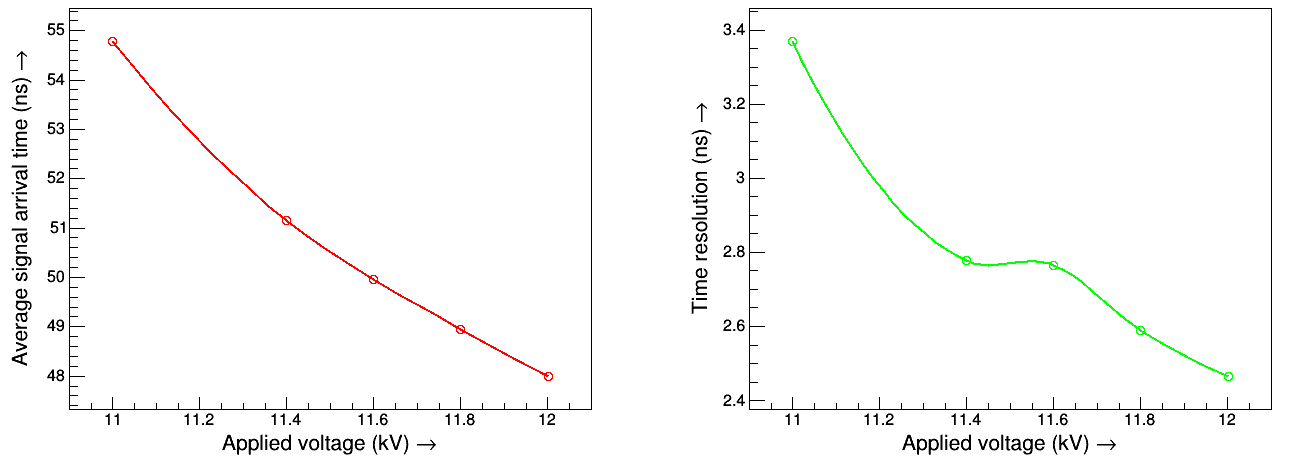
The variation of average signal arrival time and time resolution with the applied voltage is shown in figure 5. The numerical calculation of the same quantities is shown in figure 6.

Both the average signal arrival time and time resolution of the RPC decrease with increasing field, as the values of the drift velocity of electrons (Vz) and the effective Townsend co-efficient increase with the field, which follows from the relation of time resolution to these parameters discussed in [9]. The variation of these two gas parameters for the gas mixture R-134A : Isobutane = 95 : 5 with the increase in electrostatic field, as calculated using Magboltz is shown in figure 7.
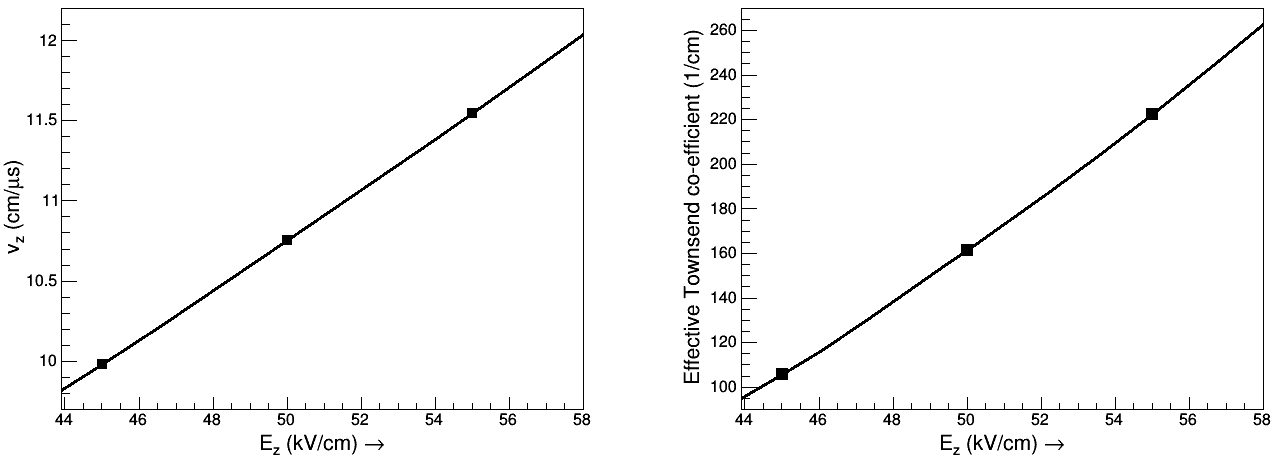
To see the effect of different geometrical components on the timing properties, a simplified approach has been taken where their effect on the drift of electrons has been determined. Electrons have been released at different regions, all at a fixed distance (1.7 mm) from the bakelite plate on the side of anode and the time taken by them to reach the anode has been filled in a histogram. This calculation has been done keeping the applied voltage constant for which the value of Ez at a regular position is 42.76 kV/cm.
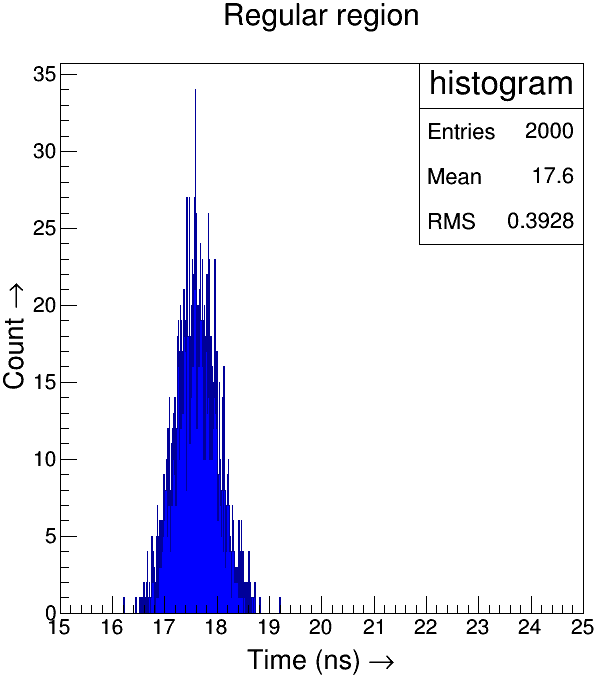
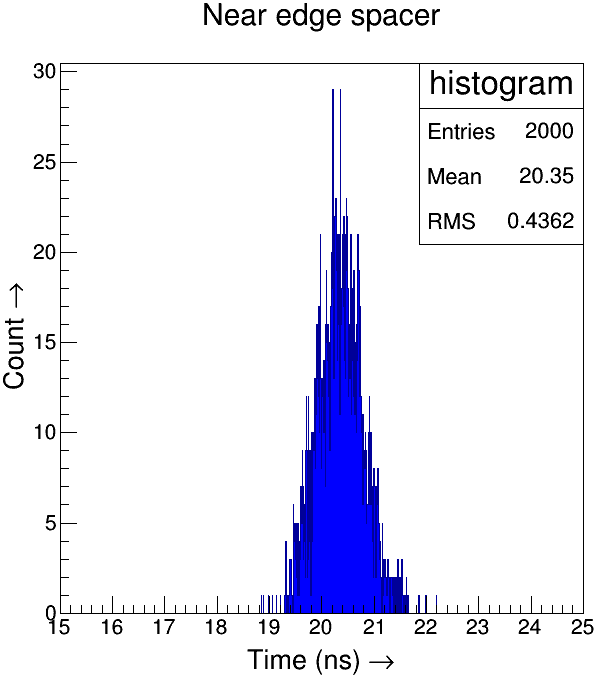
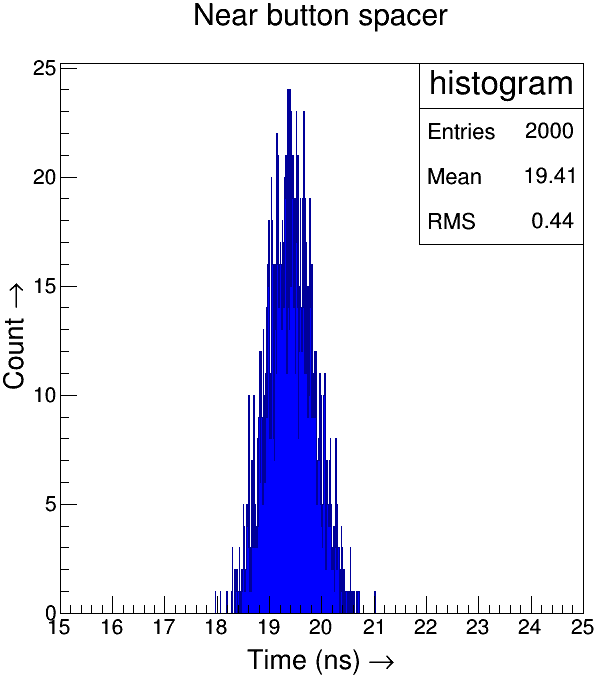
The histograms of electron drift times for different regions are shown
in figure 8. The mean of each distribution gives the average time taken by the electrons to reach the plate on which
voltage of positive polarity has been applied. From the three histograms it can be seen that the
electrons at 1 mm away from the edge spacer (Ez = 36.02 kV/cm) take about 3 ns longer time
whereas, the electrons at 200 m away from the corner of the pedestal part of the button spacer
(Ez = 35.72 kV/cm) take about 2 ns more in comparison to those drifting in the regular region.
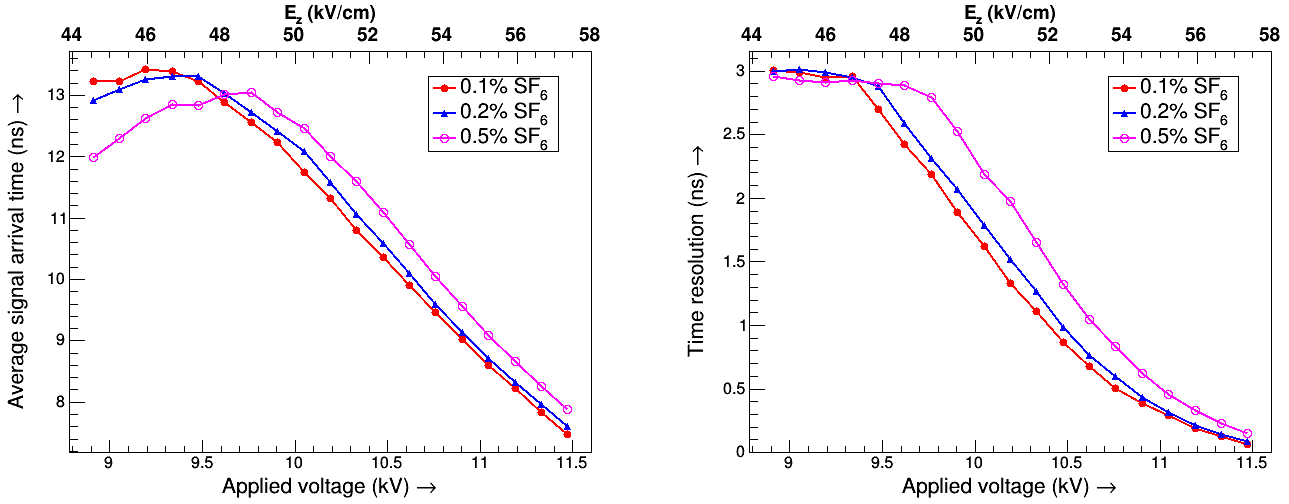
To see the effect of SF6 on the timing properties, the same calculations have been performed
for the gas mixtures R-134A : Isobutane : SF6 = 95.0 : 4.5 (4.8, 4.9) : 0.5 (0.2, 0.1). The
variation of the two timing parameters with the applied voltage and the corresponding value of
Ez is shown in figure 9.
A higher value of both average signal arrival time and time resolution has been found for higher
amounts of SF6 in the gas mixture which is at par with our earlier work [10].
4 Conclusion
The reduction of signal amplitude as one approaches the edge spacer can be attributed to
the affected field configuration of those regions and will lead to loss of response decreasing the
effective active area of a RPC.
The trend of variation in signal arrival time and time resolution with the applied voltage in simulation
agrees with that obtained in experiment, although they differ quantitatively. Nevertheless, the
present simulation produces time resolution values close to the analytical estimates [9].
The simulation will be improved in the future by considering the real-life factors of an experiment,
to compare with the measurement. This will include the effect of movement of ions
and electronic impedance on the signal shape. We also plan to take the finite bulk resistivity
of the bakelite plates into account instead of treating them as perfect dielectrics.
Preliminary calculations have shown that electrons at the critical regions like near an edge or button
spacer, takes more time compared to a region away from any imperfections. This may
affect the timing response in those critical regions. The effect of these regions on the RPC time
resolution following the present method of calculation by considering a current threshold will be
investigated in the future.
The average signal arrival time has been found to increase with the amount of SF6 present
in the gas mixture. The present calculations have shown a deterioration in time resolution with
the increase in SF6 percentage.
Acknowledgments
We would like to acknowledge the fruitful discussions with the INO collaboration and thank Purba Bhattacharya for her suggestions with the numerical calculations and Meghna K.K. for her help in the experimental measurements. We also thank the reviewer of this paper and the Editor for their constructive suggestions and help in improving the quality of the paper.
References
-
[1]
ICAL collaboration
Physics Potential of the ICAL detector at the India-based Neutrino Observatory (INO), arXiv:1505.07380. -
[2]
M. Bhuyan et al.
Cosmic ray test of INO RPC stack, Nucl. Instr. Meth. A 661 (2012) S68. -
[3]
C. Lippmann and W. Riegler
Space charge effects in Resistive Plate Chambers, Nucl. Instr. Meth. A 517 (2004) 54-76. -
[4]
A. Jash et al.
Numerical studies on electrostatic field configuration of Resistive Plate Chambers for the INO-ICAL experiment, jinst 10 (2015) P11009. -
[5]
Garfield : Rob Veenhof
http://garfield.web.cern.ch/garfield. -
[6]
N. Majumdar and S. Mukhopadhyay
Simulation of 3D electrostatic configuration in gaseous detectors, jinst 2 (2007) P09006. -
[7]
I.B. Smirnov
Modeling of ionization produced by fast charged particles in gases, Nucl. Instr. Meth. A 554 (2005) 474-493. -
[8]
S.F. Biagi
Accurate solution of the Boltzmann transport equation, Nucl. Instr. Meth. A 273 (1988) 533. -
[9]
W. Riegler and C. Lippmann
Detailed models for timing and efficiency in resistive plate chambers, Nucl. Instr. Meth. A 508 (2003) 14-18. -
[10]
M. Salim et al.
Simulation of efficiency and time resolution of resistive plate chambers and comparison with experimental data, jinst 10 (2015) C04033.