Constraints on photoionization feedback from number counts of ultra-faint high-redshift galaxies in the Frontier Fields
Abstract
We exploit a sample of ultra-faint high-redshift galaxies (demagnified HST magnitude ) in the Frontier Fields clusters A2744 and M0416 to constrain a theoretical model for the UV luminosity function (LF) in the presence of photoionization feedback. The objects have been selected on the basis of accurate photometric redshifts computed from multi-band photometry including 7 HST bands and deep and IRAC observations. Magnification is computed on an object-by-object basis from all available lensing models of the two clusters. We take into account source detection completeness as a function of luminosity and size, magnification effects and systematics in the lens modeling of the clusters under investigation. We find that our sample of high- galaxies constrain the cut-off halo circular velocity below which star-formation is suppressed by photo-ionization feedback to km s-1. This circular velocity corresponds to a halo mass of and at and 10 respectively: higher mass halos can thus sustain continuous star formation activity without being quenched by external ionizing flux. More stringent constraints are prevented by the uncertainty in the modeling of the cluster lens, as embodied by systematic differences among the lens models available.
Subject headings:
dark ages, reionization, first stars — galaxies: high-redshift1. Introduction
The investigation of the reionization process and of the earliest phases of galaxy evolution are deeply connected. Star-forming galaxies are currently believed to be the sources of reionizing photons, with the bulk of the ionizing flux generated by objects at the faint end of the luminosity function (LF) (e.g. Bouwens et al., 2015a; Robertson et al., 2015; Finkelstein et al., 2015; Castellano et al., 2016b), although we cannot yet rule out a contribution from bright star-forming galaxies (Sharma et al., 2016) or AGNs (e.g. Giallongo et al., 2015; Yoshiura et al., 2016). Our understanding of the reionization epoch is currently limited by a poor knowledge on key physical quantities such as the escape fraction of ionizing photons (e.g. Khaire et al., 2015), the intrinsic ionizing budget (e.g. Stanway et al., 2016; Ma et al., 2016) and the cut-off of the UV LF at faint magnitudes (e.g. Bouwens et al., 2015a). The investigation of the LF cut-off is of particular interest because of its relation with star-formation and feedback processes in low mass halos.
Faint galaxies are hosted by low mass halos with shallow gravitational potentials: in the presence of an external ionizing flux their gas could be evaporated and the star formation quenched (e.g. Mesinger & Dijkstra 2008; Sobacchi & Mesinger 2013b, a; Hasegawa & Semelin 2013). This may eventually result in a reduction of the number of ionizing photons they emit, thus questioning their role in ionizing the IGM. The reionization process and its sources interplay with each other. Until now there is a lack of direct observations of such a picture.
The gravitational lensing provides us with the opportunity to investigate such faint galaxy populations. The Frontier Fields (FF) Survey provides the ideal context for such an investigation. The FF survey is an HST observing program targeting six galaxy clusters, and six parallel pointings at depths comparable to the Hubble Ultra Deep Field one. Thanks to magnification effects the FF survey enables the study of galaxies as intrinsically faint as those that will be detected by JWST in blank fields. In principle, the effect of feedback can be investigated through a direct derivation of the UV LF to look for a cut-off of the galaxy number density distribution. Here we take an alternative and more powerful approach described in Yue et al. (2014) (Y14 hereafter), namely a comparison between the observed number counts and those predicted by a theoretical model of formation and evolution of galaxies during the reionization epoch (Yue et al., 2016). As shown by Y14, such an approach is extremely sensible and enables constraints even from limited galaxy samples. We will exploit the technique outlined in Y14 using data from the first two Frontier Fields Abell-2744 (A2744 hereafter) and MACSJ0416.1-2403 (M0416).
Throughout the paper, observed and rest–frame magnitudes are in the AB system, and we adopt the -CDM concordance model (=0.308, = 0.692, =0.048, h=0.678, =0.815, =0.97, see Planck Collaboration et al. 2015).
2. The Frontier Fields dataset
We exploit the ASTRODEEP photometric redshift catalogs of A2744 and M0416 from Castellano et al. (2016a) (C16b hereafter) based on the multi-band photometry presented in Merlin et al. (2016) (M16 hereafter)111http://www.astrodeep.eu/frontier-fields/. We summarise here the information most relevant for the present work.
The catalogs include information for 10 passbands: the seven HST bands observed under the FF program (F435W, F606W, F814W, F105W, F125W, F140W and F160W) together with Hawk-I@VLT band and IRAC 3.6 and 4.5 m data. The typical depth in 2 PSF-FWHM apertures are (HST filters), (), (IRAC). The detection is performed on the F160W band ( hereafter) after applying a procedure (see M16) to remove foreground light both from bright cluster galaxies and the diffuse intra-cluster light (ICL). Low resolution and IRAC images have been processed with T-PHOT (Merlin et al., 2015). As shown in M16, this procedure enhances the detection of faint lensed galaxies, especially in the central regions of the clusters.
Photometric redshifts have been measured with six different techniques based on different codes and assumptions (see C16b). The FF sources are then assigned the median of the six available estimates in order to minimize systematics and improve the accuracy. In the cluster fields the typical accuracy found from a comparison with spectroscopic samples is . We successfully recover as high- sources most of the candidates known in the two fields (Laporte et al., 2014; Zitrin et al., 2014; Oesch et al., 2014; Zheng et al., 2014; Atek et al., 2015; Coe et al., 2015; McLeod et al., 2015; Ishigaki et al., 2015).
We assign magnification values to sources in our catalogs as estimated from the different lensing models of the two FF fields222http://www.stsci.edu/hst/campaigns/frontier-fields/Lensing-Models. We measure for each object the shear and mass surface density values at its position from the relevant maps and we use them to compute the magnification at the source photometric redshift.
2.1. High-redshift sample
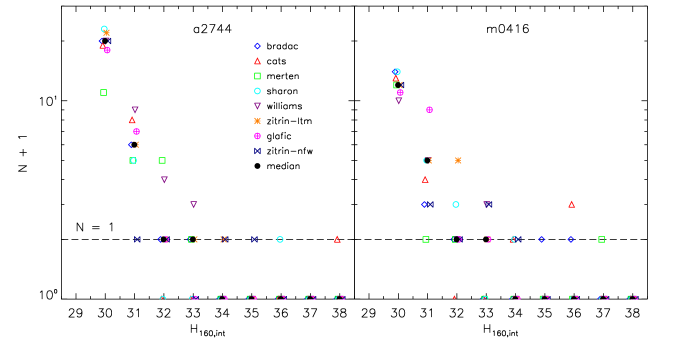
Following Y14 in this work we will consider objects at and with intrinsic magnitude fainter than . Such faint sources are typically hosted in halos of mass , corresponding to virial temperatures K, that are likely strongly affected by photoionization feedback (e.g. Dijkstra et al., 2004; Mesinger & Dijkstra, 2008, Y14). In Fig. 1 we show the number of galaxies with intrinsic in magnitude bins with width as obtained by demagnifing observed magnitudes following the different available lensing models in the two fields. The number of high- sources ranges from 19 to 32 in the A2744 field, and from 14 to 20 in the M0416 field, depending on the adopted lensing map. We find that most of these are faint 28-29 sources magnified by a factor with only a small fraction of the objects (%, depending on the model) being selected thanks to an extremely high magnification (). Objects at constitute the bulk of the sample outnumbering higher redshift sources by a factor of 7-8. The samples selected according to different models typically include different sources, with only about half of the objects being selected by 2 or more models in each field. Despite these differences, the number counts obtained from different lensing models show a similar behavior. In Sect. 4 we will describe the procedure we exploit to derive theoretical constraints while taking into account these discrepancies between different lensing models.
2.2. Completeness simulations
A critical ingredient for comparing predicted and observed number counts of ultra-faint lensed sources is the detection completeness as a function of the observed magnitude. As described in M16 we estimate completeness through imaging simulations with synthetic sources of different magnitudes and sizes. We consider both point-like and exponential profile sources with half-light radius arcsec, and total magnitude . We simulate sources per field. Two hundred mock galaxies each time are placed at random positions in our detection image which is then analysed using the same SExtractor parameters adopted in the real case. After the whole input galaxy population has been analysed we store the tabulated values of the completeness at different magnitudes and that will be used in Sect. 4 for comparing observation to our model. As a reference, the 90% detection completeness ranges from (=0.3 arcsec) to in the case of point-sources.
3. The model
We compare our observations to a theoretical model for the LF of high- galaxies in the presence of reionization feedback. The model extends the analytical algorithm described in Trenti et al. (2010); Tacchella et al. (2013); Mason et al. (2015) by additionally including the quenching of star formation activity in low mass halos that are located in ionized regions. Full details are presented in the above mentioned papers and in Yue et al. (2016), here we briefly summarize the main properties. The model relies on the assumption of a star formation efficiency which is a redshift-independent function of halo mass. Halos with the same final mass can have different luminosities as a result of different mass assembly histories. The star formation efficiency parameter is calibrated from the observed UV LFs and then used to model the LF at higher redshifts on the basis of the halo mass function and the above constructed luminosity - halo mass relations. As pointed out by Mason et al. (2015) this approach allows us to reproduce the observed high- LFs.
The effect of photoionization feedback on the star formation activity depends on the halo mass: 1) SFR is suppressed in halos with circular velocity below a given cut-off value () that form in already ionized regions; 2) star-formation can begin in halos with that formed in neutral regions but it is then quenched if their environment is ionized by neighboring galaxies; 3) star-formation proceeds uninterrupted as the host halos are massive enough () all the time. Using the “bubble model” based algorithm presented in Furlanetto et al. (2004) we model the above three cases to find the probability for a given halo to be located in an ionized bubble large enough to contain at least another persistent galaxy (i.e. always having ) and revise the halo star formation history described above accordingly. We eventually obtain the UV luminosity and emission rate of ionizing photons of a halo when its mass, formation time, star formation quench time are given. The model has two free parameters, the escape fraction of ionizing photons () and the above mentioned cut-off circular velocity , that provide a flexible way to model the interconnection between UV background and feedback effects on the star-formation. These two parameters are treated as independent of each other in our model: for each given pair of values we compute the reionization history and the resulting UV LFs in a self-consistent way (see Yue et al., 2016, for details).
As an effect of reionization feedback, the abundance of galaxies in halos with drops rapidly (although not necessarily monotonically). Interestingly, due to the extremely steep intrinsic UV LF faint-end, even a strong reionization feedback (i.e. high and ) is not enough to make the abundance drop to zero, such that faint galaxies with may still exist and be numerous even after reionization is completed. These galaxies can start their initial star formation activity at the formation time and are then quenched later on. They act as a fossil record of the reionization process: their abundance allows us to constrain the reionization history. Finally, we remark that our model assumes cosmology, and the abundance of low mass galaxies is consistently interpreted as affected by feedback effects on star-formation in low mass halos. However, modifications of the initial power spectrum as in WDM cosmologies can also affect number counts at the faintest end in a similar way (e.g. Barkana et al., 2001; Dayal et al., 2015; Menci et al., 2016).
4. Constraints on the LF cut-off
In this section we investigate the constraints we can put thanks to the FFs high- sample on the two free parameters in our model: and . We exploit Monte Carlo simulations to compute the probabilities to observe different number of galaxies once the LF is given. First, we have the mean number of galaxies in the effective volume behind one pixel in the lensing model,
| (1) |
where is the solid angle of this pixel, is the comoving distance and is the magnification. We then randomly generate an integer from a Poisson distribution with mean value , so there are galaxies in hand; each galaxy is assigned a redshift from the probability distribution , and then a luminosity from the probability distribution where is the theoretical LF for a given and (Yue et al., 2016). We assign to this galaxy a physical size that follows a log-normal distribution. As in Huang et al. (2013), the peak of the distribution is luminosity-dependent,
| (2) |
We take the best fitting parameters at (however parameters at yield similar results) in their Table 3; namely kpc, corresponding to an absolute magnitude , . The variance of the distribution is . The physical size at other redshifts is derived from a evolution. We verified that a different assumption on the evolution of size with redshift, as the found by Curtis-Lake et al. (2016), does not significantly affect the results. The last step is to include observational incompleteness on the basis of simulations described in Sect. 2.2. To this aim we find the apparent magnitudes for the above galaxies as and the observed angular sizes , where is the intrinsic magnitude and is the intrinsic angular size. The predicted number counts are then scaled on the basis of the estimated completeness level for galaxies of the given observed magnitude and size.
After the loop for all lensing pixels that are in the WFC3/HST field of view, one random realization is completed. For each lensing model we eventually make 30000 realizations. In the above algorithm, each pixel is treated as independent of each other, so if the effective volume of different pixels overlaps (as in the case of multiple images), galaxies in the overlapped volume are counted more than once. Therefore, when comparing simulated samples with observations, the number of images instead of the number of objects, should be compared, such that we are not interested in determining whether our high- samples include multiple images of the same observed source.
For a given pair of parameters and , we can now compute the probability to observe a number of galaxies in the i-th magnitue bin following the j-th lensing model. We can then build the mean probability across all eight lensing models available in each field:
| (3) |
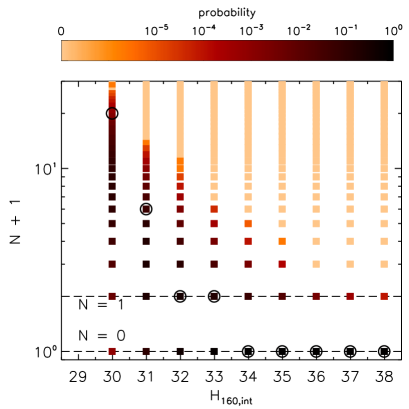
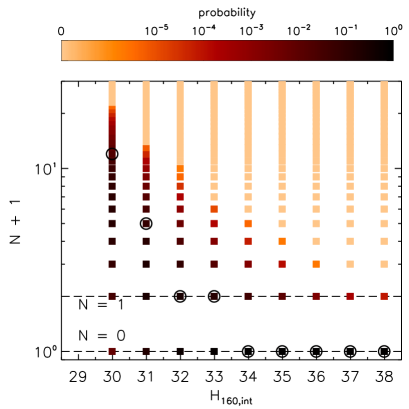
As an example, we show as a function of in Fig. 2 for the two fields A2744 and M0416 for the case when and km s-1 compared for reference to the median of the number counts computed from the different lensing models.
We compute the final likelhood assuming that the number counts in different magnitude bins are independent of each other. We also include an additional term to weight each model according to its consistency with the observed constraints on the CMB optical depth :
| (4) |
where
| (5) |
and is the Planck measurement (Planck Collaboration et al., 2015), and is theoretical optical depth which depends on the and (e.g. Shull & Venkatesan, 2008; Yue et al., 2016).
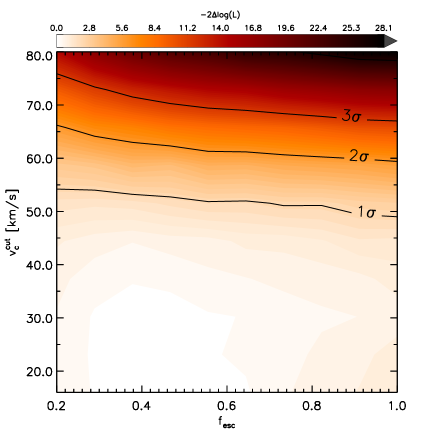
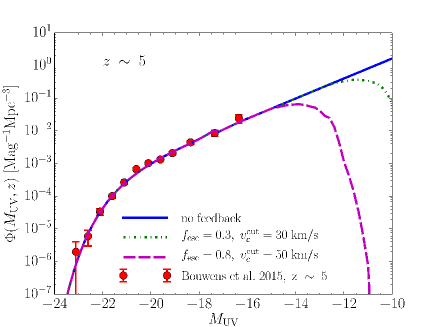
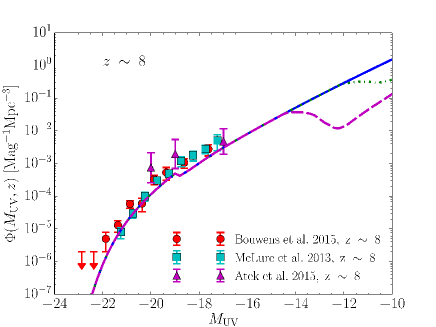
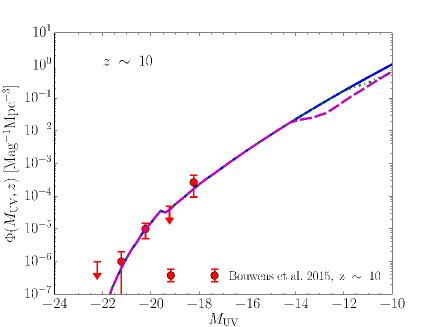
In Fig. 3 we plot the contour map of the constraints on and from the combination of the two clusters A2744 and M0416. The number of ultra-faint FF galaxies yields a limit of (1 on the cut-off circular velocity. In general terms, the number counts effectively constrain , while no constraints can be put on . Indeed, the dependence of the number counts on is mostly evident magnitudes fainter than the LF turn-over magnitude at all redshifts, and/or at magnitudes close to the LF turn-over during reionization (i.e. ), thus in a luminosity range which is not yet reached by current samples (see Yue et al., 2016, for details). The constraint we obtain on can be translated into and at and 10 respectively. In general, the smaller the halo mass is, the easier its star formation is quenched. Here what we get is the upper limit, above which one can safely say that halos can sustain continuous star formation. We verified that the inclusion in Eq. 4 of the consistency criterion with the measured CMB optical depth has a minor effect on the above constraints. We show in Fig. 4 the model UV luminosity functions at , , for reference values consistent with the limit we derived compared to the no-feedback case: the cut-off circular velocity corresponds to a UV cut-off which slightly depend on redshifts and roughly correspond to ( ) and ( ). To improve these constraints and observe the intrinsic decline of galaxy abundance due to reionization feedback an improvement of either the observational data or of the lensing models is needed. Our conclusions are robust against photometric redshift uncertainty: we found no appreciable change using different realizations of the high- sample obtained by randomly perturbing the photometric redshifts in the parent catalog according to the relevant uncertainty.
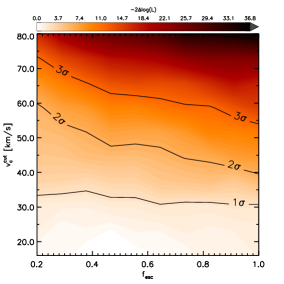
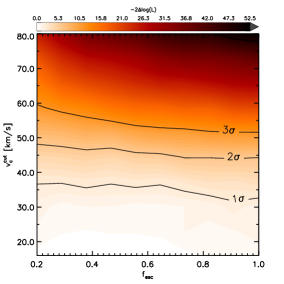
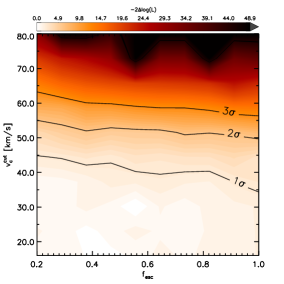
In Fig. 5 we show the contour maps obtained using three different lensing models that are available for both clusters. On the one hand, individual models yield constraints that are in overall agreement with those outlined above. On the other hand, our “global” approach is more conservative since looser constraints than from individual maps are obtained when systematics are taken into account. This shows that improving lensing models and understanding their underlying discrepancies provides the best way to improve this kind of analysis.
5. Summary and Conclusions
We have constrained our theoretical model (Sect. 3) for the LF at high redshift using a sample of ultra-faint () galaxies in the first two Frontier Fields clusters A2744 and M0416. The objects have been selected on the basis of their photometric redshift computed from 10-bands photometry from the F435W to IRAC 4.5m bands (Sect. 2). The comparison between theory and observations relies on the estimation of source detection completeness as a function of luminosity and size, and on taking into account systematics due to different lensing models. The free parameters of our model are the escape fraction of ionizing photons () and the cut-off circular velocity () below which star-formation is suppressed by photo-ionization feedback. We find that galaxy number counts yield constraints on the reionization feedback strength while they are nearly unaffected by . We found , corresponding to a halo mass and at and respectively and to . Our analysis shows that photoionization feedback does not quench star formation activity in halos with circular velocity above 50 , while present data do not allow us to pinpoint the threshold below which feedback is effective. We find that the uncertainty in the lensing models, as embodied by systematic differences between different maps, is the factor that most limits our capability in putting stringent constraints on the effects of feedback on the high-redshift LF.
References
- Atek et al. (2015) Atek, H. et al. 2015, ApJ, 800, 18, 1409.0512
- Barkana et al. (2001) Barkana, R., Haiman, Z., & Ostriker, J. P. 2001, ApJ, 558, 482, astro-ph/0102304
- Bouwens et al. (2015a) Bouwens, R. J., Illingworth, G. D., Oesch, P. A., Caruana, J., Holwerda, B., Smit, R., & Wilkins, S. 2015a, ApJ, 811, 140, 1503.08228
- Bouwens et al. (2015b) Bouwens, R. J. et al. 2015b, ApJ, 803, 34, 1403.4295
- Castellano et al. (2016a) Castellano, M. et al. 2016a, ArXiv e-prints, 1603.02461
- Castellano et al. (2016b) ——. 2016b, ApJ, 818, L3, 1601.03442
- Coe et al. (2015) Coe, D., Bradley, L., & Zitrin, A. 2015, ApJ, 800, 84, 1405.0011
- Curtis-Lake et al. (2016) Curtis-Lake, E. et al. 2016, MNRAS, 457, 440, 1409.1832
- Dayal et al. (2015) Dayal, P., Mesinger, A., & Pacucci, F. 2015, ApJ, 806, 67, 1408.1102
- Dijkstra et al. (2004) Dijkstra, M., Haiman, Z., Rees, M. J., & Weinberg, D. H. 2004, ApJ, 601, 666, astro-ph/0308042
- Finkelstein et al. (2015) Finkelstein, S. L. et al. 2015, ApJ, 810, 71, 1410.5439
- Furlanetto et al. (2004) Furlanetto, S. R., Hernquist, L., & Zaldarriaga, M. 2004, MNRAS, 354, 695, astro-ph/0406131
- Galametz et al. (2013) Galametz, A. et al. 2013, ApJS, 206, 10, 1305.1823
- Giallongo et al. (2015) Giallongo, E. et al. 2015, A&A, 578, A83, 1502.02562
- Guo et al. (2013) Guo, Y. et al. 2013, ApJS, 207, 24
- Hasegawa & Semelin (2013) Hasegawa, K., & Semelin, B. 2013, MNRAS, 428, 154, 1209.4143
- Huang et al. (2013) Huang, K.-H., Ferguson, H. C., Ravindranath, S., & Su, J. 2013, ApJ, 765, 68, 1301.4443
- Ishigaki et al. (2015) Ishigaki, M., Kawamata, R., Ouchi, M., Oguri, M., Shimasaku, K., & Ono, Y. 2015, ApJ, 799, 12, 1408.6903
- Khaire et al. (2015) Khaire, V., Srianand, R., Choudhury, T. R., & Gaikwad, P. 2015, ArXiv e-prints, 1510.04700
- Laporte et al. (2014) Laporte, N. et al. 2014, A&A, 562, L8, 1401.8263
- Ma et al. (2016) Ma, X., Hopkins, P. F., Kasen, D., Quataert, E., Faucher-Giguere, C.-A., Keres, D., & Murray, N. 2016, ArXiv e-prints, 1601.07559
- Mason et al. (2015) Mason, C., Trenti, M., & Treu, T. 2015, ArXiv e-prints, 1508.01204
- McLeod et al. (2015) McLeod, D. J., McLure, R. J., Dunlop, J. S., Robertson, B. E., Ellis, R. S., & Targett, T. A. 2015, MNRAS, 450, 3032, 1412.1472
- McLure et al. (2013) McLure, R. J. et al. 2013, MNRAS, 432, 2696, 1212.5222
- Menci et al. (2016) Menci, N., Sanchez, N. G., Castellano, M., & Grazian, A. 2016, ApJ, 818, 90, 1601.01820
- Merlin et al. (2016) Merlin, E. et al. 2016, ArXiv e-prints, 1603.02460
- Merlin et al. (2015) ——. 2015, A&A, 582, A15, 1505.02516
- Mesinger & Dijkstra (2008) Mesinger, A., & Dijkstra, M. 2008, MNRAS, 390, 1071, 0806.3090
- Oesch et al. (2014) Oesch, P. A., Bouwens, R. J., Illingworth, G. D., Franx, M., Ammons, S. M., van Dokkum, P. G., Trenti, M., & Labbe, I. 2014, ArXiv e-prints, 1409.1228
- Planck Collaboration et al. (2015) Planck Collaboration et al. 2015, ArXiv e-prints, 1502.01589
- Robertson et al. (2015) Robertson, B. E., Ellis, R. S., Furlanetto, S. R., & Dunlop, J. S. 2015, ApJ, 802, L19, 1502.02024
- Sharma et al. (2016) Sharma, M., Theuns, T., Frenk, C., Bower, R., Crain, R., Schaller, M., & Schaye, J. 2016, MNRAS, 1512.04537
- Shull & Venkatesan (2008) Shull, J. M., & Venkatesan, A. 2008, ApJ, 685, 1, 0806.0392
- Sobacchi & Mesinger (2013a) Sobacchi, E., & Mesinger, A. 2013a, MNRAS, 432, 3340, 1301.6781
- Sobacchi & Mesinger (2013b) ——. 2013b, MNRAS, 432, 51, 1301.6776
- Stanway et al. (2016) Stanway, E. R., Eldridge, J. J., & Becker, G. D. 2016, MNRAS, 456, 485, 1511.03268
- Tacchella et al. (2013) Tacchella, S., Trenti, M., & Carollo, C. M. 2013, ApJ, 768, L37, 1211.2825
- Trenti et al. (2010) Trenti, M., Stiavelli, M., Bouwens, R. J., Oesch, P., Shull, J. M., Illingworth, G. D., Bradley, L. D., & Carollo, C. M. 2010, ApJ, 714, L202, 1004.0384
- Yoshiura et al. (2016) Yoshiura, S., Hasegawa, K., Ichiki, K., Tashiro, H., Shimabukuro, H., & Takahashi, K. 2016, ArXiv e-prints, 1602.04407
- Yue et al. (2014) Yue, B., Ferrara, A., Vanzella, E., & Salvaterra, R. 2014, MNRAS, 443, L20, 1405.3440
- Yue et al. (2016) Yue, B., Ferrara, A., & Xu, Y. 2016, ArXiv e-prints, 1604.01314
- Zheng et al. (2014) Zheng, W. et al. 2014, ApJ, 795, 93, 1402.6743
- Zitrin et al. (2014) Zitrin, A. et al. 2014, ApJ, 793, L12, 1407.3769