Electronic structure of the high and low pressure polymorphs of MgSiN2
Abstract
We have performed density functional calculations on the group II-IV nitride MgSiN2. At a pressure of about 20 GPa the ground state wurtzite derived MgSiN2 structure (LP-MgSiN2) transforms into a rock-salt derived structure (HP-MgSiN2) in agreement with previous theoretical and experimental studies. Both phases are wide band gap semiconductors with indirect band gaps at equilibrium of 5.58 eV (LP-MgSiN2) and 5.87 eV (HP-MgSiN2), respectively. As the pressure increases, the band gaps become larger for both phases, however, the band gap in LP-MgSiN2 increases faster than the gap in HP-MgSiN2 and with a high enough pressure the band gap in LP-MgSiN2 becomes larger than the band gap in HP-MgSiN2.
I Introduction
The Group II-IV nitride semiconductors can be derived from Group III nitrides by substituting pairs of group III (Al, Ga or In) atoms for a single group II (Be, Mg, Ca, or Zn) atom and a single group IV (C, Si, Ge or Sn) atom. Depending on which combination of Group II and Group IV elements that is chosen the II-IV nitrides have possible applications ranging from solar cells to ultra violet light emitting diodes.Punya et al. In the case of MgSiN2 the substitution leads to an ordered wurtzite-like orthorhombic (space group Pna21, no. 33) crystal structure.David et al. (1970); Bruls et al. (2000) MgSiN2 has been found to possess many favourable physical properties, such as a high thermal conductivity, thermal stability and high hardness. It has also been found to have a large band gap, comparable to AlN.Quirk et al. (2014); de Boer et al. (2015) The band gap is indirectQuirk et al. (2014); de Boer et al. (2015) and has been measured to be 5.7(2) eVde Boer et al. (2015) in agreement with theoretical calculations.Quirk et al. (2014); de Boer et al. (2015) This value is about 1 eV larger than an earlier value of 4.8 eV obtained by Gaido et al.Gaido et al. (1974) using diffuse reflectance spectra. However, it is now clear from theory and experiment that the band gap of MgSiN2 is comparable in size to the band gap in wurtzite AlN.
It was predicted theoreticallyFang et al. (2004); Römer et al. (2009) and later confirmed experimentallyAndrade et al. (2011) that at the rather moderate pressure of about 25 GPa, MgSiN2 transforms from the low pressure (LP) orthorhombic phase, where all atoms are in a wurtzite-like surrounding, into a rhombohedral caswellsilverite (NaCrS2) structure type (space group Rm, no. 166), where all atoms are found in a rock-salt like octahedral surrounding.Römer et al. (2009); Andrade et al. (2011) Furthermore, the high pressure (HP) phase was found to be meta-stable at ambient conditions.Andrade et al. (2011) At present, there are a number of theoretical studies on the phase transition from orthorhombic to rhombohedral MgSiN2,Fang et al. (2004); Römer et al. (2009); Arab et al. (2016) however, an investigation of the electronic structure of the HP-phase in relation to LP-MgSiN2 has so far not been performed. The aim of the present study is, therefore, to investigate the electronic structure of HP-MgSiN2 in relation to LP-MgSiN2. In addition, we also provide results regarding the phase stability of the high and low pressure phases. For this reason we have performed density functional calculations using a range of traditional density functional approximations as well as the hybrid density functional approximation of Heyd, Scuseria and Ernzerhof (HSE)Heyd et al. (2003, 2006). For orthorhombic MgSiN2, it has been shown that traditional exchange-correlation approximations give band gaps in the range of 4.1-4.6 eV.Huang et al. (2001); Fang et al. (1999, 2004) These values are in rather good agreement with the experimental value of Gaido et al.,Gaido et al. (1974) however, they are too small in comparison to the recent observation of 5.7(2) eV by de Boer et al.de Boer et al. (2015) As mentioned previously, recent calculations using hybrid density functional theory,Quirk et al. (2014) or the modified Becke-Johnson approximation,de Boer et al. (2015) provide larger band gaps in very good agreement with the measured band gap of de Boer et al. for the LP-phase of MgSiN2. This shows the importance of using approximations that are able to obtain reliable band structures and therefore to go beyond using standard local and semilocal density functional approximations for these types of materials.
i
II Details of the calculations
Density functional calculations have been performed using the projector augmented wave (PAW) methodBlöchl (1994) as implemented in the Vienna ab initio simulation package (VASP).Kresse and Furthmüller (1996); Kresse and Joubert (1999) We have made use of the local density approximation (LDA) and two types of generalised gradient approximations, namely PBEPerdew et al. (1996) and PBEsolPerdew et al. (2008). Since we are interested in an accurate determination of the electronic properties, an accurate determination of the band gap in particular, in addition to structural and energetic properties, we have also made use of the hybrid density functional approximation of Heyd, Scuseria and Ernzerhof (HSE).Heyd et al. (2003, 2006) The HSE approximation has been found to significantly improve the accuracy of calculated band gaps compared to local and semi-local density functional approximations,Heyd et al. (2003, 2006); Paier et al. (2005); Matsushita et al. (2011) while providing accurate energeticsPaier et al. (2005) and structural properties.Paier et al. (2005); Råsander and Moram (2015) The HSE approximation depends on two parameters and , where determines the amount of Hartree-Fock exchange that is being used and determines the spatial range over which the non-local exchange is important. Here we used the usual value for of 0.25, while the screening parameter was set to 0.2 Å-1.Heyd et al. (2006); Paier et al. (2005) This combination is often presented as HSE06.
The plane wave energy cut-off was set to 800 eV and we have used -centered k-point meshes with the smallest allowed spacing between k-points of 0.1 Å-1 (0.4 Å-1 when using the HSE approximation). The atomic positions and simulation cell shapes were relaxed until the Hellmann-Feynman forces acting on atoms were smaller than 0.001 eV/Å. In order to calculate the physical properties of the two phases for different pressures, we applied a series of pressures from 0 to 30 GPa and for each pressure we allowed the lattice constants and atomic coordinates to relax until the above mentioned condition on the Hellmann-Feynman forces were met. Hence, we have not used any fitting to an analytical equation of state. In the case of Mg, we have made use of PAW potentials that have the Mg 2p semicore states treated in the valence whenever the LDA, PBE and PBEsol approximations have been used. In general, the difference between treating the Mg 2p states in the valence or as cores states is small. When using the HSE approximation, the Mg 2p states have not been treated as valence states. For Si and N the standard valence treatment has been used for all exchange-correlation approximations.
| (Å) | (Å) | (Å) | |
| LDA | 5.240 | 6.419 | 4.957 |
| PBE | 5.314 | 6.507 | 5.033 |
| PBEsol | 5.280 | 6.480 | 4.999 |
| HSE | 5.264 | 6.443 | 4.978 |
| Expt.Bruls et al. (2000) | 5.27078(5) | 6.46916(7) | 4.98401(5) |
| Expt.Quirk et al. (2014) | 5.314 | 6.466 | 4.975 |
| LDA | |||
| Mg | 0.0838 | 0.6228 | 0.9884 |
| Si | 0.0707 | 0.1255 | 0.9999 |
| N(1) | 0.0491 | 0.0959 | 0.3479 |
| N(2) | 0.1084 | 0.6551 | 0.4098 |
| PBE | |||
| Mg | 0.0847 | 0.6228 | 0.9886 |
| Si | 0.0698 | 0.1254 | 0.0001 |
| N(1) | 0.0480 | 0.0952 | 0.3467 |
| N(2) | 0.1097 | 0.6558 | 0.4107 |
| PBEsol | |||
| Mg | 0.0840 | 0.6227 | 0.9883 |
| Si | 0.0701 | 0.1255 | 0.0000 |
| N(1) | 0.0481 | 0.0955 | 0.3473 |
| N(2) | 0.1090 | 0.6556 | 0.4105 |
| HSE | |||
| Mg | 0.0846 | 0.6228 | 0.9881 |
| Si | 0.0701 | 0.1255 | 0.0000 |
| N(1) | 0.0485 | 0.0954 | 0.3472 |
| N(2) | 0.1093 | 0.6555 | 0.4106 |
| Expt.Bruls et al. (2000) | |||
| Mg | 0.08448(34) | 0.62255(30) | 0.9866(5) |
| Si | 0.0693(5) | 0.1249(4) | 0.0000 |
| N(1) | 0.04855(17) | 0.09562(15) | 0.3472(4) |
| N(2) | 0.10859(18) | 0.65527(14) | 0.4102(4) |
III Structural properties
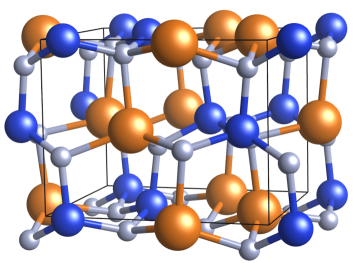
LP-MgSiN2 has an orthorhombic crystal structure, illustrated in Fig. 1, which can be described as a superlattice of the wurtzite crystal structure with the -axis being common to both lattices. It has 4 formula units of MgSiN2 per unit cell. The positions of the four types of atoms (Mg, Si, and two types of N positions) depend on the general coordinates . We follow the normal lattice vector convention for these materials such that . Note that in general for orthorhombic structures the convention is to have .Setyawan and Curtarolo (2010) However, our choice assures that remains common with the -axis in the wurtzite crystal structure. This choice will affect the labels of high symmetry points in the Brillouin zone when comparing results obtained using the two different conventions.
The calculated structural properties of LP-MgSiN2 are shown in Table 1. As can be seen, the calculated lattice constants and atomic positions are in very good agreement with available experimental structures, with deviations in the lattice constants of about 1% or better, as expected for these exchange-correlation approximations.Råsander and Moram (2015)
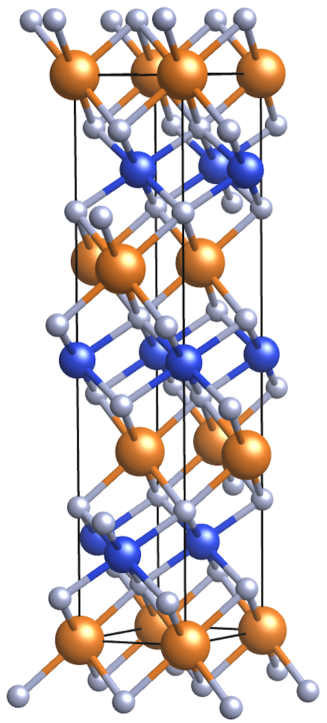
The high pressure phase has a rhombohedral structure, illustrated in its hexagonal representation in Fig. 2, where Mg and Si occupies the 3a and 3b positions with coordinates and , respectively. N occupies the 6c positions with coordinate . The calculated structural parameters are shown in Table 2. Once again, the agreement between theory and experiment is very good with an error in the lattice constants smaller than 1%.
| (Å) | (Å) | |||
|---|---|---|---|---|
| LDA | 2.810 | 14.461 | 5.147 | 0.2369 |
| PBE | 2.852 | 14.699 | 5.154 | 0.2366 |
| PBEsol | 2.833 | 14.604 | 5.155 | 0.2367 |
| HSE | 2.817 | 14.510 | 5.151 | 0.2367 |
| Expt.Andrade et al. (2011) | 2.8383(3) | 14.558(2) | 5.129(1) | 0.2385(3) |
IV Phase stability
We have evaluated the relative stability of MgSiN2 under pressure by calculating the enthalpy, , as
| (1) |
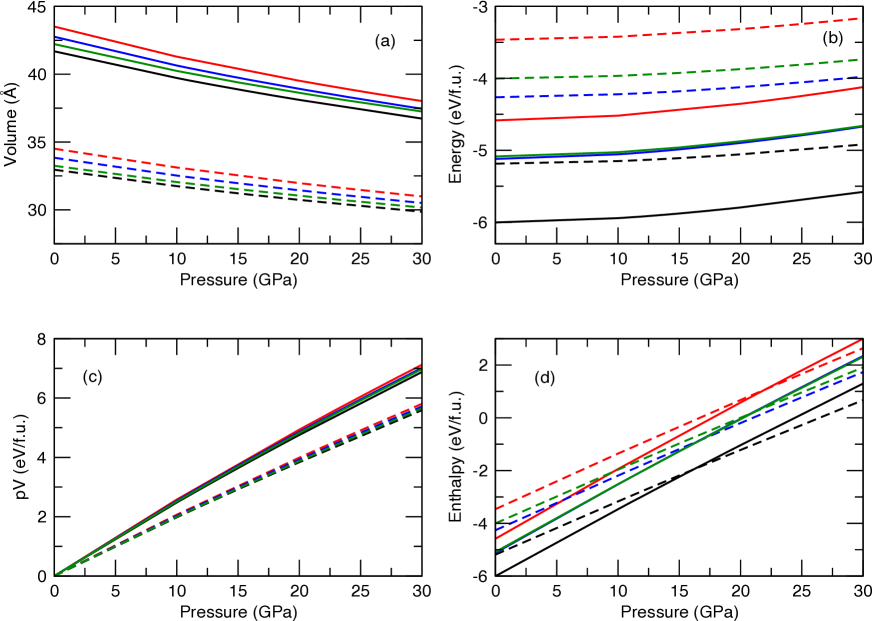
where is the total energy and is the volume of the system, for each phase at pressures () between 0 and 30 GPa for both phases of MgSiN2. In Fig. 3 we show the calculated volumes, total energies, pressure-volume () terms, and enthalpies for the two phases. All energies are shown with respect to each elements standard reference state at and have been evaluated as
| (2) |
where , and are the energies of hexagonal close-packed Mg, diamond structured Si and the N2 molecule, respectively, and is the energy of of one formula unit of MgSiN2 . In addition, we provide in Fig. 4 the calculated differences in the enthalpies, total energies, and pressure-volume terms between the two MgSiN2 phases. The enthalpy of both phases, shown in Fig. 3, shows an almost linear increase with pressure. Initially, the enthalpy is lower for the LP-phase than for the HP-phase. The enthalpy difference at is 0.82 eV (LDA), 1.12 eV (PBE), 0.86 eV (PBEsol) and 1.08 eV (HSE), which is in agreement with previous studies.Römer et al. (2009); Arab et al. (2016) When the pressure increases, the enthalpy of the HP-phase increase slower compared to the LP-phase and a phase transition occurs at 16 GPa (LDA), 22 GPa (PBE), 16.5 GPa (PBEsol) and 21 GPa (HSE), when the rhombohedral phase has the lower enthalpy, which is clearly shown in Figs. 3 and 4. Römer et al. found the transition to occur at 25 GPa using PW91,Römer et al. (2009) Fang et al. reported the transition to occur at 16.5 GPa using the LDA,Fang et al. (2004) while Arab et al.Arab et al. (2016) recently found the transition pressure to be 25 GPa, 17.45 GPa and 19.05 GPa using the PW91, PBEsol and LDA approximations, respectively. The experimentally evaluated transition pressure is 27 GPa.Andrade et al. (2011) Our calculations are therefore in good agreement with previous theoretical studies as well as with available experiments. Note that none of the mentioned calculations (including our results) include any temperature effects and that the experimental transition pressure was obtained using a high temperature (exceeding 2000 KAndrade et al. (2011)). A perfect agreement with experiment would therefore be coincidental.
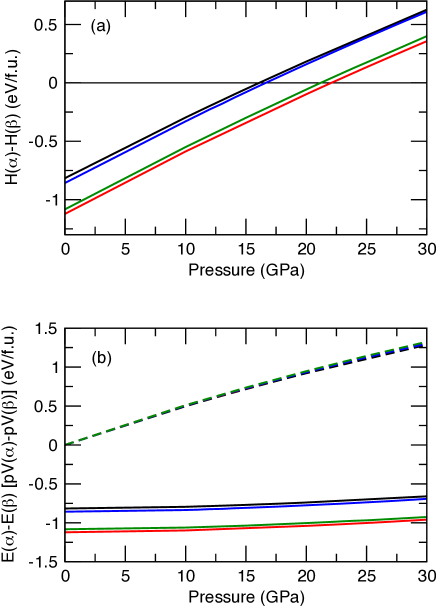
We note that the evaluated phase transition pressures follow the calculated enthalpy differences between the LP- and HP-phases at , since a larger evaluated enthalpy difference at provides a higher transition pressure and vice versa. This behaviour can be explained by analysing the difference in enthalpy, total energy and pressure-volume characteristics between the LP- and HP-phases, which is shown in Fig. 4. As can be seen in Fig. 4, the difference in total energy varies slightly with pressure and always shows a lower energy for the LP-phase irrespective of the exhange-correlation approximation. The difference in the pressure-volume term of Eqn. (1) show a much larger increase with pressure, but hardly any difference between using the different exchange-correlation approximations. The reason for the phase transition is therefore to be found in the contribution to the enthalpy due to the pressure-volume characteristics of the two phases, which is clearly illustrated in Fig. 4. The HP-phase has a much smaller volume than the LP-phase, which gives a smaller -contribution to the enthalpy of the HP-phase and lower increase of the enthalpy with pressure compared to the LP-phase.
V Electronic structure
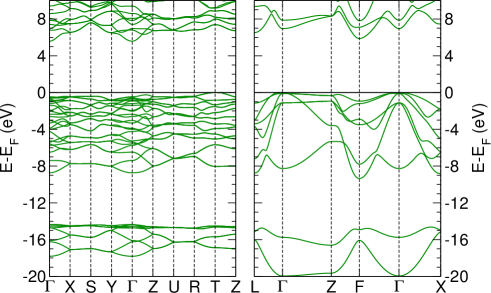
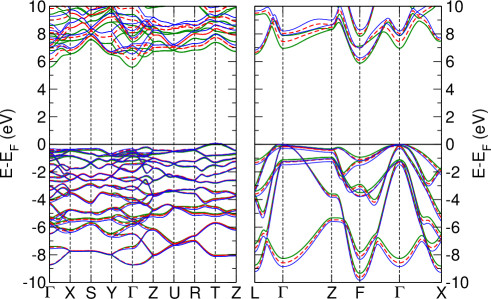
In Fig. 5 we show the calculated ground state band structures obtained using the HSE approximation. LP-MgSiN2 has a large indirect band gap of 5.58 eV in agreement with experimental observations.de Boer et al. (2015) The valence band maximum (VBM) is positioned at the T-point and the conduction band minimum (CBM) is found at the -point. The VBM is doubly degenerate and the CBM is non-degenerate. The CBM at the -point extends more than 1 eV lower than the other conduction band states at higher energies. We note that the main features of the band structure are very similar when comparing the LDA, PBE, PBEsol and HSE approximations, apart from the size of the band gap which is found to be 4.31 eV, 3.95 eV and 4.02 eV for the LDA, PBE and PBEsol approximations, respectively, and therefore significantly smaller for the local and semilocal approximations compared to the HSE approximation.
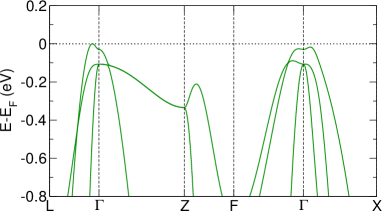
The band gap of the HP-phase within the HSE approximation is 5.87 eV while the LDA, PBE and PBEsol band gaps are 4.37 eV, 4.16 eV and 4.25 eV, respectively. The VBM is found slightly off the -point towards the L-point, with the Brillouin zone coordinates , with . Furthermore, we note that the highest valence band increases its energy when moving from the -point towards the L-, F- and X-points, where local maximas are found slightly off the -point in all directions, while the energy of the band decrease when moving from the -point towards the Z-point. We note that the energies of the highest valence band at the two local maximas along -L and -X are very similar. This is shown more clearly in Fig. 6 where the band structure close to the Fermi level of HP-MgSiN2 is shown. Furthermore, we also find that the band gap of the HP-phase is indirect with the CBM at the F-point.
We note that HP-MgSiN2 has a larger band gap in the ground state compared to the LP-phase; the difference is 0.29 eV as obtained by the HSE approximation. In Fig. 7, we show the calculated energy bands as a function of pressure. When the pressure increases the valence and conduction bands become more separated and consequently the band gaps increase with pressure. Furthermore, the band gap in the low pressure phase increases more with pressure than the high pressure phase. This change is largely due to the CBM at the -point in the LP-phase rising compared to the other conduction bands and becoming more or less degenerate with the other conduction bands at higher pressures. In the HP-phase the conduction bands move more collectively away from the valence bands as the pressure increases. As a consequence, the band gap in the LP-phase becomes larger than in the HP-phase. This change occur well below the phase transition pressure of the system, since it is found already for GPa, as shown in Fig. 7.
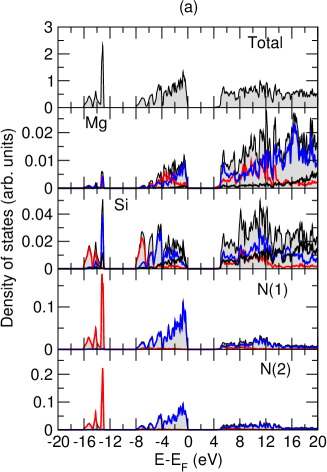
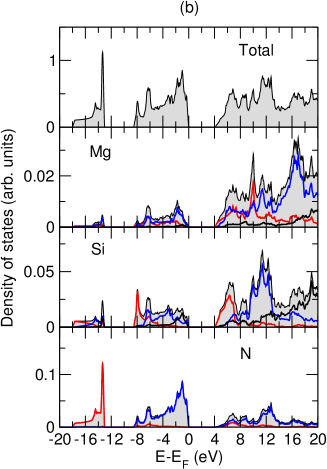
In Fig. 8, we show the calculated density of states (DOS) of LP- and HP-MgSiN2 as obtained within the PBE approximation. Beginning with the LP-phase, we find that states close to the Fermi-level are dominated by N. In the region between -8 eV to the Fermi-level, the N states are completely dominated by N p-states. These states are to a large part mixed with Mg and Si p-states. However, there are contributions coming from N p-states mixed with Mg and Si s-states and also some Mg and Si states with d-character are mixed with the N p-states in the upper part of the valence band. In the lower part of the valence band between -16 eV and -13 eV, the N states have s-character. These states are mixed with Mg and Si s- and p-states. Overall, the features in the DOS of the LP-phase is similar to the DOS of wurtzite AlN.Quirk et al. (2014)
For the HP-phase, we find a rather similar DOS as for the LP-phase, even though the atoms are now six-fold coordinated in contrast to the four-fold coordinated LP-phase. Compared to the DOS of the LP-phase the valence bands in the HP-phase are wider, especially the lower valence band region which contain N s-states mixed with Mg and Si s- and p-states are found between -18 eV and -13 eV. In the region between -8 eV and the Fermi-level we find, as in the LP-phase, N p-states mixed with Mg and Si s-, p- and d-states.
VI Conclusions
In conclusion, we have calculated the phase stability under pressure of two MgSiN2 phases and found that there is a phase transition at a pressure of about 20 GPa, from the ground state orthorhombic phase (space group Pna21) to the high pressure phase of rhombohedral geometry (space group Rm) in agreement with previous theory and experiment. We note that the difference obtained using various approximations for the exchange-correlation energy for the phase transition pressure depends strongly on the total energy difference at . If the difference in energy for a specific XC approximation between LP- and HP-phases at is large this moves the phase transition pressure towards higher pressures and vice versa.
The electronic structures of these two phases have been calculated using hybrid density functional theory. Both phases are wide band gap semiconductors with indirect band gaps. For the ground states the HP-phase has a larger gap of 5.87 eV while the LP-phase has a gap of 5.58 eV. However, as the pressure increases the order is shifted and at the transition pressure the LP-phase has the larger band gap. This change is due to the CBM in the LP-phase becoming aligned with other higher energy conduction bands, while the conduction bands in the HP-phase shifts away from the valence bands more collectively.
VII Acknowledgements
We acknowledge support from the Leverhulme Trust via M. A. Moram’s Research Leadership Award (RL-007-2012). M. A. Moram acknowledges further support from the Royal Society through a University Research Fellowship. This work used the Imperial College high performance computing facilities and, via our membership of the UK’s HEC Materials Chemistry Consortium funded by EPSRC (EP/L000202), the ARCHER UK National Supercomputing Service (http://www.archer.ac.uk).
References
- (1) A. Punya, T. R. Paudel, and W. R. L. Lambrecht, Phys. Status. Solidi C 8, 2492.
- David et al. (1970) J. David, Y. Laurent, and J. Lang, Bull. Société Fr. Minéralogie Cristallogr. 93, 153 (1970).
- Bruls et al. (2000) R. J. Bruls, H. T. Hintzen, R. Metselaar, and C.-K. Loong, J. Phys. Chem. Solids 61, 1285 (2000).
- Quirk et al. (2014) J. B. Quirk, M. Råsander, C. M. McGilvery, R. Palgrave, and M. A. Moram, Appl. Phys. Lett. 105, 112108 (2014).
- de Boer et al. (2015) T. de Boer, T. D. Boyko, C. Braun, W. Schnick, and A. Moews, Phys. Status Solidi RRL 9, 250 (2015).
- Gaido et al. (1974) G. K. Gaido, G. P. Dubrovskii, and A. M. Zykov, Izv. Akad. Nauk. SSSR Neorg. Mater 10, 564 (1974).
- Fang et al. (2004) C. M. Fang, H. T. Hintzen, and G. de With, Appl. Phys. A 78, 717 (2004).
- Römer et al. (2009) S. R. Römer, P. Kroll, and W. Schnick, J. Phys.: Condens. Matter 21, 275407 (2009).
- Andrade et al. (2011) M. Andrade, D. Dzivenko, G. Miehe, R. Boehler, H. T. Hintzen, and R. Riedel, Phys. Status Solidi RRL 5, 196 (2011).
- Arab et al. (2016) F. Arab, F. A. Sahraoui, K. Haddadi, A. Bouhemadou, and L. Louail, Phase Transit. 89, 480 (2016).
- Heyd et al. (2003) J. Heyd, G. Scuseria, and M. Ernzerhof, J. Chem. Phys. 118, 8207 (2003).
- Heyd et al. (2006) J. Heyd, G. Scuseria, and M. Ernzerhof, J. Chem. Phys. 124, 219906 (2006).
- Huang et al. (2001) J. Y. Huang, L.-C. Tang, and M. H. Lee, J. Phys.: Condens. Mater. 13, 10417 (2001).
- Fang et al. (1999) C. M. Fang, R. A. de Groot, R. J. Bruls, H. T. Hintzen, and G. de With, J. Phys.: Condens. Mater. 11, 4833 (1999).
- Blöchl (1994) P. E. Blöchl, Phys. Rev. B 50, 17953 (1994).
- Kresse and Furthmüller (1996) G. Kresse and J. Furthmüller, Phys. Rev. B 54, 11169 (1996).
- Kresse and Joubert (1999) G. Kresse and D. Joubert, Phys. Rev. B 59, 1758 (1999).
- Perdew et al. (1996) J. P. Perdew, K. Burke, and M. Ernzerhof, Phys. Rev. Lett. 77, 3865 (1996).
- Perdew et al. (2008) J. P. Perdew, A. Ruzsinszky, G. I. Csonka, O. A. Vydrov, G. E. Scuseria, L. A. Constantin, X. Zhou, and K. Burke, Phys. Rev. Lett. 100, 136406 (2008).
- Paier et al. (2005) J. Paier, R. Hirschl, M. Marsman, and G. Kresse, J. Chem. Phys. 122, 234102 (2005).
- Matsushita et al. (2011) Y. I. Matsushita, K. Nakamura, and A. Oshiyama, Phys. Rev. B 84, 075205 (2011).
- Råsander and Moram (2015) M. Råsander and M. A. Moram, J. Chem. Phys. 143, 144104 (2015).
- Setyawan and Curtarolo (2010) W. Setyawan and S. Curtarolo, Comp. Mater. Sci. 49, 299 (2010).