Monte Carlo Confidence Sets for Identified Sets††thanks: We are grateful to K. Hirano and three reviewers, S. Bonhomme, and L. P. Hansen for insightful suggestions. We also thank T. Cogley, K. Evdokimov, H. Hong, B. Honoré, M. Keane, K. Menzel, M. Kolesár, U. Müller, J. Montiel Olea, T. Sargent, F. Schorfheide, C. Sims and participants at the 2015 ESWC meetings in Montreal, the September 2015 “Big Data Big Methods” Cambridge-INET conference, and workshops at many institutions for useful comments. We thank Keith O’Hara for his excellent RA work on the MCMC simulations and empirical results reported in the first version.
Abstract
In complicated/nonlinear parametric models, it is generally hard to know whether the model parameters are point identified. We provide computationally attractive procedures to construct confidence sets (CSs) for identified sets of full parameters and of subvectors in models defined through a likelihood or a vector of moment equalities or inequalities. These CSs are based on level sets of optimal sample criterion functions (such as likelihood or optimally-weighted or continuously-updated GMM criterions). The level sets are constructed using cutoffs that are computed via Monte Carlo (MC) simulations directly from the quasi-posterior distributions of the criterions. We establish new Bernstein-von Mises (or Bayesian Wilks) type theorems for the quasi-posterior distributions of the quasi-likelihood ratio (QLR) and profile QLR in partially-identified regular models and some non-regular models. These results imply that our MC CSs have exact asymptotic frequentist coverage for identified sets of full parameters and of subvectors in partially-identified regular models, and have valid but potentially conservative coverage in models with reduced-form parameters on the boundary. Our MC CSs for identified sets of subvectors are shown to have exact asymptotic coverage in models with singularities. We also provide results on uniform validity of our CSs over classes of DGPs that include point and partially identified models. We demonstrate good finite-sample coverage properties of our procedures in two simulation experiments. Finally, our procedures are applied to two non-trivial empirical examples: an airline entry game and a model of trade flows.
1 Introduction
It is often difficult to verify whether parameters in complicated nonlinear structural models are globally point identified. This is especially the case when conducting a sensitivity analysis to examine the impact of various model assumptions on the estimates of parameters of interest, where relaxing some suspect assumptions may lead to loss of point identification. This difficulty of verifying point identification naturally calls for inference procedures that are valid whether or not the parameters of interest are point identified. Our goal is to contribute to this sensitivity literature by proposing relatively simple inference procedures that allow for partial identification in models defined through a likelihood or a vector of moment equalities or inequalities.
To that extent, we provide computationally attractive and asymptotically valid confidence set (CS) constructions for the identified set of the full vector of parameters ,111Following the literature, the identified set is the argmax of a population criterion over the whole parameter space . A model is point identified if is a singleton, say , and partially identified if . and for the identified sets of subvectors . As a sensitivity check in an empirical study, a researcher could report conventional CSs based on inverting a or Wald statistic, which are valid under point identification only, alongside our new CSs that are asymptotically optimal under point identification and robust to failure of point identification.
Our CS constructions are criterion-function based, as in Chernozhukov et al. (2007) (CHT) and the subsequent literature on CSs for identified sets. That is, contour sets of the sample criterion function are used as CSs for and contour sets of the sample profile criterion are used as CSs for . However, our CSs are constructed using critical values that are calculated differently from those in the existing literature. In two of our proposed CS constructions, we estimate critical values using quantiles of the sample criterion function (or profile criterion) that are simulated from a quasi-posterior distribution, which is formed by combining the sample criterion function with a prior over the model parameter space .222In correctly-specified likelihood models the quasi-posterior is a true posterior distribution over . We refer to the distribution as a quasi-posterior because we accommodate non-likelihood based models, such as moment-based models with GMM criterions.
We propose three procedures for constructing various CSs. To construct a CS for the identified set , our Procedure 1 draws a sample from the quasi-posterior, computes the -quantile of the sample criterion evaluated at the draws, and then defines our CS for as the contour set at said -quantile. The computational complexity here is simply as hard as the problem of taking draws from the quasi-posterior, a well-researched and understood area in the literature on Monte Carlo (MC) algorithms in Bayesian computation (see, e.g., Liu (2004), Robert and Casella (2004)). Many MC samplers (including the popular Markov Chain Monte Carlo (MCMC) algorithms) could, in principle, be used for this purpose. In our simulations and empirical applications, we use an adaptive sequential Monte Carlo (SMC) algorithm that is well-suited to drawing from irregular, multi-modal (quasi-)posteriors and is also easily parallelizable for fast computation (see, e.g., Herbst and Schorfheide (2014), Del Moral et al. (2012), Durham and Geweke (2014)). Our Procedure 2 produces a CS for of a general subvector using the same draws from the quasi-posterior as in Procedure 1. Here an added computation step is needed to obtain critical values that guarantee the exact asymptotic coverage for . Finally, our Procedure 3 CS for of a scalar subvector is simply the contour set of the profiled quasi-likelihood ratio (QLR) with its critical value being the quantile of a chi-square distribution with one degree of freedom. Our Procedure 3 CS is simple to compute but is valid only for scalar subvectors.
Our CS constructions are valid for “optimal” criterions, which include (but are not limited to) correctly-specified likelihood models, GMM models with optimally-weighted or continuously-updated or GEL criterions,333Moment inequality-based models are special cases of moment equality-based models as one can add nuisance parameters to transform moment inequalities into moment equalities. Although moment inequality models are allowed, our criterion differs from the popular GMS criterion for moment inequalities in Andrews and Soares (2010) and others; see Subsections 3.1.1, 5.2.1 and 5.3.3. or sandwich quasi-likelihoods. For point- or partially-identified regular models, optimal criterions correspond to criterions that satisfy a generalized information equality. But our optimal criterions also allow for some correctly-specified non-regular (or non-standard) models such as models with parameter-dependent support, an important feature of set identified models (see Appendix E). Our Procedure 1 and 2 CSs, and , are shown to have exact asymptotic coverage for and in potentially partially identified regular models, and are valid but possibly conservative in potentially partially identified models with reduced-form parameters on the boundary (in which the local tangent space is a convex cone). Our Procedure 1 and 2 CSs are also shown to be uniformly valid over DGPs that include both point- and partially identified models (see Appendix B). Moreover, our Procedure 2 CS is shown to have exact asymptotic coverage for in models with singularities, which are particularly relevant in applications when parameters are close to point-identified or point-identified. Our Procedure 3 CS has exact asymptotic coverage in regular models that are point-identified444In fact, all three of our procedures are efficient in point-identified regular models.. Although theoretically slightly conservative in partially identified models, our Procedure 3 CS performs well in our simulations and empirical examples.
Our Procedure 1 and 2 CSs are Monte Carlo (MC) based. To establish their theoretical validity, we derive new Bernstein-von Mises (or Bayesian Wilks) type theorems for the (quasi-)posterior distributions of the QLR and profile QLR in partially identified models, allowing for regular models and some important non-regular cases (e.g. models in which the local tangent space is a convex cone, models with singularities, and models with parameter-dependent support). These theorems establish that the (quasi-)posterior distributions of the QLR and profile QLR converge to their frequentist counterparts in regular models; see Section 4 and Appendix E for similar results in some non-regular cases. As an illustration we briefly mention some results for Procedure 1 here: Section 4 presents conditions under which the sample QLR statistic and the (quasi-)posterior distribution of the QLR both converge to a chi-square distribution with unknown degree of freedom in regular models.555In point-identified models, Wilks-type asymptotics imply the degree of freedom is equal to the dimension of for QLR statistics. In partially identified models, the degree of freedom is some , typically less than or equal to . The correct may not be easy to infer from the context, which is why we refer to it as “unknown”. Appendix E shows that the QLR and the (quasi-)posterior of the QLR both converge to a gamma distribution with scale parameter of 2 and unknown shape parameter in more general partially-identified models. These results ensure that the quantiles of the QLR evaluated at the MC draws from its quasi-posterior consistently estimate the correct critical values needed for Procedure 1 CS to have exact asymptotic coverage for . See Section 4 for similar results for the profile QLR and Procedure 2 CSs for for subvectors.
We demonstrate the computational feasibility and good finite-sample coverage of our proposed methods in two simulation experiments: a missing data example and a complete information entry game with correlated payoff shocks. We use the missing data example to illustrate the conceptual difficulties in a transparent way, studying both numerically and theoretically the behaviors of our CSs when this model is partially-identified, close to point-identified, and point-identified. Although the length of a confidence interval for the identified set of a scalar is by definition no shorter than that for itself, our simulations demonstrate that the differences in length between our Procedures 2 and 3 CSs for and the GMS CSs of Andrews and Soares (2010) for are negligible. Finally, our CS constructions are applied to two real data examples: an airline entry game with correlated payoff shocks and an empirical trade flow model. The airline entry game example has 17 partially-identified structural parameters. Our empirical findings using Procedures 2 and 3 CSs show that the data are informative about some equilibrium selection probabilities. The trade example has 46 structural parameters. Here, point-identification may be difficult to verify, especially when conducting a sensitivity analysis of restrictive model assumptions.
Literature Review.
Several papers have recently proposed Bayesian (or pseudo Bayesian) methods for constructing CSs for that have correct frequentist coverage properties. See section 3.3 in 2009 NBER working paper version of Moon and Schorfheide (2012), Kitagawa (2012), Norets and Tang (2014), Kline and Tamer (2016), Liao and Simoni (2016) and the references therein. All these papers consider separable regular models and use various renderings of a similar intuition. First, there exists a finite-dimensional reduced-form parameter, say , that is (globally) point-identified and -consistently and asymptotically normal estimable from the data, and is linked to the model structural parameter via a known global mapping. Second, a prior is placed on the reduced-form parameter , and third, a classical Bernstein-von Mises theorem stating the asymptotic normality of the posterior distribution for is assumed to hold. Finally, the known global mapping between the reduced-form and the structural parameters is inverted, which, by step 3, guarantees correct coverage for in large samples. In addition to this literature’s focus on separable models, it is not clear whether the results there remain valid in various non-regular models we study.
Our approach is valid regardless of whether the model is separable or not. We show that for general separable or non-separable partially identified likelihood or moment-based models, a local reduced-form reparameterization exists (see Section 5). We use this local reparameterization as a proof device to show that the (quasi-)posterior distributions of the QLR and the profile QLR statistics have a frequentist interpretation in large samples. Importantly, since our Procedures 1 and 2 impose priors on the model parameter only, there is no need for obtaining a global reduced-form reparameterization or deriving its dimension to implement our procedures. This is in contrast with the above-mentioned existing Bayesian methods for partially identified separable models, for which researchers need to impose priors on global reduced-form parameters to ensure that its posterior lies on (i.e. the set of reduced-form parameters consistent with the structural model), which could be difficult even in some empirically relevant separable models; see the airline entry game application in Section 3.2. Moreover, our new Bernstein-von Mises type theorems for the (quasi-)posterior distributions of the QLR and profile QLR allow for several important non-regular cases in which the local reduced-form parameter is typically not -consistent and asymptotically normally estimable.
When specialized to point- or partially-identified likelihood models, our Procedure 1 CS for is equivalent to Bayesian credible set for based on inverting a LR statistic. With flat priors, these CSs are also the highest posterior density (HPD) credible sets. Our general theoretical results imply that HPD credible sets give correct frequentist coverage in partially identified regular models and conservative coverage in some non-standard circumstances. These findings complement those of Moon and Schorfheide (2012) who showed that HPD credible sets can under-cover (in a frequentist sense) in separable partially identified regular models under their conditions.666Note that this is not a contradiction since our priors are imposed on structural parameters only, violating Assumption 2 in Moon and Schorfheide (2012). In point-identified regular models satisfying a generalized information equality with -consistent and asymptotically normally estimable parameters , Chernozhukov and Hong (2003) (CH hereafter) propose constructing CSs for scalar subvectors by taking the upper and lower quantiles of the MCMC draws where . Our CS constructions for scalar subvectors are asymptotically equivalent to CH’s CSs in such models, but they differ otherwise. Our CS constructions, which are based on quantiles of the criterion evaluated at the MC draws rather than of the raw parameter draws themselves, are valid irrespective of whether the model is point- or partially-identified. Intuitively, this is because the population criterion is always point-identified irrespective of whether is point- or partially-identified.
There are several published works on frequentist CS constructions for : see, e.g., CHT and Romano and Shaikh (2010) where subsampling based methods are used for general partially identified models, Bugni (2010) and Armstrong (2014) where bootstrap methods are used for moment inequality models, and Beresteanu and Molinari (2008) where random set methods are used when is strictly convex. For inference on identified sets of subvectors, both the subsampling-based papers of CHT and Romano and Shaikh (2010) deliver valid tests with a judicious choice of the subsample size for a profiled criterion function. The subsampling-based CS construction allows for general criterion functions, but is computationally demanding and sensitive to choice of subsample size in realistic empirical structural models.777There is a large literature on frequentist approach for inference on the true parameter or (e.g., Imbens and Manski (2004), Rosen (2008), Andrews and Guggenberger (2009), Stoye (2009), Andrews and Soares (2010), Andrews and Barwick (2012), Canay (2010), Romano et al. (2014), Bugni et al. (2016) and Kaido et al. (2016) among many others), which generally uses discontinuous-in-parameters asymptotic (repeated sampling) approximations to test statistics. These existing frequentist methods are difficult to implement in realistic empirical models. Our methods are computationally attractive and typically have asymptotically correct coverage, but require “optimal” criterion functions.
The rest of the paper is organized as follows. Section 2 describes our new procedures for CSs for identified sets and . Section 3 presents simulations and real data applications. Section 4 first establishes new BvM (or Bayesian Wilks) results for the QLR and profile QLR in partially identified models. It then derives the frequentist validity of our CSs. Section 5 provides some sufficient conditions to the key regularity conditions for the general theory in Section 4. Section 6 briefly concludes. Appendix A describes the implementation details for the simulations and real data applications in Section 3. Appendix B shows that our CSs for and are valid uniformly over a class of DGPs. Appendix C verifies the main regularity conditions for uniform validity in the missing data and a moment inequality examples. Appendix D presents results on local power. Appendix E establishes a new BvM (or Bayesian Wilks) result which shows that the limiting (quasi-)posterior distribution of the QLR in a partially identified model is a gamma distribution with unknown shape parameter and scale parameter of 2. There, results on models with parameter-dependent support are given. Appendix F contains all the proofs and additional lemmas.
2 Description of our Procedures
In this section we first describe our method for constructing CSs for . We then describe methods for constructing CSs for of any subvector. We finally present an extremely simple method for constructing CSs for of a scalar subvector in certain situations.
Let denote a sample of i.i.d. or strictly stationary and ergodic data of size . Consider a population objective function , such as a log-likelihood function for correctly specified likelihood models, an optimally-weighted or continuously-updated GMM objective function, or a sandwich quasi-likelihood function. The function is assumed to be an upper semicontinuous function of with . The population objective may not be maximized uniquely over , but rather its maximizers, the identified set, may be a nontrivial set of parameters:
| (1) |
The set is our first object of interest. In many applications, it may be of interest to provide a CS for a subvector of interest. Write where is the subvector of interest and is a nuisance parameter. Our second object of interest is the identified set for the subvector :
| (2) |
Given the data , we seek to construct computationally attractive CSs that cover or with a pre-specified probability (in repeated samples) as sample size gets large.
To describe our approach, let denote an (upper semicontinuous) sample criterion function that is a jointly measurable function of the data and . This objective function can be a natural sample analogue of . We give a few examples of objective functions that we consider.
Parametric likelihood: Given a parametric model: with a corresponding density (with respect to some dominating measure), the identified set is where is the true data distribution. We take to be the average log-likelihood function:
| (3) |
GMM models: Consider a set of moment equalities such that the solution to this vector of equalities may not be unique. The identified set is . The sample objective function can be the continuously-updated GMM objective function:
| (4) |
where and (the superscript - denotes generalized inverse) for iid data or other suitable choices. Given an optimal weighting matrix , we could also use an optimally-weighted GMM objective function:
| (5) |
Generalized empirical likelihood objective functions could also be used with our procedures.
Our main CS constructions (Procedures 1 and 2 below) are based on Monte Carlo (MC) simulation methods from a quasi-posterior. Given and a prior over , the quasi-posterior distribution for given is defined as
| (6) |
Our procedures 1 and 2 require drawing a sample from the quasi-posterior . In practice we use an adaptive sequential Monte Carlo (SMC) algorithm which is known to be well suited to drawing from irregular, multi-modal distributions, but any MC sampler could, in principle, be used. The SMC algorithm is described in detail in Appendix A.1.
2.1 Confidence sets for the identified set
Here we seek a 100% CS for using that has asymptotically exact coverage, i.e.:
[Procedure 1: Confidence sets for the identified set]
-
1.
Draw a sample from the quasi-posterior distribution in (6).
-
2.
Calculate the quantile of ; call it .
-
3.
Our 100% confidence set for is then:
(7)
Notice that no optimization of itself is required in order to construct . Further, an exhaustive grid search over the full parameter space is not required as the MC draws will concentrate around and thereby indicate the regions in over which to search.
CHT considered inference on the set of minimizers of a nonnegative population criterion function using a sample analogue of . Let denote a consistent estimator of the quantile of . The 100% CS for at level proposed is . In the existing literature, subsampling or bootstrap based methods have been used to compute which can be tedious to implement. Instead, our procedure replaces with a cut off based on Monte Carlo simulations. The next remark provides an equivalent approach to Procedure 1 but that is constructed in terms of , which is the quasi likelihood ratio statistic associated with .
Remark 1.
Let denote an approximate maximizer of , i.e.:
and define the quasi-likelihood ratio (QLR) (at a point ) as:
| (8) |
Let denote the quantile of . The confidence set:
is equivalent to defined in (7) because if and only if .
In Procedure 1 and Remark 1 above, the posterior-like quantity involves the use of a prior distribution over . This prior is user chosen and typically would be the uniform prior but other choices are possible. In our simulations, various choices of prior did not matter much, unless they assigned extremely small mass near the true parameter (which is avoided by using a uniform prior whenever is compact).
The next lemma presents high-level conditions under which any 100% criterion-based CS for has asymptotically correct (frequentist) coverage. Similar statements appear in CHT. Let denote the (probability) distribution function of a random variable and be the quantile of .
Lemma 2.1.
Let (i) where is a random variable for which is continuous at , and (ii) be a sequence of random variables such that . Define:
Then: . Moreover, if condition (ii) is replaced by the condition , then: .
Our MC CSs for are shown to be valid by verifying parts (i) and (ii) with . To verify part (ii), we shall establish a new Bernstein-von Mises (BvM) (or a new Bayesian Wilks) type result for the quasi-posterior distribution of the QLR under loss of identifiability.
2.2 Confidence sets for the identified set of subvectors
We seek a CS for such that:
A well-known method to construct a CS for is based on projection, which maps a CS for into one for . The projection CS:
| (9) |
is a valid % CS for whenever is a valid % CS for . As is well documented, is typically conservative, and especially so when the dimension of is small relative to the dimension of . Indeed, our simulations below indicate that is very conservative even in reasonably low-dimensional parametric models.
We propose CSs for based on a profile criterion for . Let and . The profile criterion for a point is , and the profile criterion for is
| (10) |
Let be an equivalence set for . In likelihood models we define and in moment-based models we define . Let , and the profile criterion for is
| (11) |
[Procedure 2: Confidence sets for subvectors]
-
1.
Draw a sample from the quasi-posterior distribution in (6).
-
2.
Calculate the quantile of ; call it .
-
3.
Our 100% confidence set for is then:
(12)
By forming in terms of the profile criterion we avoid having to do an exhaustive grid search over . An additional computational advantage is that the subvectors of the draws, say , concentrate around , thereby indicating the region in over which to search.
Remark 2.
Recall the definition of the QLR in (8), we define the profile QLR for the set analogously as
| (13) |
Let denote the quantile of the profile QLR draws . The confidence set:
is equivalent to because if and only if .
Our Procedure 2 and Remark 2 above are different from taking quantiles of the MC parameter draws. A popular percentile CS (denoted as ) for a scalar subvector is computed by taking the upper and lower percentiles of . For point-identified regular models with -consistent and asymptotically normal parameters , this approach is known to be valid for correctly-specified likelihood models in the standard Bayesian literature and its validity for criterion-based models satisfying a generalized information equality has been established by Chernozhukov and Hong (2003). However, in partially identified models this approach is no longer valid and under-covers, as evidenced in the simulation results below.
The following result presents high-level conditions under which any 100% criterion-based CS for is asymptotically valid. A similar statement appears in Romano and Shaikh (2010).
Lemma 2.2.
Let (i) where is a random variable for which is continuous at , and (ii) be a sequence of random variables such that . Define:
Then: . Moreover, if condition (ii) is replaced by the condition , then: .
Our MC CSs for are shown to be valid by verifying parts (i) and (ii) with . To verify part (ii), we shall derive a new BvM type result for the quasi-posterior of the profile QLR under loss of identifiability.
2.3 A simple but slightly conservative CS for of scalar subvectors
For a class of partially identified models with one-dimensional subvectors of interest, we now propose another CS which is extremely simple to construct. This new CS for is slightly conservative (whereas could be asymptotically exact), but its coverage is much less conservative than that of the projection-based CS .
[Procedure 3: Simple conservative CSs for scalar subvectors]
-
1.
Calculate a maximizer for which .
-
2.
Our 100% confidence set for is then:
(14) where is the QLR in (8) and denotes the quantile of the distribution.
Procedure 3 above is justified when the limit distribution of the profile QLR for is stochastically dominated by the distribution (i.e., for all in Lemma 2.2). This allows for computationally simple construction using repeated evaluations on a scalar grid. Unlike , the CS for is typically asymptotically conservative and is only valid for scalar functions of (see Section 4.3). Nevertheless, the CS is asymptotically exact when happens to be a singleton belonging to the interior of , and, for confidence levels of , its degree of conservativeness for the set is negligible (see Section 4.3). It is extremely simple to implement and performs very favorably in simulations. As a sensitivity check in empirical estimation of a complicated structural model, one could report the conventional CS based on a -statistic (that is valid under point identification only) as well as our CS (that remains valid under partial identification); see Section 3.2.
3 Simulation Evidence and Empirical Applications
This section presents simulation evidence and empirical applications to demonstrate the good performances of our new procedures for general possibly partially identified models. See Appendix A for implementation details.
3.1 Simulation evidence
In this subsection we investigate the finite-sample behavior of our proposed CSs in two leading examples of partially identified models: missing data and entry game with correlated payoff shocks. Both have been studied in the existing literature as leading examples of partially-identified moment inequality models; we instead use them as examples of likelihood and moment equality models.
We use samples of size , , , and . For each sample, we calculate the posterior quantile of the QLR or profile QLR statistic using draws from an adaptive SMC algorithm (see Appendix A.1 for a description of the algorithm).
3.1.1 Example 1: missing data
We first consider the simple but insightful missing data example. Suppose we observe a random sample where both the outcome variable and the selection variable take values in . The parameter of interest is the true mean . Without further assumptions, is not point identified when as we only observe when .
Denote the true probabilities of observing , and by , , and respectively. We view and as true reduced-form parameters that are consistently estimable. The reduced-form parameters are functions of the structural parameter where , , and . Under this model parameterization, is related to the reduced form parameters via and . The parameter space for is defined as:
| (15) |
The identified set for is:
| (16) |
Here, is point-identified but only an affine combination of and are identified. The identified set for is:
and the identified set for the nuisance parameter is .
We set the true values of the parameters to be , , and take for to cover both partially-identified but “drifting-to-point-identification” () and point-identified cases. We first implement the procedures using a likelihood criterion and a flat prior on . The likelihood function of is
In Appendix A we present and discuss additional results for a likelihood criterion with a curved prior and a continuously-updated GMM criterion based on the moments and with a flat prior (this GMM case may be interpreted as a moment inequality model with playing the role of a slackness parameter).
We implement the SMC algorithm as described in Appendix A.2. To illustrate sampling via the SMC algorithm and the resulting posterior of the QLR, Figure 1 displays histograms of the draws for , and for one run of the adaptive SMC algorithm for a sample of size with . Here is partially identified with . The histograms in Figure 1 show that the draws for and are both approximately flat across their identified sets. In contrast, the draws for , which is point identified, are approximately normally distributed and centered at the MLE. The Q-Q plot in Figure 1 shows that the quantiles of computed from the draws are very close to the quantiles of a distribution, as predicted by our theoretical results below.
![[Uncaptioned image]](/html/1605.00499/assets/x1.png)
![[Uncaptioned image]](/html/1605.00499/assets/x2.png)
![[Uncaptioned image]](/html/1605.00499/assets/x3.png)
![[Uncaptioned image]](/html/1605.00499/assets/x4.png)
| (Point ID) | ||||||||||||||||||
|---|---|---|---|---|---|---|---|---|---|---|---|---|---|---|---|---|---|---|
| 0.90 | 0.95 | 0.99 | 0.90 | 0.95 | 0.99 | 0.90 | 0.95 | 0.99 | ||||||||||
| (Procedure 1) | ||||||||||||||||||
| 100 | .910 | — | .957 | — | .994 | — | .903 | — | .953 | — | .993 | — | .989 | — | .997 | — | 1.000 | — |
| 250 | .901 | — | .947 | — | .991 | — | .912 | — | .955 | — | .992 | — | .992 | — | .997 | — | 1.000 | — |
| 500 | .913 | — | .956 | — | .991 | — | .908 | — | .957 | — | .991 | — | .995 | — | .997 | — | .999 | — |
| 1000 | .910 | — | .958 | — | .992 | — | .911 | — | .958 | — | .994 | — | .997 | — | .999 | — | 1.000 | — |
| (Procedure 2) | ||||||||||||||||||
| 100 | .920 | [] | .969 | [] | .997 | [] | .918 | [] | .964 | [] | .994 | [] | .911 | [] | .958 | [] | .990 | [] |
| 250 | .917 | [] | .961 | [] | .992 | [] | .920 | [] | .963 | [] | .991 | [] | .915 | [] | .959 | [] | .991 | [] |
| 500 | .914 | [] | .961 | [] | .993 | [] | .914 | [] | .958 | [] | .992 | [] | .916 | [] | .959 | [] | .990 | [] |
| 1000 | .917 | [] | .956 | [] | .993 | [] | .914 | [] | .955 | [] | .993 | [] | .916 | [] | .959 | [] | .992 | [] |
| (Procedure 3) | ||||||||||||||||||
| 100 | .920 | [] | .952 | [] | .990 | [] | .916 | [] | .946 | [] | .989 | [] | .902 | [] | .937 | [] | .986 | [] |
| 250 | .915 | [] | .952 | [] | .990 | [] | .914 | [] | .954 | [] | .990 | [] | .883 | [] | .949 | [] | .991 | [] |
| 500 | .894 | [] | .954 | [] | .989 | [] | .906 | [] | .949 | [] | .990 | [] | .899 | [] | .945 | [] | .988 | [] |
| 1000 | .909 | [] | .950 | [] | .993 | [] | .904 | [] | .954 | [] | .989 | [] | .906 | [] | .946 | [] | .991 | [] |
| (Projection) | ||||||||||||||||||
| 100 | .972 | [] | .990 | [] | .999 | [] | .969 | [] | .989 | [] | .998 | [] | .989 | [] | .997 | [] | 1.000 | [] |
| 250 | .971 | [] | .986 | [] | .998 | [] | .976 | [] | .988 | [] | .998 | [] | .992 | [] | .997 | [] | 1.000 | [] |
| 500 | .972 | [] | .985 | [] | .999 | [] | .972 | [] | .989 | [] | .999 | [] | .995 | [] | .997 | [] | .999 | [] |
| 1000 | .973 | [] | .990 | [] | .999 | [] | .973 | [] | .988 | [] | .999 | [] | .997 | [] | .999 | [] | 1.000 | [] |
| (Percentile) | ||||||||||||||||||
| 100 | .416 | [] | .676 | [] | .945 | [] | .661 | [] | .822 | [] | .963 | [] | .896 | [] | .946 | [] | .989 | [] |
| 250 | .402 | [] | .669 | [] | .917 | [] | .662 | [] | .822 | [] | .960 | [] | .899 | [] | .950 | [] | .990 | [] |
| 500 | .400 | [] | .652 | [] | .914 | [] | .652 | [] | .812 | [] | .955 | [] | .903 | [] | .953 | [] | .988 | [] |
| 1000 | .405 | [] | .671 | [] | .917 | [] | .662 | [] | .819 | [] | .953 | [] | .905 | [] | .953 | [] | .990 | [] |
| Comparison with GMS CSs for via moment inequalities | ||||||||||||||||||
| 100 | .815 | [] | .908 | [] | .981 | [] | .803 | [] | .904 | [] | .980 | [] | .889 | [] | .938 | [] | .973 | [] |
| 250 | .798 | [] | .899 | [] | .979 | [] | .811 | [] | .897 | [] | .980 | [] | .896 | [] | .944 | [] | .981 | [] |
| 500 | .794 | [] | .898 | [] | .976 | [] | .789 | [] | .892 | [] | .975 | [] | .897 | [] | .948 | [] | .986 | [] |
| 1000 | .802 | [] | .900 | [] | .978 | [] | .812 | [] | .900 | [] | .978 | [] | .898 | [] | .949 | [] | .990 | [] |
Confidence sets for :
The top panel of Table 1 displays MC coverage probabilities of for 5000 replications. The MC coverage probability should be equal to its nominal value in large samples when (see Theorem 4.1). It is perhaps surprising that the nominal and MC coverage probabilities are close even in samples as small as . When the CSs for are conservative, as predicted by our theoretical results (see Theorem 4.2).
Confidence sets for :
We now consider various CSs for the identified set for . We first compute the projection CS , as defined in (9), for . As we can see from Table 1, this results in conservative CSs for . For example, when the projection CSs cover in around 97% of repeated samples. As the models with are close to point-identified, one might be tempted to report simple percentile CSs for using Chernozhukov and Hong (2003) procedure, which is valid under point identification, and taking the upper and lower quantiles from of the draws for .888Note that we use exactly the same draws for implementing the percentile CS and procedures 1 and 2. As the SMC algorithm uses a particle approximation to the posterior, in practice we compute posterior quantiles for using the particle weights in a manner similar to (28). The results in Table 1 show that has correct coverage when is point identified (i.e. ) but it under-covers when is not point identified. For instance, the coverage probabilities of 90% CSs for are about 66% with .
In contrast, our criterion-based procedures 2 and 3 remain valid under partial identification. We show below (see Theorem 4.3) that the coverage probabilities of our procedure 2 CS (for ) should be equal to their nominal values when is large irrespective of whether the model is partially identified with (i.e. ) or point identified (i.e. ). The results in Table 1 show that this is indeed the case, and that the coverage probabilities for procedure 2 are close to their nominal level even for small values of , irrespective of whether the model is point- or partially-identified. In Section 5.3.1, we show that the asymptotic distribution of the profile QLR for is stochastically dominated by the distribution. Table 1 also presents results for procedure 3 using as in (14). As we can see from these tables, the coverage results look remarkably close to their nominal values even for small sample sizes and for all values of .
Finally, we compare our the length of CSs for using procedures 2 and 3 with the length of CSs for the parameter constructed using the generalized moment selection (GMS) procedure of Andrews and Soares (2010). We implement their procedure using the inequalities
| (17) |
with their smoothing parameter , their GMS function , and with critical values computed via a multiplier bootstrap. Of course, GMS CSs are for the parameter rather than the set , which is why the coverage for reported in Table 1 appears lower than nominal under partial identification (GMS CSs are known to be asymptotically valid CSs for ). Importantly, the average lower and upper bounds of our CSs for constructed using Procedures 2 and 3 are very close to those using GMS, whereas projection-based CSs are, in turn, larger. On the other hand, CSs computed using percentiles of the draws for are narrower.
3.1.2 Example 2: entry game with correlated payoff shocks
We now consider the complete information entry game example described in Table 2. We assume that , observed by the players, are jointly normally distributed with variance 1 and correlation , an important parameter of interest. We also assume that and are both negative and that players play a pure strategy Nash equilibrium. When , , the game has two equilibria: for given values of the epsilons in this region, the model predicts and . Let denote a binary random variable taking the value if and only if player 1 takes action and player 2 takes action . We observe a random sample of . So the data provides information of four choice probabilities , but there are six parameters that need to be estimated: where is the equilibrium selection probability. The model parameter is partially identified as we have 3 non-redundant choice probabilities from which we need to learn about 6 parameters.
| Player | |||
|---|---|---|---|
| Player | |||
We can link the choice probabilities (reduced-form parameters) to via:
and , where denotes the joint probability distribution of indexed by the correlation parameter . Let denote the true choice probabilities . This naturally suggests a likelihood approach, where the likelihood of is:
In the simulations, we use a likelihood criterion with parameter space:
We simulate the data using , , and .
![[Uncaptioned image]](/html/1605.00499/assets/x5.png)
![[Uncaptioned image]](/html/1605.00499/assets/x6.png)
![[Uncaptioned image]](/html/1605.00499/assets/x7.png)
![[Uncaptioned image]](/html/1605.00499/assets/x8.png)
![[Uncaptioned image]](/html/1605.00499/assets/x9.png)
![[Uncaptioned image]](/html/1605.00499/assets/x10.png)
We put a flat prior on and implement the SMC algorithm as described in Appendix A.3. Figure 2 displays histograms of the marginal draws for , , and for one run of the SMC algorithm with a sample of size . The plots for and are very similar to those for and (which is to be expected as the parameters are symmetric) and are therefore omitted. The draws for and are supported on and around their respective identified sets, which are approximately and (the identified sets for and are ). Note that here the draws for , and are not flat over their identified sets, in contrast with the draws for and in Figure 1. To see why, consider the marginal identified set for , plotted as the shaded region in Figure 2. This plot shows that when is close to the upper bound of its identified set, is in the shaded region for any . However, when is close to the lower bound of its identified set, is only in the shaded region for very large values of . This structure of , together with the flat prior on , means that the marginal posterior for assigns relatively more mass towards the upper limit of the identified set for . Similar logic applies for and . Figure 2 also shows that the quantiles of computed from the draws are very close to the quantiles, as predicted by our theoretical results below.
Table 3 reports average coverage probabilities and CS limits for the various procedures across 1000 replications. We form CSs for using procedure 1, as well as CSs for the identified sets of scalar subvectors and using procedures 2 and 3.999As the parameterization is symmetric, the identified sets for and are the same as for and so we omit them. We also omit CSs for and , whose identified sets are both . We also compare our CS for identified sets for and with projection-based and percentile-based CSs. Appendix A.3 provides additional details on computation of for implementation of procedure 2. We do not use the reduced-form reparameterization in terms of choice probabilities to compute . Coverage of for is extremely good, even with the small sample size . Coverage of procedures 2 and 3 for the identified sets for and is slightly conservative for the small sample size , but close to nominal for . As expected, projection CSs are valid but very conservative (the coverage probabilities of 90% CSs are all at least 98%) whereas percentile-based CSs undercover.
| 0.90 | 0.95 | 0.99 | ||||
| CSs for the identified set | ||||||
| (Procedure 1) | ||||||
| 100 | 0.924 | — | 0.965 | — | 0.993 | — |
| 250 | 0.901 | — | 0.952 | — | 0.996 | — |
| 500 | 0.913 | — | 0.958 | — | 0.991 | — |
| 1000 | 0.913 | — | 0.964 | — | 0.992 | — |
| CSs for the identified set for | ||||||
| (Procedure 2) | ||||||
| 100 | 0.958 | [] | 0.986 | [] | 0.997 | [] |
| 250 | 0.930 | [] | 0.960 | [] | 0.997 | [] |
| 500 | 0.923 | [] | 0.961 | [] | 0.996 | [] |
| 1000 | 0.886 | [] | 0.952 | [] | 0.989 | [] |
| (Procedure 3) | ||||||
| 100 | 0.944 | [] | 0.973 | [] | 0.993 | [] |
| 250 | 0.939 | [] | 0.957 | [] | 0.997 | [] |
| 500 | 0.937 | [] | 0.971 | [] | 0.996 | [] |
| 1000 | 0.924 | [] | 0.966 | [] | 0.992 | [] |
| (Projection) | ||||||
| 100 | 0.993 | [] | 0.997 | [] | 1.000 | [] |
| 250 | 0.996 | [] | 0.999 | [] | 1.000 | [] |
| 500 | 0.996 | [] | 0.999 | [] | 1.000 | [] |
| 1000 | 0.989 | [] | 0.996 | [] | 0.999 | [] |
| (Percentiles) | ||||||
| 100 | 0.000 | [] | 0.000 | [] | 0.000 | [] |
| 250 | 0.000 | [] | 0.000 | [] | 0.000 | [] |
| 500 | 0.000 | [] | 0.000 | [] | 0.000 | [] |
| 1000 | 0.000 | [] | 0.000 | [] | 0.000 | [] |
| CSs for the identified set for | ||||||
| (Procedure 2) | ||||||
| 100 | 0.960 | [] | 0.974 | [] | 0.994 | [] |
| 250 | 0.935 | [] | 0.958 | [] | 0.995 | [] |
| 500 | 0.925 | [] | 0.958 | [] | 0.995 | [] |
| 1000 | 0.926 | [] | 0.970 | [] | 0.994 | [] |
| (Procedure 3) | ||||||
| 100 | 0.918 | [] | 0.963 | [] | 0.992 | [] |
| 250 | 0.914 | [] | 0.953 | [] | 0.991 | [] |
| 500 | 0.912 | [] | 0.957 | [] | 0.990 | [] |
| 1000 | 0.917 | [] | 0.962 | [] | 0.993 | [] |
| (Projection) | ||||||
| 100 | 0.990 | [] | 0.997 | [] | 1.000 | [] |
| 250 | 0.989 | [] | 0.997 | [] | 1.000 | [] |
| 500 | 0.989 | [] | 0.996 | [] | 1.000 | [] |
| 1000 | 0.990 | [] | 0.998 | [] | 1.000 | [] |
| (Percentiles) | ||||||
| 100 | 0.395 | [] | 0.654 | [] | 0.937 | [] |
| 250 | 0.169 | [] | 0.478 | [] | 0.883 | [] |
| 500 | 0.085 | [] | 0.399 | [] | 0.840 | [] |
| 1000 | 0.031 | [] | 0.242 | [] | 0.803 | [] |
3.2 Empirical applications
This subsection implements our procedures in two non-trivial empirical applications. The first application estimates an entry game with correlated payoff shocks using data from the US airline industry. Here there are 17 model parameters to be estimated. The second application estimates a model of trade flows initially examined in Helpman et al. (2008) (HMR henceforth). We use a version of the empirical model in HMR with 46 parameters to be estimated.
Although the entry game model is separable, we do not make use of separability in implementing our procedures. In fact, the existing Bayesian approaches that impose priors on the globally-identified reduced-form parameters will be problematic in this example. This separable model has 24 non-redundant choice probabilities (global reduced-form parameters, i.e., ) and 17 model structural parameters (i.e., ), and there is no explicit closed form expression for the identified set. Both Moon and Schorfheide (2012) and Kline and Tamer (2016) would sample from the posterior for the reduced-form parameter . But, unless the posterior for is constrained to lie on (i.e. the set of reduced-form probabilities consistent with the model, rather than the full 24-dimensional space), certain values of drawn from their posteriors for will not be consistent with the model.
The empirical trade example is a nonseparable likelihood model that cannot be handled by either (a) existing Bayesian approaches that rely on a point-identified, -estimable and asymptotically normal reduced-form parameter, or (b) inference procedures based on moment inequalities.
In both applications, our approach only puts a prior on the model structural parameter so it does not matter whether the model is separable or not. Both applications illustrate how our procedures may be used to examine the robustness of estimates to various ad hoc modeling assumptions in a theoretically valid and computationally feasible way.
3.2.1 Bivariate Entry Game with US Airline Data
This section estimates a version of the entry game that we study in Subsection 3.1.2 above. We use data from the second quarter of ’s Airline Origin and Destination Survey (DB1B) to estimate a binary game where the payoff for firm from entering market is
where the are assumed to be negative (as usually the case in entry models). The data contain 7882 markets which are formally defined as trips between two airports irrespective of stopping and we examine the entry behavior of two kinds of firms: LC (low cost) firms,101010The low cost carriers are: JetBLue, Frontier, Air Tran, Allegiant Air, Spirit, Sun Country, USA3000, Virgin America, Midwest Air, and Southwest. and OA (other airlines) which includes all the other firms. The unconditional choice probabilities are which are respectively the probabilities that OA and LC serve a market, that OA and not LC serve a market, that LC and not OA serve a market, and finally whether no airline serve the market.
The regressors are market presence and market size. Market presence is a market- and airline-specific variable defined as follows: from a given airport, we compute the ratio of markets a given carrier (we take the maximum within the category OA or LC, as appropriate) serves divided by the total number of markets served from that given airport. The market presence variable is the average of the ratios from the two endpoints and it provides a proxy for an airline’s presence in a given airport (See Berry (1992) for more on this variable). This variable acts as an excluded regressor: the market presence for OA only enters OA’s payoffs, so is both market- and airline-specific. The second regressor we use is market size which is defined as the population at the endpoints, so this variable is market-specific. We discretize both and into binary variables that take the value of one if the variable is higher than its median (in the data) value and zero otherwise. The choice probabilities are are conditional on the three-dimensional vector . We therefore have 4 choice probabilities for every value of the conditioning variables (and there are 8 values for these).111111With binary values, the conditioning set takes the following eight values: (1,1,1), (1,1,0), (1,0,1), (1,0,0), (0,1,1), (0,1,0), (0,0,1), (0,0,0). To use notation similar to that in Subsection 3.1.2, let OA be player and firm LC be player . Denote and with and . The likelihood for market depends on the choice probabilities:
Here is a nuisance parameter which corresponds to the various aggregate equilibrium selection probabilities. Here is defined on the support of , so in the model this function takes values each belonging to . In the full model we make no assumptions on the equilibrium selection mechanism. Therefore, the full model has 17 parameters: 4 parameters per profit function (namely , , , and ), the correlation between and , and the 8 parameters in the aggregate equilibrium choice probabilities . We also estimate a restricted version of the model called fixed in which we restrict the aggregate selection probabilities to be the same across markets, for a total of 10 parameters. Note that these are just one version of the econometric model for a game; a less parsimonious version would allow, for example, for the parameters to change with regressor values, or allow for the regressors’ support to be richer (rather than binary). We analyze this case precisely to highlight the fact that our CSs provide coverage guarantees regardless of whether the parameter vector is point identified.
| Full model | Fixed- model | |||||||
|---|---|---|---|---|---|---|---|---|
| Procedure 2 | Procedure 3 | Projection | Percentile | Procedure 2 | Procedure 3 | Projection | Percentile | |
| [] | [] | [] | [] | [] | [] | [] | [] | |
| [] | [] | [] | [] | [] | [] | [] | [] | |
| [] | [] | [] | [] | [] | [] | [] | [] | |
| [] | [] | [] | [] | [] | [] | [] | [] | |
| [] | [] | [] | [] | [] | [] | [] | [] | |
| [] | [] | [] | [] | [] | [] | [] | [] | |
| [] | [] | [] | [] | [] | [] | [] | [] | |
| [] | [] | [] | [] | [] | [] | [] | [] | |
| [] | [] | [] | [] | [] | [] | [] | [] | |
| — | — | — | — | [] | [] | [] | [] | |
| [] | [] | [] | [] | — | — | — | — | |
| [] | [] | [] | [] | — | — | — | — | |
| [] | [] | [] | [] | — | — | — | — | |
| [] | [] | [] | [] | — | — | — | — | |
| [] | [] | [] | [] | — | — | — | — | |
| [] | [] | [] | [] | — | — | — | — | |
| [] | [] | [] | [] | — | — | — | — | |
| [] | [] | [] | [] | — | — | — | — | |
We again take a flat prior on and implement the procedures using a likelihood criterion. We restrict the support of to , to , to and the selection probabilities to . We implement the procedure using the adaptive SMC algorithm as described in Appendix A.4 with draws. Histograms of the SMC draws for the selection probabilities are presented in Figure 3; histograms of draws for the profit function parameters and are presented in Figures 7 and 8 in Appendix A.4. We construct CSs for each of the parameters using procedure 2 and procedure 3 and compare these to projection-based CSs (projecting using our procedure 1) and percentile CSs. The empirical findings are presented in Table 4 below. Appendix A.4 contains further details on computation of for implementation of procedure 2. As with the game simulation, we do not explicitly use the reduced-form reparameterization when computing .
The results in Table 4 show that CSs computed via procedures 2 and 3 are generally similar (though there are some differences, with CSs via procedure 2, which is valid under weaker conditions than procedure 3, appearing wider for some of the selection probabilities in the full model). On the other hand, projection CSs are very wide, especially in the full model. For instance, the projection CS for is whereas CSs via procedures 2 and 3 are and respectively. As expected, percentile CSs are narrower than procedure 2 and 3 CSs, reflecting the fact that percentile CSs under-cover in partially identified models.
Starting with the full model results, we see that the estimates are meaningful economically and are inline with recent estimates obtained in the literature. For example, fixed costs (the intercepts) are positive and significant for the large airlines (OA) but are negative for the LC carriers. Typically, the presence of higher fixed costs can signal various barriers to entry prevent LCs from entering: the higher these fixed costs the less likely it is for LCs to enter. On the other hand, higher fixed costs of large airlines are associated with a bigger presence (such as a hub) and so OAs are more likely to enter. As expected, both market presence and market size are associated with a positive probability of entry for both OA and LC. Results for the fixed- model are in agreement with the corresponding ones for the full model and tell a consistent story. Note also the very high correlation in the errors, which could indicate missing profitability variables whereby firms enter a particularly profitable markets regardless of competition.
One interesting observation are the CSs for the selection probabilities (also see Figure 3). Consider and : these are the aggregate selection probabilities which, according to the results, are not identified. This is likely due to the rather small number of markets with small size, large presence for OA but small presence for LC (for ) and the small number of markets with large market size, large presence for OA but small presence for LC (for ). The strength of our approach is its adaptivity to lack of identification in a particular data set: for example, 95% CSs for the identified set for are (via procedure 2), indicating that the model (and data) has no information about this parameter, while the corresponding CS for the identified set for is the narrow and informative interval .
![[Uncaptioned image]](/html/1605.00499/assets/x11.png)
![[Uncaptioned image]](/html/1605.00499/assets/x12.png)
![[Uncaptioned image]](/html/1605.00499/assets/x13.png)
![[Uncaptioned image]](/html/1605.00499/assets/x14.png)
![[Uncaptioned image]](/html/1605.00499/assets/x15.png)
![[Uncaptioned image]](/html/1605.00499/assets/x16.png)
![[Uncaptioned image]](/html/1605.00499/assets/x17.png)
![[Uncaptioned image]](/html/1605.00499/assets/x18.png)
3.2.2 An empirical model of trade flows
In an influential paper, Helpman et al. (2008) examine the extensive margin of trade using a structural model estimated with current trade data. The following is a brief description of their empirical framework. Let denote the value of country ’s imports from country . This is only observed if country exports to country . If a random draw for productivity from country to is sufficiently high then will export to . To model this, Helpman et al. (2008) introduce a latent variable which measures trade volume between and . Here takes the value zero if does not export to and is strictly positive otherwise. We adapt slightly their empirical model to obtain a selection model of the form:
in which , , and are exporting and importing continent fixed effects, is a vector of observable trade frictions between and , and and are error terms described below. Exclusion restrictions can be imposed by setting at least one of the elements of equal to zero.
There are three differences between our empirical model and that of Helpman et al. (2008). First, we let enter the outcome equation linearly instead of nonlinearly.121212Their nonlinear specification is known to be problematic (see, e.g., Santos Silva and Tenreyro (2015)). Second, we use continent fixed effect instead of country fixed effects. This reduces the number of parameters from over 400 to 46. Third, we allow for heteroskedasticity in the selection equation, which is known to be a problem in trade data. This illustrates the robustness approach we advocate which relaxes parametric assumptions on part of the model that is suspect (homoskedasticity) without worrying about loss of point identification.
| Homoskedastic | Heteroskedastic | ||||||
|---|---|---|---|---|---|---|---|
| Variable | MLE | -stat CI | MLE | -stat CI | Procedure 2 | Procedure 3 | Percentile |
| Distance | 2.352 | [1.154,3.549] | 0.314 | [0.273,0.355] | [0.216,0.749] | [0.242,0.509] | [0.207,0.397] |
| Border | -5.191 | [-7.077,-3.304] | -2.265 | [-2.452,-2.077] | [-2.651,-1.859] | [-2.611,-1.898] | [-2.618,-1.816] |
| Island | -1.302 | [-1.913,-0.691] | -0.728 | [-0.868,-0.589] | [-1.060,-0.308] | [-1.060,-0.308] | [-0.983,-0.397] |
| Landlock | -7.275 | [-10.769,-3.780] | -1.369 | [-1.602,-1.137] | [-2.194,-0.914] | [-2.194,-0.890] | [-1.801,-0.954] |
| Legal | 0.358 | [0.002,0.715] | -0.122 | [-0.183,-0.061] | [-0.254,0.004] | [-0.242,-0.009] | [-0.248,0.011] |
| Language | -4.098 | [-6.430,-1.766] | -0.095 | [-0.168,-0.021] | [-0.868,0.049] | [-0.868,0.026] | [-0.237,0.067] |
| Colonial | -17.378 | [-26.002,-8.755] | -2.822 | [-3.029,-2.615] | [-4.980,-2.373] | [-4.980,-2.461] | [-3.231,-2.298] |
| Currency | -1.550 | [-2.780,-0.320] | -0.631 | [-0.946,-0.315] | [-1.315,0.020] | [-1.282,-0.013] | [-1.274,0.062] |
| FTA | -19.540 | [-29.783,-9.298] | -2.151 | [-2.410,-1.892] | [-2.686,-1.589] | [-2.631,-1.616] | [-2.680,-1.577] |
To allow for heteroskedasticity, we suppose that the distribution of conditional on observables is Normal with mean zero and covariance:
where denotes , the exporter’s continent, and the importer’s continent and where
We estimate the model from data on 24,649 country pairs in the selection equation and 11,146 country pairs in the outcome equation using the same data from 1986 as in Helpman et al. (2008). We also impose the exclusion restriction that the coefficient in corresponding to religion is equal to zero, else there is an exact linear relationship between the coefficients in the outcome and selection equation. This leaves a total of 46 parameters to be estimated. We only report estimates for the trade friction coefficients in the outcome equation as these are the most important. We estimate the model first by maximum likelihood under homoskedasticity and report conventional ML estimates for together with 95% CSs based on inverting -statistics. We then re-estimate the model under heteroskedasticity and report conventional ML estimates together with confidence sets based on inverting -statistics, percentile CSs (i.e. the Chernozhukov and Hong (2003) procedure under point identification), and our procedures 2 and 3. To implement our Procedure 2 and percentile CSs, we use the adaptive SMC algorithm as described in Appendix A.5 with draws.
The results are presented in Table 5.131313Note that the friction variables enter negatively in the outcome equation. The coefficient of distance is positive meaning that distance negatively affects trade flows; the remaining variables are dummy variables, so a negative coefficient of border means that sharing a border positively affects trade flows, and so forth. Overall, though the model is sensitive to the presence of heteroskedasticity, the results for the heteroskedastic specification show that the confidence sets seem reasonably insensitive to the type of procedure used, which suggests that partial identification may not be an issue even allowing for heteroskedasticity. We also notice some difference in results relative to Helpman et al. (2008). For instance, they document strong positive effects of common legal systems and currency unions on trade flows, whereas we find much weaker evidence for this. We also find a positive effect of landlocked status on trade flows whereas they document a negative effect. Under heteroskedasticity, the magnitudes of coefficients of the trade friction variables are generally smaller than under homoskedasticity but of the same sign. The exception is the legal variable, whose coefficient is positive under homoskedasticity but negative under heteroskedasticity. A remaining question is whether the estimates are also sensitive to the normality assumption on the errors. This question can be examined within the context of our results by, for example, using a flexible form for the joint distribution of the errors.
4 Large Sample Properties
This section provides regularity conditions under which (Procedure 1), (Procedure 2) and (Procedure 3) are asymptotically valid confidence sets for and . The main new theoretical contributions are the derivations of the large-sample (quasi)-posterior distributions of the QLR for and of the profile QLR for under loss of identifiability.
4.1 Coverage properties of for
We first state some high-level regularity conditions. A discussion of these assumptions follows.
Assumption 4.1.
(Posterior contraction)
(i) , with a sequence of local neighborhoods of ;
(ii) , where .
We presume the existence of a fixed neighborhood of (with for all sufficiently large) upon which there exists a local reduced-form reparameterization from into for a possibly unknown dimension , with if and only if . Here is merely a proof device and is only required to exist for in a fixed neighborhood of . To accommodate situations in which the true reduced-form parameter value may be “on the boundary” of , we assume that the sets cover141414We say that a sequence of sets covers a set if (i) for each , and (ii) there is a sequence of closed balls of radius centered at the origin with each convex, for each , and (almost surely). a closed convex cone . We note that this is trivially satisfied with whenever each contains a ball of radius centered at the origin. A similar approach is taken for point-identified models by Chernoff (1954), Geyer (1994), and Andrews (1999). Let and for any , let denote the orthogonal (or metric) projection of onto .
Assumption 4.2.
(Local quadratic approximation)
There exist sequences of random variables and -valued random vectors (both measurable in ) such that as :
| (18) |
with and where .
Let denote the image measure (under the map ) of the prior on , namely . Let be a ball of radius centered at the origin.
Assumption 4.3.
(Prior)
(i) almost surely;
(ii) has a continuous, strictly positive density on for some .
Discussion of Assumptions:
Assumption 4.1(i) is a standard condition on any approximate extremum estimator, and Assumption 4.1(ii) is a standard posterior contraction condition. The choice of is deliberately general and will depend on the particular model under consideration. See Section 5 for verification of Assumption 4.1. Assumption 4.2 is a standard local quadratic expansion condition imposed on the local reduced form parameter around . It is readily verified for likelihood and GMM models (see Section 5) with and typically a normalized score function of the data. For these models with i.i.d. data the vector is typically of the form: with and . In fact, Appendix B.1 shows that this quadratic expansion assumption is satisfied uniformly over a large class of DGPs in models with discrete data. Assumption 4.3(i) requires the quasi-posterior to be proper. Assumption 4.3(ii) is a standard prior mass and smoothness condition used to establish BvM theorems for identified parametric models (see, e.g., Section 10.2 of van der Vaart (2000)) but applied to . Under a flat prior on and a continuous local mapping , this assumption is easily satisfied (see its verification in examples of Section 5).
Assumptions 4.1(i) and 4.2 imply that the QLR statistic for satisfies
| (19) |
(see Lemma F.1). Therefore, under the generalized information equality , which holds for a correctly-specified likelihood, an optimally-weighted or continuously-updated GMM, or various (generalized) empirical-likelihood criterions, the asymptotic distribution of becomes , which is defined as
| (20) |
where denotes the distribution of a random vector . This recovers the known asymptotic distribution result for QLR statistics under point identification. If then reduces to , the cdf of (a chi-square random variable with degree of freedom). If is polyhedral then is the distribution of a chi-bar-squared random variable (i.e. a mixture of chi-squared distributions with different degrees of freedom where the mixture weights depend on ).
Let denote the distribution of a random vector (conditional on the data), and denote the convex cone translated to have vertex at . The next lemma establishes the large sample behavior of the posterior distribution of the QLR statistic.
Lemma 4.1.
This result shows that the posterior distribution of the QLR statistic is asymptotically when , which may be viewed as a Bayesian Wilks theorem for partially identified models, and asymptotically (first-order) stochastically dominates when is a closed convex cone. Note that Lemma 4.1 does not require the generalized information equality to hold. This lemma extends known BvM results for possibly misspecified likelihood models with point-identified -consistent and asymptotically normally estimable parameters (see Kleijn and van der Vaart (2012) and the references therein) to allow for other models with failure of , with partially-identified parameters and/or parameters on a boundary.
Let denote the quantile of under the posterior distribution , and let be as stated in Remark 1.
Assumption 4.4.
(MC convergence)
.
Lemma 4.1 and Assumption 4.4 together imply that our Procedure 1 CS is always a well-defined (quasi-)Bayesian credible set (BCS) regardless of whether holds or not. Further, together with Equation (19), they imply the following result.
Theorem 4.1.
Theorem 4.1 shows that we need the generalized information equality to hold so that our Procedure 1 CS has valid frequentist coverage for in large samples.151515This is consistent with the fact that percentile CSs also need in order to have a correct coverage for a point-identified scalar parameter (see, e.g., Chernozhukov and Hong (2003) and Robert and Casella (2004)). This is because the asymptotic distribution of is only under . It follows that, with a criterion satisfying , our CS will be asymptotically exact (for ) when , and asymptotically valid but possibly conservative when is a convex cone.
Remark 3.
Theorem 4.1 is still applicable to misspecified, separable partially-identified likelihood models. We can write the density in such models as where is an identifiable reduced-form parameter (see Section 5.1.1 below). Under misspecification the identified set is where is the unique maximizer of over . Following the insight of Müller (2013), we could base our inference on the sandwich log-likelihood function:
where approximately maximizes over and is the sandwich covariance matrix estimator for . If and with positive definite, then Assumption 4.2 will hold with where and .
Remark 4.
In correctly specified likelihood models with flat priors, one may interpret as a HPD 100% BCS for . Moon and Schorfheide (2012) (MS hereafter) show that BCSs for a partially identified parameter (or subvectors) can under-cover asymptotically. As CSs for should be larger than CSs for , MS’s result might appear to suggest that our Procedure 1 CS would under-cover for . The “apparent contradiction” is because a key regularity condition in MS’s under-coverage result (their Assumption 2 on p. 767) is violated in our setting. For partially identified separable models, MS put a prior on the globally identified reduced-form parameter , say , and then a conditional prior, say , on the structural parameter given . The conditional prior needs to be supported on what would be the identified set for if were the true reduced form parameter. Their Assumption 2 requires that is (locally) Lipschitz in , which is violated in our setting. We only put a prior on . This prior on induces a prior on and a conditional prior that is supported on . Since if and only if , for any our induced conditional prior satisfies
thereby violating MS’s Lipschitz condition (their Assumption 2). See Remark 3 in MS for additional discussion of violation of their Lipschitz condition.
4.1.1 Models with singularities
In this subsection we consider (possibly) partially identified models with singularities.161616Such models are also referred to as non-regular models or models with non-regular parameters. In identifiable parametric models , the standard notion of differentiability in quadratic mean requires that the mass of the part of that is singular with respect to the true distribution vanishes faster than as (Le Cam and Yang, 1990, section 6.2). If this condition fails then the log-likelihood will not be locally quadratic at . By analogy with the identifiable case, we say a non-identifiable model has a singularity if it does not admit a local quadratic approximation (in the reduced-form reparameterization) like that in Assumption 4.2. One example is the missing data model under identification (see Subsection 5.3.1 below).
To allow for partially identified models with singularities, we first generalize the notion of the local reduced-form reparameterization to be of the form from into where and with if and only if . The following regularity conditions generalize Assumptions 4.2 and 4.3 to allow for singularity.
Assumption 4.2.
(Local quadratic approximation with singularity)
(i) There exist sequences of random variables and -valued random vectors (both measurable in ), and a sequence of functions (measurable in ) with (almost surely), such that as :
| (22) |
with and where ;
(ii) .
Let denote the image of the measure under the map . Let denote a ball of radius centered at the origin.
Assumption 4.3.
(Prior with singularity)
(i) almost surely
(ii) has a continuous, strictly positive density on for some .
Discussion of Assumptions:
Assumption 4.2’ is generalizes of Assumption 4.2 to the singular case. Assumption 4.2’ implies that the peak of the likelihood does not concentrate on sets of the form . Recently, Bochkina and Green (2014) established a BvM result for identifiable parametric likelihood models with singularities. They assume the likelihood is locally quadratic in some parameters and locally linear in others (similar to Assumption 4.2’(i)) and that the local parameter space satisfies conditions similar to our Assumption 4.2’(ii). Assumption 4.3’ generalizes Assumption 4.3 to the singular case. We impose no further restrictions on the set .
The next lemma shows that the posterior distribution of the QLR asymptotically (first-order) stochastically dominates in partially identified models with singularity.
Lemma 4.2 immediately implies the following result.
Theorem 4.2.
For non-singular models, Theorem 4.1 establishes that is asymptotically valid for , with asymptotically exact coverage when is linear and can be conservative when is a closed convex cone. For singular models, Theorem 4.2 shows that is still asymptotically valid for but can be conservative even when is linear.171717It might be possible to establish asymptotically exact coverage of for in singular models where the singular part in Assumption 4.2’ possesses some extra structure. When applied to the missing data example, Theorems 4.1 and 4.2 imply that for is asymptotically exact under partial identification but conservative under point identification. This is consistent with simulation results reported in Table 1; see Section 5.3.1 below for details.
4.2 Coverage properties of for
Here we present conditions under which has correct coverage for the identified set of subvectors . Recall the definition of from Section 2. The profile criterion for and the profile QLR for are defined the same way as those in (11) and (13) respectively:
Assumption 4.5.
Discussion of Assumption 4.5:
By definition of (in display (2)) we have: and also for any . Thus
Assumption 4.5 imposes some structure on the profile QLR statistic for over the local neighborhood . It implies that the profile QLR for is of the form:
| (24) |
When , the asymptotic distribution of becomes :
The functional form of depends on the local reparameterization and the geometry of . When is a singleton and then equation (24) is typically satisfied with where with and the QLR statistic is asymptotically . For a non-singleton set , will typically be more complex. In the missing data example, we show in Section 5 that where and are halfspaces and . Here the resulting profile QLR statistic for is asymptotically the maximum of two mixtures of random variables. Note that the existence of is merely a proof device, and one does not need to know its precise expression in the implementation of our Procedure 2 CS for .
The next lemma is a new BvM-type result for the posterior distribution of the profile QLR for . Note that this result also allows for singular models.
Lemma 4.3.
Let Assumptions 4.1, 4.2, 4.3, and 4.5 or 4.1, 4.2’, 4.3’, and 4.5 hold. Then for any interval such that is continuous on , we have:
And hence we have:
(i) If and is subconvex,181818We say that is quasiconvex if is convex for each and subconvex if, in addition, for all . The conclusion of Lemma 4.3(i) remains valid under the weaker condition that (i) is quasiconvex and (ii) holds, where is the quantile of and is the polar cone of . then: for all .
(ii) If then: .
Let denote the quantile of the profile QLR under the posterior distribution , and be given in Remark 2.
Assumption 4.6.
(MC convergence)
.
The next theorem is an important consequence of Lemma 4.3.
Theorem 4.3.
Theorem 4.3(ii) shows that our Procedure 2 CSs for can have asymptotically exact coverage if even if the model is singular. In the missing data example, Theorem 4.3(ii) implies that for is asymptotically exact irrespective of whether the model is point-identified or not (see Subsection 5.3.1 below). Theorem 4.3(i) shows that the CSs for can have conservative coverage when is a convex cone (see Appendix C.2 for a moment inequality example).
4.3 Coverage properties of for of scalar subvectors
This section presents one sufficient condition for validity of our Procedure 3 CS for . We say a half-space is regular if it is of the form for some .
Assumption 4.7.
(Profile QLR, bound)
for all , where for some and and are regular half-spaces in .
Theorem 4.4.
Let Assumption 4.7 hold and let the distribution of be continuous at its quantile. Then: .
The following proposition presents a set of sufficient conditions for Assumption 4.7.
Proposition 4.1.
Suppose (which is true when is connected and bounded). If is strictly concave in then condition (ii) of Proposition 4.1 holds. The other conditions of Proposition 4.1 are easy to verify as in the missing data example (see Subsection 5.3.1 below).
The exact distribution of depends on the geometry of and . For the missing data example, the polar cones of and are at least apart. The worst-case coverage (i.e., the case in which asymptotic coverage of will be most conservative) will occur when the polar cones of and are orthogonal, in which case has the mixture distribution where is a point mass at zero and is the distribution of the product of two independent random variables. The quantiles of the distribution of are continuous in for all . For all configurations of and in this example, the distribution of (first-order) stochastically dominates and is (first-order) stochastically dominated by (i.e., ). Notice that this is different from the usual chi-bar-squared case encountered when testing whether a parameter belongs to the identified set on the basis of finitely many moment inequalities (Rosen, 2008).
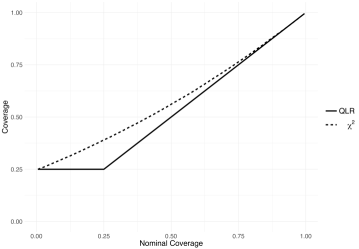
To get an idea of the degree of conservativeness of , consider the class of models satisfying conditions for Proposition 4.1. Figure 4 plots the asymptotic coverage of and against nominal coverage for models in this class where is most conservative for the missing data example (i.e., the worst-case coverage). For each model in this class, the asymptotic coverage of and is between the nominal coverage and the worst-case coverage. As can be seen, the coverage of is exact at all levels for which the distribution of the profile QLR is continuous at its quantile, as shown in Theorem 4.3(ii). On the other hand, is asymptotically conservative, but the level of conservativeness decreases as increases towards one. Indeed, for levels of in excess of the level of conservativeness is negligible.
Since empirical papers typically report CSs for scalar parameters, Theorem 4.4 will be very useful in applied work. One could generalize to deal with vector-valued subvectors by allowing quantiles with higher degrees of freedom , but it might be difficult to provide sufficient conditions as those in Proposition 4.1 to establish results like Theorem 4.4.
5 Sufficient Conditions and Examples
This section provides sufficient conditions for the key regularity condition, Assumption 4.2, in possibly partially identified likelihood and moment-based models with i.i.d. data. See Appendix B.1 for low-level conditions to ensure that Assumption 4.2 holds uniformly over a large class of DGPs in discrete models. We also verify Assumptions 4.1, 4.2 (or 4.2’), 4.3 and 4.5) in examples.
We use standard empirical process notation: denotes the expectation of under the true probability measure , denotes expectation of under the empirical measure, and denotes the empirical process.
5.1 Partially identified likelihood models
Consider a parametric likelihood model where each is a probability density with respect to a common -finite dominating measure . Let be the true density under the data-generating probability measure, denote the Kullback-Leibler divergence, and denote the squared Hellinger distance between densities and . The identified set is .
5.1.1 Separable likelihood models
For a large class of partially identified parametric likelihood models , there exists a function for some possibly unknown , such that for each and some densities . In this case we say that the model is separable and admits a (global) reduced-form reparameterization. The reparameterization is assumed to be identifiable, i.e. for any . The identified set is where is the true parameter, i.e. . Models with discrete choice probabilities (such as the missing data and entry game designs we used in simulations) fall into this framework, where the vector maps the structural parameters to the model-implied probabilities of discrete outcomes and the true probabilities of discrete outcomes are point-identified.
The following result presents one set of sufficient conditions for Assumptions 4.1(ii) and 4.2 under conventional smoothness assumptions.
Let , let and denote the score and Hessian, let and let and .
Proposition 5.1.
Suppose that satisfies the following regularity conditions:
(a) is an i.i.d. sample from with identifiable and on the interior of ;
(b) is continuous and there is a neighborhood of on which is twice continuously differentiable for each , with and for some ;
(c) , is non-singular, and ;
(d) is compact and is strictly positive and continuous on .
Then: there exists a sequence with and such that Assumptions 4.1(ii) and 4.2 hold for the average log-likelihood (3) over with , , and .
5.1.2 General non-identifiable likelihood models
It is possible to define a local reduced-form reparameterization for non-identifiable likelihood models, even when does not admit an explicit (global) reduced-form reparameterization. Let denote the set of all limit points of:
as and let . The set is the set of generalized Hellinger scores,202020It is possible to define sets of generalized scores via other measures of distance between densities. See Liu and Shao (2003) and Azaïs et al. (2009). Our results can easily be adapted to these other cases. which consists of functions of with mean zero and unit variance. The cone is the tangent cone of the model at . We say that is differentiable in quadratic mean (DQM) if each is absolutely continuous with respect to and for each there are elements and remainders such that:
with as . If the linear hull of has finite dimension , then we can write each as where and the elements of form an orthonormal basis for in . Let denote the orthogonal projection212121If is a closed convex cone, the projection of any is defined as the unique element of such that . onto and let be given by
| (25) |
Proposition 5.2.
Suppose that satisfies the following regularity conditions:
(a) is -Glivenko Cantelli;
(b) is DQM, is closed and convex and has finite dimension ;
(c) there exists such that is Donsker and has envelope .
Then: there exists a sequence with and , such that Assumption 4.2 holds for the average log-likelihood (3) over
with , , and defined in (25).
5.2 GMM models
Consider the GMM model with . Let and the identified set be (we assume throughout this subsection that is non-empty). When is of higher dimension than , the set will not contain a neighborhood of the origin. But, if the map is smooth (e.g. is a smooth manifold) then can typically be locally approximated at the origin by a closed convex cone .
To simplify notation, we assume that for any we may partition so that its upper elements are (possibly) non-zero and the remaining elements (this can always be achieved by multiplying the moment functions by a suitable rotation matrix).222222See our July 2016 working paper version for details. If contains a neighborhood of the origin then we simply take and . Let denote the projection of onto and note that . Finally, define .
Proposition 5.3.
Suppose that satisfies the following regularity conditions:
(a) there exists such that is Donsker;
(b) for each and is positive definite;
(c) there exists such that as ;
(d) there exists such that as .
Then: there exists a sequence with and such that Assumption 4.2 holds for the CU-GMM criterion (4) over , where
, , , and and .
If contains a neighborhood of the origin then and .
Proposition 5.4.
5.2.1 Moment inequality models
Consider the moment inequality model where is a vector of moments and the space is . The identified set for is (the inequality is understood to hold element-wise). We may reformulate the moment inequality model as a moment equality model by augmenting the parameter vector with a vector of slackness parameters . Thus we re-parameterize the model by and write the inequality model as a GMM model with
| (26) |
where the identified set for is and is the projection of onto . Here the objective function would be as in display (4) or (5) using . We may then apply Propositions 5.3 or 5.4 to the reparameterized GMM model (26).
As the parameter of interest is , one could use our Procedures 2 or 3 for inference on . These procedures involve the profile criterion which is simple to compute because the GMM objective function is quadratic in for given (since the optimal weighting or continuous updating weighting matrix will typically not depend on ). See Example 3 in Subsection 5.3.3.
5.3 Examples
5.3.1 Example 1: missing data model in Subsection 3.1.1
We revisit the missing data example in Subsection 3.1.1, where the parameter space for is given in (15), the identified set for is given in (16), and the identified set for is .
Inference under partial identification:
Consider the case in which the model is partially identified (i.e. ). The likelihood of the -th observation is
where:
with . Conditions (a)-(b) of Proposition 5.1 hold and Assumption 4.2 is satisfied with ,
and . A flat prior on in (15) induces a flat prior on , which verifies Condition (c) of Proposition 5.1 and Assumption 4.3. Therefore, Theorem 4.1(ii) implies that our CSs for has asymptotically exact coverage.
Now consider CSs for . Here . By concavity in , the profile log-likelihood for is:
where and . The inner maximization problem is:
Let and and let:
where is from Proposition 5.1. It follows that:
Equation (24) and Assumption 4.7 therefore hold with where and are regular halfspaces in . Theorem 4.4 implies that the CS is asymptotically valid (but conservative) for .
To verify Assumption 4.5, take sufficiently large that for all . Then:
| (27) |
This is geometrically the same as the profile QLR for up to a translation of the local parameter space from to . The local parameter spaces are approximated by and . It follows that uniformly in ,
verifying Assumption 4.5. Theorem 4.3(ii) implies that has asymptotically exact coverage.
Inference under identification:
Now consider the case in which the model is identified (i.e. and ) and . Here each so the likelihood of the -th observation is
Lemma F.5 in Appendix F shows that with as in (15) and a flat prior, the posterior concentrates on the local neighborhood for any positive sequence with , .
In this case, the reduced-form parameter is and the singular part is . Uniformly over we obtain:
which verifies Assumption 4.2’(i) with
and . The remaining parts of Assumption 4.2’ are easily shown to be satisfied. Therefore, Theorem 4.2 implies that for will be asymptotically valid but conservative.
For inference on , the profile LR statistic is asymptotically and equation (24) holds with and . To verify Assumption 4.5, for each we need to solve
at and . The maximum is achieved when is as small as possible, i.e., when . Substituting in and maximizing with respect to :
Therefore, we obtain the following expansion uniformly for :
where the last equality holds because . This verifies that Assumption 4.5 holds with . Thus Theorem 4.3(ii) implies that has asymptotically exact coverage for , even though is conservative for in this case.
5.3.2 Example 2: entry game with correlated shocks in Subsection 3.1.2
Consider the bivariate discrete game with payoffs described in Subsection 3.1.2. Here we consider a slightly more general setting, in which denotes a general joint distribution (not just bivariate Gaussian) for indexed by a parameter . This model falls into the class of models dealt with in Proposition 5.1. Conditions (a)-(b) and (d) of Proposition 5.1 hold with and under very mild conditions on the parameterization (which, in turn, is determined by the specification of ). Assumption 4.2 is therefore satisfied with:
where denotes a matrix of ones,
and . Condition (c) of Proposition 5.1 and Assumption 4.3 can be verified under mild conditions on the map and the prior . For instance, consider the parameterization where the joint distribution of is a bivariate Normal with mean zero, standard deviations one and positive correlation . The parameter space is
where and . The image measure of a flat prior on is positive and continuous on a neighborhood of the origin, which verifies Condition (c) of Proposition 5.1 and Assumption 4.3. Therefore, Theorem 4.1(ii) implies that our MC CSs for will have asymptotically exact coverage.
5.3.3 Example 3: a moment inequality model
As a simple illustration, suppose that is identified by the inequality where are i.i.d. with unknown mean and unit variance. The identified set for is , which is the argmax of the population criterion function (see Figure 5). The sample criterion is typically used in the moment inequality literature but violates our Assumption 4.2. However, we can rewrite the model as the moment equality model: where is a slackness parameter. The parameter space for is . The identified set for is and the identified set for is (see Figure 5). The GMM objective function is then:
It is straightforward to show that where . Moreover, and so the profile QLR for is .
Figure 5: Panel (a): identified set for as the argmax of the population (moment inequality) criterion . Panel (b): identified set for for the moment equality model .
For the posterior of the profile QLR, we also have and . The profile QLR for is
This maps into our framework with the local reduced-form parameter . Consider the case where and are positive constants (we consider this case for the moment just to illustrate verification of our conditions). Here and a positive continuous prior on and induces a prior on that is positive and continuous at the origin. Moreover, Assumption 4.5 holds with . The regularity conditions of Theorem 4.3 hold, and hence has asymptotically exact coverage for .
More generally, Appendix C.2 shows that under very mild conditions our CS is uniformly valid over a class of DGPs , i.e.:
where and the set allows for any mean (encompassing, in particular, point-identified, partially identified, and drifting-to-point identified cases). In contrast, we construct sequences of DGPs along which bootstrap-based CSs fail to cover with the prescribed coverage probability, i.e.:
This reinforces the fact that our MC CSs for have very different asymptotic properties from bootstrap-based CSs for .
6 Conclusion
We propose new methods for constructing CSs for identified sets in partially-identified econometric models. Our CSs are relatively simple to compute and have asymptotically valid frequentist coverage uniformly over a class of DGPs, including partially- and point- identified parametric likelihood and moment based models. We show that under a set of sufficient conditions, and in broad classes of models, our set coverage is asymptotically exact. We also show that in models with singularities (such as the missing data example), our MC CSs for may be slightly conservative, but our MC CSs for identified sets of subvectors could still be asymptotically exact. Simulation experiments demonstrate the good finite-sample coverage properties of our proposed CS constructions in standard difficult situations. We also illustrate our proposed CSs in two realistic empirical examples.
There are numerous extensions we plan to address in the future. The first natural extension is to allow for semiparametric likelihood or moment based models involving unknown and possibly partially-identified nuisance functions. We think this paper’s MC approach could be extended to the partially-identified sieve MLE based inference in Chen et al. (2011). A related, important extension is to allow for nonlinear structural models with latent state variables. Finally, we plan to study possibly misspecified and partially identified models.
References
- Andrews (1999) Andrews, D. (1999). Estimation when a parameter is on a boundary. Econometrica 67(6), 1341–1383.
- Andrews and Barwick (2012) Andrews, D. and P. J. Barwick (2012). Inference for parameters defined by moment inequalities: A recommended moment selection procedure. Econometrica 80(6), 2805–2826.
- Andrews and Guggenberger (2009) Andrews, D. and P. Guggenberger (2009). Validity of subsampling and plug-in asymptotic inference for parameters defined by moment inequalities. Econometric Theory 25, 669–709.
- Andrews and Soares (2010) Andrews, D. and G. Soares (2010). Inference for parameters defined by moment inequalities using generalized moment selection. Econometrica 78(1), 119–157.
- Armstrong (2014) Armstrong, T. (2014). Weighted KS statistics for inference on conditional moment inequalities. Journal of Econometrics 181(2), 92–116.
- Azaïs et al. (2009) Azaïs, J.-M., E. Gassiat, and C. Mercadier (2009). The likelihood ratio test for general mixture models with or without structural parameter. ESAIM: Probability and Statistics 13, 301–327.
- Beresteanu and Molinari (2008) Beresteanu, A. and F. Molinari (2008). Asymptotic properties for a class of partially identified models. Econometrica 76(4), 763–814.
- Berry (1992) Berry, S. T. (1992). Estimation of a model of entry in the airline industry. Econometrica: Journal of the Econometric Society, 889–917.
- Bochkina and Green (2014) Bochkina, N. A. and P. J. Green (2014). The Bernstein-von Mises theorem and nonregular models. The Annals of Statistics 42(5), 1850–1878.
- Bugni (2010) Bugni, F. (2010). Bootstrap inference in partially identified models defined by moment inequalities: Coverage of the identified set. Econometrica 78(2), 735–753.
- Bugni et al. (2016) Bugni, F., I. Canay, and X. Shi (2016). Inference for subvectors and other functions of partially identified parameters in moment inequality models. Quantitative Economics forthcoming.
- Canay (2010) Canay, I. A. (2010). EL inference for partially identified models: Large deviations optimality and bootstrap validity. Journal of Econometrics 156(2), 408–425.
- Chen and Gao (2017) Chen, X. and F. Gao (2017). A reverse gaussian correlation inequality by adding cones. Statistics and Probability Letters 123, 84–87.
- Chen et al. (2011) Chen, X., E. Tamer, and A. Torgovitsky (2011). Sensitivity analysis in semiparametric likelihood models. Cowles foundation discussion paper no 1836, Yale and Northwestern.
- Chernoff (1954) Chernoff, H. (1954). On the distribution of the likelihood ratio. The Annals of Mathematical Statistics 25(3), pp. 573–578.
- Chernozhukov and Hong (2003) Chernozhukov, V. and H. Hong (2003). An MCMC approach to classical estimation. Journal of Econometrics 115(2), 293 – 346.
- Chernozhukov and Hong (2004) Chernozhukov, V. and H. Hong (2004). Likelihood estimation and inference in a class of nonregular econometric models. Econometrica 72(5), 1445–1480.
- Chernozhukov et al. (2007) Chernozhukov, V., H. Hong, and E. Tamer (2007). Estimation and confidence regions for parameter sets in econometric models. Econometrica 75(5), 1243–1284.
- Chopin (2002) Chopin, N. (2002). A sequential particle filter method for static models. Biometrika 89(3), 539–552.
- Chopin (2004) Chopin, N. (2004, 12). Central limit theorem for sequential monte carlo methods and its application to bayesian inference. Ann. Statist. 32(6), 2385–2411.
- Del Moral et al. (2006) Del Moral, P., A. Doucet, and A. Jasra (2006). Sequential monte carlo samplers. Journal of the Royal Statistical Society: Series B (Statistical Methodology) 68(3), 411–436.
- Del Moral et al. (2012) Del Moral, P., A. Doucet, and A. Jasra (2012, 02). On adaptive resampling strategies for sequential monte carlo methods. Bernoulli 18(1), 252–278.
- Durham and Geweke (2014) Durham, G. and J. Geweke (2014). Adaptive Sequential Posterior Simulators for Massively Parallel Computing Environments, Chapter 1, pp. 1–44.
- Fan et al. (2000) Fan, J., H.-N. Hung, and W.-H. Wong (2000). Geometric understanding of likelihood ratio statistics. Journal of the American Statistical Association 95(451), 836–841.
- Flinn and Heckman (1982) Flinn, C. and J. Heckman (1982). New methods for analyzing structural models of labor force dynamics. Journal of Econometrics 18(1), 115–168.
- Gassiat (2002) Gassiat, E. (2002). Likelihood ratio inequalities with application to various mixtures. Ann. I. H. Poincaré – PR 38(6), 897–906.
- Geyer (1994) Geyer, C. J. (1994). On the asymptotics of constrained -estimation. The Annals of Statistics 22(4), 1993–2010.
- Ghosal et al. (2000) Ghosal, S., J. K. Ghosh, and A. W. van der Vaart (2000). Convergence rates of posterior distributions. The Annals of Statistics 28(2), 500–531.
- Helpman et al. (2008) Helpman, E., M. Melitz, and Y. Rubinstein (2008). Estimating trade flows: Trading partners and trading volumes. The Quarterly Journal of Economics 123(2), 441–487.
- Herbst and Schorfheide (2014) Herbst, E. and F. Schorfheide (2014). Sequential monte carlo sampling for DSGE models. Journal of Applied Econometrics 29(7), 1073–1098.
- Hirano and Porter (2003) Hirano, K. and J. Porter (2003). Asymptotic efficiency in parametric structural models with parameter-dependent support. Econometrica 71(5), 1307–1338.
- Imbens and Manski (2004) Imbens, G. W. and C. F. Manski (2004). Confidence intervals for partially identified parameters. Econometrica 72(6), 1845–1857.
- Kaido et al. (2016) Kaido, H., F. Molinari, and J. Stoye (2016). Confidence intervals for projections of partially identified parameters. Working paper, Boston University and Cornell.
- Kitagawa (2012) Kitagawa, T. (2012). Estimation and inference for set-identified parameters using posterior lower probability. Working paper, University College London.
- Kleijn and van der Vaart (2012) Kleijn, B. and A. van der Vaart (2012). The Bernstein-Von-Mises theorem under misspecification. Electronic Journal of Statistics 6, 354–381.
- Kline and Tamer (2016) Kline, B. and E. Tamer (2016). Bayesian inference in a class of partially identified models. Quantitative Economics 6, 329–366.
- Le Cam and Yang (1990) Le Cam, L. and G. L. Yang (1990). Asymptotics in Statistics: Some Basic Concepts. Springer.
- Liao and Simoni (2016) Liao, Y. and A. Simoni (2016). Posterior properties of the support function for set inference. Working paper, Rutgers University and CREST.
- Liu (2004) Liu, J. S. (2004). Monte Carlo Strategies in Scientific Computing. Springer.
- Liu and Shao (2003) Liu, X. and Y. Shao (2003). Asymptotics for likelihood ratio tests under loss of identifiability. The Annals of Statistics 31(3), 807–832.
- Moon and Schorfheide (2012) Moon, H. R. and F. Schorfheide (2012). Bayesian and frequentist inference in partially identified models. Econometrica 80(2), pp. 755–782.
- Müller (2013) Müller, U. K. (2013). Risk of Bayesian inference in misspecified models, and the sandwich covariance matrix. Econometrica 81(5), 1805–1849.
- Newey and McFadden (1994) Newey, W. K. and D. McFadden (1994). Chapter 36 large sample estimation and hypothesis testing. Volume 4 of Handbook of Econometrics, pp. 2111–2245. Elsevier.
- Norets and Tang (2014) Norets, A. and X. Tang (2014). Semiparametric inference in dynamic binary choice models. The Review of Economic Studies 81(3), 1229–1262.
- Robert and Casella (2004) Robert, C. P. and G. Casella (2004). Monte Carlo Statistical Methods. Springer: New York.
- Romano et al. (2014) Romano, J., A. Shaikh, and M. Wolf (2014). Inference for the identified set in partially identified econometric models. Econometrica.
- Romano and Shaikh (2010) Romano, J. P. and A. M. Shaikh (2010). Inference for the identified set in partially identified econometric models. Econometrica 78(1), 169–211.
- Rosen (2008) Rosen, A. M. (2008). Confidence sets for partially identified parameters that satisfy a finite number of moment inequalities. Journal of Econometrics 146(1), 107 – 117.
- Santos Silva and Tenreyro (2015) Santos Silva, J. M. C. and S. Tenreyro (2015). Trading partners and trading volumes: Implementing the helpman–melitz–rubinstein model empirically. Oxford Bulletin of Economics and Statistics 77(1), 93–105.
- Schwartz (1965) Schwartz, L. (1965, Mar). On bayes procedures. Zeitschrift für Wahrscheinlichkeitstheorie und Verwandte Gebiete 4(1), 10–26.
- Stoye (2009) Stoye, J. (2009). More on confidence intervals for partially identified parameters. Econometrica 77(4), 1299–1315.
- van der Vaart (2000) van der Vaart, A. W. (2000). Asymptotic statistics. Cambridge University Press.
- van der Vaart and Wellner (1996) van der Vaart, A. W. and J. A. Wellner (1996). Weak Convergence and Empirical Processes. Springer-Verlag.
Appendix A Additional details for the simulations and applications
A.1 An adaptive Sequential Monte Carlo algorithm
We use an adaptive Sequential Monte Carlo (SMC) algorithm to sample from the quasi-posterior in (6). Conventional MCMC algorithms such as the Metropolis-Hastings algorithm may fail to generate representative samples from the quasi-posterior in partially identified models or, more generally, models with multi-modal quasi-posteriors. For instance, the MCMC chain may get stuck exploring a single mode and fail to explore other modes if there is insufficient mass bridging the modes. In contrast, the SMC algorithm we use propagates large clouds of draws, in parallel, over a sequence of tempered distributions which begins with the prior, slowly incorporates information from the criterion, and ends with the quasi-posterior. The algorithm sequentially discards draws with relatively low mass as information is added, duplicates those with relatively high mass, then mutates the draws via a MCMC step to generate new draws (preventing particle impoverishment). Moreover, the algorithm is adaptive, i.e., the tuning parameters for the sequence of proposal distributions in the MCMC step are determined in a data-driven way.
The algorithm we use and its exposition below closely follows Herbst and Schorfheide (2014) who adapt a generic adaptive SMC algorithm to deal with large-scale DSGE models.232323See Chopin (2002, 2004) and Del Moral et al. (2006) for the generic SMC algorithm for estimating static model parameters, Del Moral et al. (2012) and references therein for adaptive selection of tuning parameters with a SMC framework. A similar algorithm is proposed by Durham and Geweke (2014), who emphasize its parallelizability. Let and be positive integers and let be an increasing sequence with and . Set for and draw from the prior . Then for :
-
1.
Correction: Let and .
-
2.
Selection: Compute the effective sample size . Then:
-
(a)
If : set for ; or
-
(b)
If : draw an i.i.d. sample from the multinomial distribution with support and weights , then set for .
-
(a)
-
3.
Mutation: Run separate and independent MCMC chains of length using the random-walk Metropolis-Hastings algorithm initialized at each for the tempered quasi-posterior and let be the final draw of the th chain.
The resulting sample is for . Multinomial resampling (step 2) and the independent MCMC chains (step 3) can both be computed in parallel, so the additional computational time relative to conventional MCMC methods is modest.
In practice, we take , , or (see below for the specific used in the simulations and empirical applications), and with . When the dimension of is low, in step 3 we use a proposal density (all parameters are transformed to have full support) where is chosen adaptively to target an acceptance ratio by setting and
for , where is the acceptance ratio from the previous iteration. If the dimension of is large, we partition into random blocks (we assign each element of to a block by drawing from the uniform distribution on ) then apply a blockwise random-walk Metropolis-Hastings (i.e. Metropolis-within-Gibbs) algorithm. Here the proposal density we use for block is where is chosen as before, is the covariance of the draws from iteration , and is the sub-matrix of corresponding to block .
As the SMC procedure uses a particle approximation to the posterior, in practice compute quantiles for procedure 1 using:
| (28) |
and similarly for the profile QLR for procedure 2.
A.2 Example 1: missing data
SMC algorithm: We implement the SMC algorithm with and a proposal in the mutation step for all simulations for this example.
Additional simulation results: Here we present additional simulation results for the missing data example using (i) a likelihood criterion and curved prior and (ii) a continuously-updated GMM criterion and flat prior. For the “curved” prior, we take with , , and . Figure 6 plots the marginal curved priors for and .
Results for the likelihood criterion with curved prior are presented in Table 6, and are very similar to those presented in Table 1, though the coverage of percentile-based CSs is worse here for the partially identified cases (). Results for the CU-GMM criterion and flat prior are presented in Table 7. Results for Procedures 2 and 3 are very similar to the results with a likelihood criterion and show coverage very close to nominal coverage in point point- and partially-identified cases. Here procedure 1 does not over-cover in the point-identified case because the weighting matrix is singular when the model is identified, which forces the draws to concentrate on the region in which . This, in turn, means projection is no longer conservative in the point-identified case, though it is still very conservative in the partially-identified cases. Percentile CSs again under-cover badly in the partially-identified case.
| (Point ID) | ||||||||||||||||||
|---|---|---|---|---|---|---|---|---|---|---|---|---|---|---|---|---|---|---|
| 0.90 | 0.95 | 0.99 | 0.90 | 0.95 | 0.99 | 0.90 | 0.95 | 0.99 | ||||||||||
| (Procedure 1) | ||||||||||||||||||
| 100 | .911 | — | .957 | — | .990 | — | .898 | — | .950 | — | .989 | — | .985 | — | .994 | — | .999 | — |
| 250 | .906 | — | .954 | — | .993 | — | .899 | — | .951 | — | .991 | — | .992 | — | .997 | — | 1.000 | — |
| 500 | .908 | — | .956 | — | .992 | — | .910 | — | .957 | — | .991 | — | .994 | — | .998 | — | 1.000 | — |
| 1000 | .896 | — | .948 | — | .989 | — | .905 | — | .954 | — | .989 | — | .996 | — | .999 | — | 1.000 | — |
| (Procedure 2) | ||||||||||||||||||
| 100 | .890 | [] | .948 | [] | .990 | [] | .911 | [] | .952 | [] | .992 | [] | .912 | [] | .961 | [] | .990 | [] |
| 250 | .905 | [] | .953 | [] | .991 | [] | .913 | [] | .957 | [] | .992 | [] | .917 | [] | .962 | [] | .993 | [] |
| 500 | .913 | [] | .957 | [] | .992 | [] | .915 | [] | .955 | [] | .993 | [] | .919 | [] | .959 | [] | .993 | [] |
| 1000 | .898 | [] | .948 | [] | .988 | [] | .898 | [] | .948 | [] | .990 | [] | .913 | [] | .954 | [] | .992 | [] |
| (Procedure 3) | ||||||||||||||||||
| 100 | .922 | [] | .950 | [] | .989 | [] | .912 | [] | .942 | [] | .989 | [] | .909 | [] | .941 | [] | .985 | [] |
| 250 | .910 | [] | .949 | [] | .989 | [] | .913 | [] | .951 | [] | .990 | [] | .891 | [] | .952 | [] | .992 | [] |
| 500 | .898 | [] | .952 | [] | .992 | [] | .910 | [] | .947 | [] | .990 | [] | .911 | [] | .948 | [] | .992 | [] |
| 1000 | .892 | [] | .944 | [] | .989 | [] | .892 | [] | .944 | [] | .986 | [] | .902 | [] | .941 | [] | .987 | [] |
| (Projection) | ||||||||||||||||||
| 100 | .971 | [] | .988 | [] | .997 | [] | .966 | [] | .987 | [] | .997 | [] | .985 | [] | .994 | [] | .999 | [] |
| 250 | .971 | [] | .987 | [] | .999 | [] | .969 | [] | .986 | [] | .998 | [] | .992 | [] | .997 | [] | 1.000 | [] |
| 500 | .975 | [] | .988 | [] | .998 | [] | .972 | [] | .989 | [] | .998 | [] | .994 | [] | .998 | [] | 1.000 | [] |
| 1000 | .965 | [] | .983 | [] | .997 | [] | .966 | [] | .985 | [] | .998 | [] | .996 | [] | .999 | [] | 1.000 | [] |
| (Percentile) | ||||||||||||||||||
| 100 | .000 | [] | .037 | [] | .398 | [] | .458 | [] | .646 | [] | .866 | [] | .902 | [] | .951 | [] | .989 | [] |
| 250 | .000 | [] | .075 | [] | .438 | [] | .480 | [] | .653 | [] | .867 | [] | .909 | [] | .954 | [] | .992 | [] |
| 500 | .000 | [] | .098 | [] | .468 | [] | .488 | [] | .660 | [] | .878 | [] | .910 | [] | .955 | [] | .991 | [] |
| 1000 | .000 | [] | .107 | [] | .472 | [] | .483 | [] | .655 | [] | .866 | [] | .901 | [] | .948 | [] | .989 | [] |
| Comparison with GMS CSs for via moment inequalities | ||||||||||||||||||
| 100 | .810 | [] | .909 | [] | .981 | [] | .806 | [] | .896 | [] | .979 | [] | .894 | [] | .943 | [] | .974 | [] |
| 250 | .800 | [] | .897 | [] | .978 | [] | .798 | [] | .897 | [] | .976 | [] | .903 | [] | .951 | [] | .984 | [] |
| 500 | .795 | [] | .902 | [] | .980 | [] | .788 | [] | .894 | [] | .977 | [] | .905 | [] | .950 | [] | .987 | [] |
| 1000 | .785 | [] | .885 | [] | .973 | [] | .785 | [] | .884 | [] | .973 | [] | .895 | [] | .943 | [] | .986 | [] |
| (Point ID) | ||||||||||||||||||
|---|---|---|---|---|---|---|---|---|---|---|---|---|---|---|---|---|---|---|
| 0.90 | 0.95 | 0.99 | 0.90 | 0.95 | 0.99 | 0.90 | 0.95 | 0.99 | ||||||||||
| (Procedure 1) | ||||||||||||||||||
| 100 | .910 | — | .951 | — | .989 | — | .888 | — | .938 | — | .972 | — | .914 | — | .945 | — | .990 | — |
| 250 | .908 | — | .958 | — | .994 | — | .901 | — | .952 | — | .988 | — | .904 | — | .950 | — | .990 | — |
| 500 | .912 | — | .957 | — | .992 | — | .923 | — | .965 | — | .993 | — | .904 | — | .954 | — | .990 | — |
| 1000 | .909 | — | .955 | — | .989 | — | .912 | — | .963 | — | .995 | — | .911 | — | .953 | — | .989 | — |
| (Procedure 2) | ||||||||||||||||||
| 100 | .921 | [] | .965 | [] | .993 | [] | .913 | [] | .949 | [] | .991 | [] | .914 | [] | .945 | [] | .990 | [] |
| 250 | .911 | [] | .956 | [] | .993 | [] | .913 | [] | .953 | [] | .993 | [] | .904 | [] | .950 | [] | .990 | [] |
| 500 | .908 | [] | .954 | [] | .991 | [] | .912 | [] | .953 | [] | .991 | [] | .904 | [] | .954 | [] | .990 | [] |
| 1000 | .904 | [] | .953 | [] | .989 | [] | .902 | [] | .950 | [] | .990 | [] | .911 | [] | .953 | [] | .989 | [] |
| (Procedure 3) | ||||||||||||||||||
| 100 | .921 | [] | .949 | [] | .989 | [] | .913 | [] | .946 | [] | .989 | [] | .914 | [] | .945 | [] | .990 | [] |
| 250 | .911 | [] | .951 | [] | .992 | [] | .914 | [] | .952 | [] | .993 | [] | .886 | [] | .950 | [] | .991 | [] |
| 500 | .909 | [] | .950 | [] | .990 | [] | .913 | [] | .948 | [] | .990 | [] | .904 | [] | .947 | [] | .989 | [] |
| 1000 | .902 | [] | .950 | [] | .989 | [] | .901 | [] | .950 | [] | .988 | [] | .902 | [] | .948 | [] | .988 | [] |
| (Projection) | ||||||||||||||||||
| 100 | .977 | [] | .990 | [] | .999 | [] | .970 | [] | .988 | [] | .998 | [] | .914 | [] | .945 | [] | .990 | [] |
| 250 | .972 | [] | .992 | [] | .999 | [] | .976 | [] | .992 | [] | .999 | [] | .904 | [] | .950 | [] | .990 | [] |
| 500 | .975 | [] | .988 | [] | .998 | [] | .979 | [] | .992 | [] | 1.000 | [] | .904 | [] | .954 | [] | .990 | [] |
| 1000 | .972 | [] | .986 | [] | .998 | [] | .975 | [] | .991 | [] | .999 | [] | .911 | [] | .953 | [] | .989 | [] |
| (Percentile) | ||||||||||||||||||
| 100 | .399 | [] | .665 | [] | .939 | [] | .642 | [] | .800 | [] | .954 | [] | .912 | [] | .945 | [] | .990 | [] |
| 250 | .386 | [] | .642 | [] | .914 | [] | .641 | [] | .804 | [] | .954 | [] | .903 | [] | .950 | [] | .990 | [] |
| 500 | .384 | [] | .639 | [] | .911 | [] | .638 | [] | .803 | [] | .952 | [] | .905 | [] | .953 | [] | .989 | [] |
| 1000 | .392 | [] | .647 | [] | .908 | [] | .651 | [] | .803 | [] | .950 | [] | .909 | [] | .954 | [] | .989 | [] |
| Comparison with GMS CSs for via moment inequalities | ||||||||||||||||||
| 100 | .806 | [] | .908 | [] | .978 | [] | .803 | [] | .900 | [] | .976 | [] | .899 | [] | .946 | [] | .975 | [] |
| 250 | .787 | [] | .898 | [] | .979 | [] | .798 | [] | .898 | [] | .978 | [] | .896 | [] | .946 | [] | .981 | [] |
| 500 | .788 | [] | .896 | [] | .978 | [] | .786 | [] | .898 | [] | .976 | [] | .898 | [] | .950 | [] | .985 | [] |
| 1000 | .789 | [] | .892 | [] | .979 | [] | .800 | [] | .893 | [] | .977 | [] | .906 | [] | .950 | [] | .986 | [] |
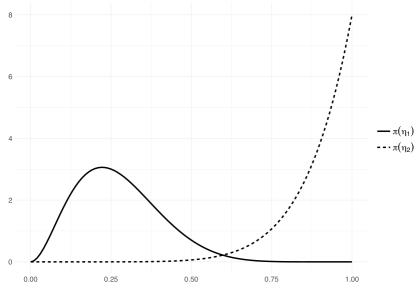
A.3 Example 2: entry game with correlated shocks
SMC Algorithm: As there are 6 partially-identified parameters here instead of 2 in the previous example, we initially increased to reduce the distance between the successive tempered distributions. Like Herbst and Schorfheide (2014), whose DSGE examples use , we also found the effect of increasing similar to the effect of increasing . We therefore settled on which was more computationally efficient than using larger . We again use a proposal in the mutation step for all simulations for this example.
Procedure 2: Unlike the missing data example, where is known in closed form, here the set is no longer known in closed form if . We therefore calculate for numerically in order to implement procedure 2 for (in which case ) and (in which case ) . Let denote the KL distance between and or any , which is given by
where denotes the probability that player takes action and player takes action when the true structural parameter is . Clearly if and only if . We compute the endpoints of the interval by solving
| (29) |
where for and for . The profiled distance is independent of the data and is very fast to compute. Note that we do not make explicit use of the separable reparameterization in terms of reduced-form choice probabilities when computing . Moreover, computation of can be run in parallel for once the draws have been generated.
To accommodate a small amount of optimization error, in practice we replace the equality in (29) by a small tolerance . The effect of this slight relaxation is to make our CSs computed via procedure 2 slightly more conservative than if the interval were known in closed form.
A.4 Airline entry game application
SMC algorithm: We implement the adaptive SMC algorithm with iterations, blocked random-walk Metropolis-Hastings steps per iteration with blocks for the full model and blocks for the fixed- model
Procedure 2: To implement procedure 2 here with any scalar subvector we calculate numerically (in parallel), analogously to the entry game simulation example. We again compute the endpoints of by solving (29) for the subvector of interest.
As the log-likelihood is conditional upon regressors, we replace by the sum of the KL distances between the conditional distributions of outcomes given regressors, namely:
where denotes the probabilities of market outcomes conditional upon regressors when the structural parameter is .
![[Uncaptioned image]](/html/1605.00499/assets/x21.png)
![[Uncaptioned image]](/html/1605.00499/assets/x22.png)
![[Uncaptioned image]](/html/1605.00499/assets/x23.png)
![[Uncaptioned image]](/html/1605.00499/assets/x24.png)
![[Uncaptioned image]](/html/1605.00499/assets/x25.png)
![[Uncaptioned image]](/html/1605.00499/assets/x26.png)
![[Uncaptioned image]](/html/1605.00499/assets/x27.png)
![[Uncaptioned image]](/html/1605.00499/assets/x28.png)
![[Uncaptioned image]](/html/1605.00499/assets/x29.png)
![[Uncaptioned image]](/html/1605.00499/assets/x30.png)
![[Uncaptioned image]](/html/1605.00499/assets/x31.png)
![[Uncaptioned image]](/html/1605.00499/assets/x32.png)
![[Uncaptioned image]](/html/1605.00499/assets/x33.png)
![[Uncaptioned image]](/html/1605.00499/assets/x34.png)
![[Uncaptioned image]](/html/1605.00499/assets/x35.png)
![[Uncaptioned image]](/html/1605.00499/assets/x36.png)
![[Uncaptioned image]](/html/1605.00499/assets/x37.png)
![[Uncaptioned image]](/html/1605.00499/assets/x38.png)
![[Uncaptioned image]](/html/1605.00499/assets/x39.png)
A.5 Trade flow application
Priors: We use the change of variables and and assume that the transformed correlation and variance all have full support. We specify and independent priors on each of these 46 parameters.
SMC Algorithm: Given the high dimensionality of the parameter vector and the lack of a natural restriction of the parameter space for many of the parameters, we use a slight modification of the SMC algorithm described as follows.
We initialize the procedure from drawing from the distribution, where is the MLE and is the inverse negative hessian at the MLE.
There are two more minor modifications which need to be made to correct the particle weights from initializing the algorithm in this manner. First, in the correction step, we replace by where denotes the density evaluated at . Second, we use the tempered quasi-posterior in the updating step.
With these modifications, the algorithm is implemented with block random-walk Metropolis-Hastings steps per iteration and blocks.
Procedure 2: To implement procedure 2 here with any scalar subvector we calculate numerically. We find the smallest and largest values of for which the average (across regressors) KL divergence, namely
is approximately zero. We then set where and denote the smallest and largest such values of for which the average KL divergence is minimized. If is not an interval then the interval will be a superset of and the resulting CSs will be slightly conservative.
To compute , let be a dummy variable denoting exports from to and let . We may write the model more compactly as:
where collects the trade friction variables and dummy variables for importer and exporter’s continent and and collect all coefficients in the selection and outcome equations, respectively. Therefore,
The likelihood is
where
The conditional KL divergence between and is then straightforward to compute numerically (e.g. via Gaussian quadrature). Note also that the sets for and for each subvector of interest can be computed in parallel once the draws have been generated.
Appendix B Uniformity
Here we present conditions under which our CSs (Procedure 1) and (Procedure 2) are uniformly valid over a class of DGPs . For each , let denote the population objective function under . We assume that for each , and are upper semicontinuous and . The identified set is and the identified set for a subvector is for some .
We now show that, under a natural extension of the assumptions in Section 4, the CSs and are uniformly valid i.e.:
| (30) | ||||
| (31) |
both hold. The following Lemmas are straightforward extensions of Lemmas 2.1 and 2.2, but are helpful to organize ideas. Let be a sequence of random variables. We say that uniformly in if for each , and that uniformly in if for each . Uniform statements are defined analogously.
Lemma B.1.
Let there exist sequences of random variables such that:
(i) uniformly in ; and
(ii) for any positive sequence with .
Then: (30) holds for .
Lemma B.2.
Let there exist sequences of random variables such that:
(i) uniformly in ; and
(ii) for any positive sequence with .
Then: (31) holds for .
The following regularity conditions ensure that and are uniformly valid over . Let denote a sequence of local neighborhoods of such that for each and for each . In what follows we omit the dependence of on to simplify notation.
Assumption B.1.
(Consistency, posterior contraction)
(i) uniformly in .
(ii) uniformly in .
We restate our conditions on local quadratic approximation of the criterion allowing for singularity. Recall that a local reduced-form reparameterization is defined on a neighborhood of . We require that for all , for all sufficiently large. For nonsingular the reparameterization is of the form from into where if and only if . For singular the reparameterization is of the form from into where if and only if . We require the dimension of to be between and for each , with independent of . Let denote a ball of radius centered at the origin (the dimension will be obvious depending on the context) and let denote Gaussian measure on .
To simply notation, in what follows we omit dependence of , , , , , , , , , , , , , , and on .
Assumption B.2.
(Local quadratic approximation)
(i) For each , there exist vectors , sequences of random variables and -valued random vectors , and a sequence of non-negative measurable functions with (we take and for nonsingular ), such that as :
| (32) |
uniformly in , with , and (uniformly in );
(ii) where and ;
(iii) for each singular : .
Let denote the image measure of under the map if is nonsingular and if is singular. We omit dependence of , and on in what follows.
Assumption B.3.
(Prior)
(i) -almost surely for each ;
(ii) Each has a density on (or if is nonsingular) for some which are uniformly (in ) positive and continuous at the origin.
The next lemma is a uniform-in- extension of Lemmas 4.1 and 4.2. Recall that is the distribution of a random vector (conditional on data).
Lemma B.3.
As in Section 4, we let denote the quantile of under the posterior distribution .
Assumption B.4.
(MC convergence)
uniformly in .
The following result is a uniform-in- extension of Theorems 4.1 and 4.2. Recall that where denotes the distribution of a random vector. We say that the distributions are equicontinuous at their quantiles (denoted ) if for each there is such that for each and as . This is trivially true if for each and .
Theorem B.1.
To establish (31) we require a uniform version of Assumptions 4.5 and 4.6. In what follows, we omit dependence of on to simplify notation.
Assumption B.5.
(Profile QL)
(i) For each , there exists a measurable function such that:
uniformly in , with , , and from Assumption B.2;
(ii) (almost surely) for each ;
(iii) for all .
Note that parts (ii) and (iii) of Assumption B.5 automatically hold with equality if . These conditions are not needed in the following result that is a uniform-in- extension of Lemma 4.3.
Lemma B.4.
Let denote the quantile of under the posterior distribution .
Assumption B.6.
(MC convergence)
uniformly in .
The following result is a uniform-in- extension of Theorem 4.3.
Theorem B.2.
B.1 A uniform quadratic expansion for discrete distributions
In this subsection we present low-level conditions that show the uniform quadratic expansion assumption is satisfied over a large class of DGPs in discrete models. Let (possibly depending on ) be a class of distributions such that for each , are i.i.d. discretely distributed on sample space where . Let the -vector denote the probabilities for and write if for all . We identify a vector with its probability vector and a generic distribution with the -vector .
Our uniform quadratic approximation result encompasses a large variety of drifting sequence asymptotics, allowing to drift towards at rate up to (but not including) . That is, the first set of results concern any class of distributions for which
| (33) |
For any with and any , define the (squared) chi-square distance of from as
For each , let where is a positive sequence to be defined below. Also let denote a -vector with in its th entry and elsewhere, let , and let .
Lemma B.5.
Let (33) hold. Then: there exists a positive sequence with as such that:
uniformly in , where for each :
We are not quite done, as the covariance matrix is a rank orthogonal projection matrix. Let denote an orthonormal basis for and define the matrix by . Notice that is orthogonal (i.e. ) and
| (42) |
Let and denote the upper entries of and :
| (49) |
We say that uniformly in if where denotes the distance (in the Prokhorov metric) between the sampling distribution of and the distribution.
Proposition B.1.
We may generalize Proposition B.1 to allow for the support as under a very mild condition on the growth rate of . This result would be very useful in extending our procedures to semi/nonparametric models via discrete approximations of growing dimension. As before, let where is a positive sequence to be defined below.
Proposition B.2.
Let . Then: there exists a positive sequence with as such that:
uniformly in .
We now present two lemmas which are helpful in verifying the other conditions of Assumptions B.2 and B.5, respectively. Often, models may be parametrized such that where denotes the unit simplex in . The following result shows that the sets each cover a ball of radius (not depending on ) with .
Lemma B.6.
For the next result, let where is a positive sequence to be defined below.
Lemma B.7.
Appendix C Verification of main conditions for uniformity in examples
C.1 Example 1: uniform validity for missing data
Here we apply Proposition B.1 to establish uniform validity of our procedures. To make the missing data example fit the preceding notation, let and let denote the true probabilities under . The only requirement on is that (33) holds. Therefore, Proposition B.1 holds uniformly over a set of DGPs under which the probability of missing data can drift to zero at rate up to . As , Lemma B.6 implies that covers a ball of radius (independently of ) with as . This verifies parts (i)–(iv) of Assumption B.2.
By concavity, the infimum in the definition of the profile likelihood is attained at either the lower or upper bound of . Moreover, at both and , the profile likelihood is
The constraint will be the binding constraint at the lower bound and the constraint will be the binding constraint at the upper bound (wpa1, uniformly in ). These constraints are equivalent to and for some and . It now follows from Proposition B.1 and Lemmas B.6 and B.7 that
and
uniformly in . Let denote the closed convex cone in defined by the inequality for . We may write the above as
uniformly in . This verifies the uniform expansion of the profile criterion.
C.2 Example 3: uniform validity of Procedure 2 vs the bootstrap
We return to Example 3 considered in Subsection 5.3.3 and show that our MC CSs (based on the posterior distribution of the profile QLR) are uniformly valid under very mild conditions while bootstrap-based CSs (based on the bootstrap distribution of the profile QLR) can undercover along certain sequences of DGPs. This reinforces the fact that our MC CSs and bootstrap-based CSs have different asymptotic properties.
Recall that are i.i.d. with unknown mean and is identified by the moment inequality . The identified set for is . We consider coverage of the CS for We introduce a slackness parameter to write this model as a moment equality model . The parameter space for is . The GMM objective function and profile QLR are
| (50) | ||||
where .
C.2.1 Uniform validity of Procedures 2 and 3
Let be the family of distributions under which the are i.i.d. with mean and unit variance and for which
| (51) |
holds, where . We first consider uniform coverage of our MC CSs for the identified set .
To focus solely on the essential ideas, assume the prior on induces a uniform prior on (the posterior is still proper); this could be relaxed at the cost of more cumbersome notation without changing the results that follow. Letting , and , we have:
A change of variables with yields:
As we have an explicit form for the posterior distribution of the profile QLR, we can compute the posterior critical value directly rather than resorting to MC sampling. Therefore, Assumption B.6 is not required here (since we can trivially set ). If MC sampling were to be used, we would require that Assumption B.6 holds.
C.2.2 Lack of uniformity of the bootstrap
We now show that bootstrap-based CSs for are not uniformly valid when the standard (i.e. nonparametric) bootstrap is used. The bootstrap criterion function is
where is the bootstrap sample mean. Let . Consider a subsequence with for some (chosen below). By similar calculations to Subsection 5.3.3, along this sequence of DGPs, the bootstrapped profile QLR statistic for is:
Let denote the -quantile of the distribution of . Consider
We now show that for any we may choose in the definition of such that the asymptotic coverage of is strictly less than along this sequence of DGPs. Since
it follows that whenever the bootstrap distribution of the profile QLR for is point mass at the origin, and the -quantile of the bootstrap distribution is . However, the QLR statistic for is . So whenever we also have that . Therefore,
It follows by (51) that for any for which , we have:
C.2.3 An alternative recentering
An alternative is to recenter the criterion function at , that is, one could use instead
similar to the idea of a sandwich (quasi-)likelihood with . This maps into the setup described in Appendix B, where
where , and
where , , and .
Assumption B.1 and B.2(i)–(iii) hold with , , , and (none of the models are singular). We again take a prior on that induces a flat prior on to concentrate on the essential ideas, verifying Assumption B.3.
For inference on , observe that
where for each , verifying Assumption B.5(i). Assumption B.5(ii) also holds for this . Finally, for Assumption B.5(iii), for any we have
Theorem B.2, together with (51), delivers uniform coverage for Procedure 2.
Similarly, for uniform validity of Procedure 3 we have:
which, together with (51), delivers uniform coverage for Procedure 3.
Now consider bootstrap-based inference. As before, let and consider a subsequence with for some . Under , we then have:
and the true QLR statistic is . We again show that for any we may choose in the definition of such that the asymptotic coverage of is strictly less than along this sequence of DGPs. Observe that when we have and . Therefore,
It follows by (51) that for any for which , we again have:
Appendix D Local power
In this appendix we study the behavior of the CSs and under -local (contiguous) alternatives. We maintain the same setup as in Section 4. Fix .
Assumption D.1.
There exist sequences of distributions such that as :
(i) ;
(ii) ;
(iii) There exist sequences of random variables and -valued random vectors (both measurable in ) such that:
| (54) |
with , where and ;
(iv) holds -almost surely;
(v) has a continuous, strictly positive density on for some ;
(vi) .
Assumption D.1 is essentially a restatement of Assumptions 4.1 to 4.4 with a modified quadratic expansion. Notice that with we obtain and Assumption D.1 corresponds to Assumptions 4.1 to 4.4 with generalized information equality and .
Let denote the noncentral distribution with degrees of freedom and noncentrality parameter and let denote its cdf. Let denote the quantile of the (standard) distribution .
Theorem D.1.
We now present a similar result for . To do so, we extend the conditions in Assumption D.1.
Assumption D.1.
Let the following also hold under the local alternatives:
(vii) There exists a measurable such that:
with from Assumption D.1(iii).
(vi) .
Let and denote the distribution of . Let the distribution of be continuous at its -quantile, which we denote by .
Theorem D.2.
It follows from Anderson’s lemma (van der Vaart, 2000, Lemma 8.5) that
whenever is subconvex. In particular, this includes the case in which is a singleton.
Appendix E Parameter-dependent support
In this appendix we briefly describe how our procedure may be applied to models with parameter dependent support under loss of identifiability. Parameter-dependent support is a feature of certain auction models (e.g., Hirano and Porter (2003), Chernozhukov and Hong (2004)) and some structural models in labor economics (e.g., Flinn and Heckman (1982)). For simplicity we just deal with inference on the full vector, though the following results could be extended to subvector inference in this context.
We again presume the existence of a local reduced-form parameter such that if and only if . In what follows we assume without loss of generality that since is not required in order to compute the confidence set. We replace Assumption 4.2 (local quadratic approximation) with the following assumption, which permits the support of the data to depend on certain components of the local reduced-form parameter .
Assumption E.2.
(i) There exist functions and , a sequence of -valued random vectors , and a positive sequence with such that:
with and ;
(ii) there exist such that for each ;
(iii) the sets cover for any positive sequence with and .
This assumption is similar to Assumptions 2-3 in Fan et al. (2000) but has been modified to allow for non-identifiable parameters . Let denote a Gamma distribution with shape parameter and scale parameter . The following lemma shows that the posterior distribution of the QLR converges to .
By modifying appropriately the arguments in Fan et al. (2000) one can show that, under Assumption E.2, . The following theorem states that one still obtains asymptotically correct frequentist coverage of .
We finish this section with a simple example. Consider a model in which are i.i.d. where . Let the true distribution of the data be . The identified set is .
Then we use the reduced-form parameter . Let . Here we take where slower than (e.g. ). It is straightforward to show that:
where denotes the Gamma distribution with shape parameter and scale parameter . Furthermore, taking and we may deduce that:
Notice that and that the sets cover . A smooth prior on will induce a smooth prior on , and the result follows from Theorem E.1.
Appendix F Proofs and Additional Results
F.1 Proofs and Additional Lemmas for Sections 2 and 4
Proof of Lemma 2.1.
By (ii), there is a positive sequence with such that holds wpa1. Therefore:
and the result follows by part (i). If then we may replace the preceding inequality by an equality. ∎
Proof of Lemma F.1.
Proof of Lemma 4.1.
We first prove equation (21). Since , we have:
| (57) |
by Assumption 4.1(ii). Moreover by Assumptions 4.1(ii) and 4.3(i),
and hence:
| (58) |
In view of (57) and (58), it suffices to characterize the large-sample behavior of:
| (59) |
Lemma F.1 and Assumption 4.2 imply that there exists a positive sequence independent of with such that the inequalities:
both hold wpa1. Therefore, wpa1 we have:
uniformly in . Let . A change of variables yields:
| (60) |
Recall from Assumption 4.3(ii). The inclusion holds for all sufficiently large by Assumption 4.2. Taking sufficiently large and using Assumption 4.3(ii), we may deduce that there exists a positive sequence with such that:
for each . Substituting into (60):
uniformly in , where “” denotes integration with respect to Lebesgue measure on .
Let and let denote a ball of radius in centered at the origin. Using the change of variables , we can rewrite the preceding inequalities as:
with the understanding that is empty if .
Let denote Gaussian measure. We now show that:
| (61) | ||||
| (62) |
Consider (61). To simplify presentation, we assume wlog that . As
| (63) |
holds for events with , we have:
As is tight and has positive volume, we may deduce that
| (64) |
It also follows by tightness of and Assumption 4.2 that , which proves (61). Result (62) now follows by (64) and the fact that:
since . This completes the proof of result (21).
Proof of Theorem 4.1.
We verify the conditions of Lemma 2.1. We may assume without loss of generality that because does not depend on the precise used (cf. Remark 1). By Lemma F.1 we have:
with when . Let denote the quantile of the distribution of .
Proof of Lemma F.2.
Using Assumptions 4.1(i) and 4.2’, we obtain:
| (67) |
because and with , for all thus:
Then by Assumption 4.2’(i) and definition of , we obtain:
where the term holds uniformly over . This proves expression (66).
Since and for , and (almost surely), we therefore have . ∎
Proof of Lemma 4.2.
We first show that relation (23) holds. By identical arguments to the proof of Lemma 4.1, it is enough to characterize the large-sample behavior of defined in (59). By Lemma F.2 and Assumption 4.2’, there exists a positive sequence independent of with such that:
both hold wpa1. Also note that for any , we have
because . Therefore, wpa1 we have:
uniformly in . Define and . By similar arguments to the proof of Lemma 4.1, Assumption 4.3’(ii) and a change of variables yield:
which holds uniformly in (wpa1) for some . By Tonelli’s theorem and Assumption 4.2’(ii), the preceding inequality becomes:
The rest of the proof of inequality (23) follows by similar arguments to the proof of Lemma 4.1. The conclusion now follows by combining inequalities (23) and (65). ∎
Proof of Theorem 4.2.
We verify the conditions of Lemma 2.1. Again, we assume wlog that . By Lemma F.2, when , we have:
| (68) |
where . Lemma 4.2 shows that the posterior distribution of the QLR asymptotically (first-order) stochastically dominates the distribution. The result follows by the same arguments as the proof of Theorem 4.1(i). ∎
Proof of Lemma F.3.
Proof of Lemma 4.3.
We prove the result under Assumptions 4.1, 4.2’, 4.3’, and 4.5. The proof under Assumptions 4.1, 4.2, 4.3, and 4.5 follows similarly. By the same arguments as the proof of Lemma 4.1, it suffices to characterize the large-sample behavior of:
| (69) |
By Lemma F.3 and Assumption 4.2’, there exists a positive sequence independent of with such that the inequalities:
both hold wpa1. Therefore, wpa1 we have:
uniformly in . By similar arguments to the proof of Lemma 4.2, we may use the change of variables , continuity of (Assumption 4.3’(ii)), and Tonelli’s theorem to restate the preceding inequalities as:
which holds (wpa1) for some . Let . A second change of variables yields:
uniformly in , where it should be understood that is the Minkowski sum with .
The remainder of the proof follows by similar arguments to the proof of Lemma 4.1, noting that
where the final equality is by uniform continuity of bounded, monotone continuous functions. ∎
Proof of Theorem 4.3.
We verify the conditions of Lemma 2.2. Again, we assume wlog that .
To prove Theorem 4.3(i), let denote the quantile of . By Lemma 4.3 we need to show that
holds for all and all in a neighborhood of . To prove this, i is sufficient to show that
holds for each and each . But notice that
where the first inequality is because since and the second inequality is by Theorem 1 of Chen and Gao (2017) (taking , , and in their notation).
Whenever holds (which it does, in particular, when is subconvex), we therefore have:
where the final equality is by Assumption 4.6.
Proof of Theorem 4.4.
By Lemma 2.2, it is enough to show that holds for , where .
Case 1: . Wlog let and . If then so . If then and , so . In either case, we have: for any .
Case 2: . Wlog let then is the positive -axis. Let . If then , so . If then is the negative -axis. So, in this case, , and so .
Now let be the rotation of by radians. This is plotted in Figure 9 for (left panel) and (right panel). The axis of symmetry is the line , which bisects the angle between and .
Suppose lies in the half-space . There are three options:
-
•
(purple region): , , so
-
•
(red region): , , so
-
•
(white region): . To calculate , observe that if we rotate about the origin by then the polar cone becomes the positive axis. Under the rotation, where is the -value of the rotation of by negative . The point rotates to , so we get . We assumed . By the half-angle formula , this means that . But as . Therefore, and so .
We have shown that whenever . Now, for any :
| (70) |
where . Note that and are jointly normal with mean , unit variance, and correlation . The pdf of given is:
As , we have:
and so
Therefore:
| (71) |
But differentiating the right-hand side of (71) with respect to gives:
for any , because is an odd function. Therefore, the probability in display (71) doesn’t depend on the value of . Setting , we obtain:
Therefore, by inequality (70) we have:
By symmetry, we also have . Therefore, we have shown that holds for each . A similar argument applies when is the rotation of by radians. This completes the proof of the case .
Case 3: . As and are closed half-spaces we have and for some . The polar cones are the rays and . There are three sub-cases to consider.
Case 3a: for some . Let . Here , if , and
Therefore, .
Case 3b: for some . Here and , so and if (i.e. if ) and and if (i.e. if ). Therefore .
Case 3c: and are linearly independent. Without loss of generality,242424By Gram-Schmidt, we can always define a new set of coordinate vectors for with and such that is in the span of and . we can take to be the positive -axis (i.e. for some and take to lie in the -plane (i.e. for some ).
Now write where . Note that and . So only the values of and matter in determining whether or not belongs to and .
Without loss of generality we may assume that is, up to scale, a rotation of by (the case can be handled by similar arguments, as in Case 2).
Suppose that . As in Case 2, there are three options:
-
•
: , , so
-
•
: , , so
-
•
: and , so .
Arguing as in Case 2, we obtain . By symmetry, we also have . Therefore, . ∎
F.2 Proofs and Additional Lemmas for Section 5
Proof of Proposition 5.1.
Wlog we can take . Also take large enough that . Then by condition (b), for any such we have:
where is in the segment between and for each element of . We may deduce from Lemma 2.4 of Newey and McFadden (1994) that holds under conditions (a) and (b). Since this term is , we can choose a positive sequence with , such that . Assumption 4.2 then holds over with , , , .
It remains to show that the posterior concentrates on . Choose sufficiently small that . By a similar expansion to the above and condition (c), we have where is in the segment between and . Since as , we may reduce so that . On we then have that there exist finite positive constants and such that . Also note that with by identifiability of , continuity of the map , and compactness of . Standard consistency arguments (e.g. the Corollary to Theorem 6.1 in Schwartz (1965))) then imply that . Since the posterior concentrates on and for all sufficiently large, it’s enough to confine attention to . We have shown that holds on . It now follows by the parametric Bernstein-von Mises theorem (e.g. Theorem 10.1 in van der Vaart (2000)) that the posterior contracts at a -rate, verifying Assumption 4.1(ii). ∎
For the following lemma, let be a positive sequence with and , and . For each with , define and . Recall the definitions of , the tagent cone and the projection from Section 5.1.2. We say is -DQM if each is absolutely continuous with respect to and for each there are and such that:
with as . Let .
Lemma F.4.
Proof of Lemma F.4.
We first prove
| (72) |
by adapting arguments used in Theorem 1 of Azaïs et al. (2009), Theorem 3.1 in Gassiat (2002), and Theorem 2.1 in Liu and Shao (2003).
Take large enough that . Then for each :
| (73) |
where and . By condition (ii), uniformly for . This implies that . Therefore, by the Glivenko-Cantelli condition in (ii):
Each element of has mean zero and so for each . By Condition (iii):
It remains to show:
| (74) |
By condition (iv) and , to establish (74) it is enough to show:
Observe by definition of and condition (i), for each there is a and remainder such that , and so:
| (75) |
By Moreau’s decomposition theorem and inequality (75), we may deduce:
which is by condition (i) and definition of . This proves the first result.
The second result is immediate by defining with where is an orthonormal basis for , and as in (25), then noting that . ∎
Proof of Proposition 5.2.
We verify the conditions of Lemma F.4. By DQM (condition (b)) we have as . Therefore, we may choose a sequence with but slowly enough that
and hence as for any slowly diverging positive sequence with . This verifies condition (i) of Lemma F.4.
For condition (ii), is Glivenko-Cantelli by condition (c) and Lemma 2.10.14 of van der Vaart and Wellner (1996). Moreover, it follows from the envelope condition (in condition (c)) that . We can therefore choose a positive sequence with such that and so for any .
For condition (iv), since is Glivenko-Cantelli we may choose a positive sequence with such that . Therefore, for any we have:
Finally, for condition (iii), note that condition (c) implies that is Donsker. Also note that the singleton is the only limit point of as because:
by DQM (condition (b)). Asymptotic equicontinuity of on then implies that
We can therefore choose a positive sequence with but slowly enough that and so for any :
The result follows by taking . ∎
Proof of Proposition 5.3.
We first show that:
| (76) |
holds for a positive sequence with with . Take large enough that . By conditions (a)–(c) and Lemma 2.10.14 of van der Vaart and Wellner (1996), we have that . Therefore, we may choose a positive sequence with , such that and hence:
| (77) |
for any .
Notice that by condition (a) and that the covariance of each element of vanishes uniformly over as by condition (c). Asymptotic equicontinuity of (which holds under (a)) then implies that . We can therefore choose a positive sequence with , as such that and hence:
| (78) |
for any .
Condition (d) implies that we may choose a sequence with , such that and so:
| (79) |
for any .
Proof of Proposition 5.4.
Follows by similar arguments to the proof of Proposition 5.3, noting that by condition (e) we may choose a positive sequence with slowly such that . Therefore holds for any . ∎
Lemma F.5.
Consider the missing data model with a flat prior on . Suppose that the model is point identified (i.e. the true ). Then Assumption 4.1(ii) holds for
for any positive sequence with ,
Proof of Lemma F.5.
The flat prior on induces a flat prior on under the map . Take large enough that and . Then with , we have:
Integrating first with respect to yields:
where . Note that this implies:
By the triangle inequality, the fact that , and Chebyshev’s inequality:
Similarly:
Using the change of variables in the numerator yields:
Therefore, , as required. ∎
F.3 Proofs and Additional Lemmas for Appendix B
Proof of Lemma B.1.
By condition (i), there exists a positive sequence , such that . Let denote the event on which . Then:
where the second equality is by the definition of . Since , we therefore have:
where the final line is by condition (ii) and definition of . ∎
We use the next Lemma several times in the following proofs.
Lemma F.6.
Let be a closed convex cone and let denote the projection onto . Then:
for any and .
Proof of Lemma F.6.
Let denote the projection onto the polar cone of . Since holds for any and holds for any , we obtain:
Subtracting from both sides and using the fact that yields:
Adding to both sides and completing the square gives . ∎
Lemma F.7.
Proof of Lemma F.7.
Proof of Lemma B.3.
We only prove the case with singularity; the case without singularity follows similarly. By identical arguments to the proof of Lemma 4.2, it is enough to characterize the large-sample behavior of defined in equation (59) uniformly in . By Lemma F.7 and Assumption B.2(i)–(iii), there exist a positive sequence independent of with and a sequence of events with such that:
both hold on for all . Also note that for any and any singular , we have
because . Therefore, on we have:
uniformly in , for all .
Define and (if is singular). The condition in Assumption B.2(i) implies that for all sufficiently large we have for all . By similar arguments to the proof of Lemma 4.2, we use Assumption B.3(ii), a change of variables and Tonelli’s theorem to obtain:
which holds uniformly in for all (on with sufficiently large) for some sequence with . A second change of variables with yields:
where .
Recall that denotes a ball of radius centered at zero. To complete the proof, it is enough to show that:
| (84) |
uniformly in . We split this into three parts. First note that
| (85) |
where the first inequality is by (63) and the second is by the inclusion . Since (by 80) where uniformly in and and , we have
uniformly in . Also notice that, by Assumption B.2(ii),
where, by similar arguments to (85),
| (86) | |||
| (87) |
A sufficient condition for the right-hand side of display (87) to be (uniformly in ) is that
| (88) |
But notice that where the are uniformly tight (by (80) and the condition uniformly in ) and . We may therefore deduce by the condition in Assumption B.2(ii) that (88) holds, and so:
uniformly in . To see that the right-hand side of (85) is (uniformly in ), first note that:
where
(uniformly in ) by (88) and because the term holds uniformly in by (86) and (87). It follows that (uniformly in ) and so, by (85), we obtain:
(uniformly in ). To complete the proof of (84), it remains to show that
holds uniformly in . But here we have:
by uniform equicontinuity of . ∎
Proof of Theorem B.1.
We first prove part (i) by verifying the conditions of Lemma B.1. We assume w.l.o.g. that uniformly in . By display (81) in Lemma F.7 we have uniformly in . This verifies condition (i) with .
For condition (ii) let denote the quantile of under and let be a positive sequence with . By the conditions (almost surely) for each , and the equicontinuity of at their quantiles, we have:
By Condition B.4 it suffices to show that for each
A sufficient condition is that
By Lemma B.3 there exists a sequence of positive constants with and a sequence of events (possibly depending on ) with such that:
holds on for each . But by Theorem 2 of Chen and Gao (2017) we also have:
and hence
holds on for each . Also note that by the equicontinuity of at their quantiles:
| (89) |
for some .
The proof of part (ii) is similar. ∎
Proof of Lemma B.4.
It suffices to characterize the large-sample behavior of defined in (69) uniformly in . By Lemma F.7 and Assumption B.2(i)–(iii), there exist a positive sequence independent of with and a sequence of events with such that:
both hold on for all . By similar arguments to the proof of Lemma 4.3, wpa1 we obtain:
uniformly in for all , for some positive sequence with . To complete the proof, it remains to show that:
uniformly in . This follows by the uniform continuity condition on in the statement of the lemma, using similar arguments to the proofs of Lemmas 4.3 and B.3. ∎
Proof of Theorem B.2.
We verify the conditions of Lemma B.2. We assume w.l.o.g. that uniformly in . By display (82) in Lemma F.7 we have uniformly in . This verifies condition (i) with .
For condition (ii) let denote the quantile of under and let be a positive sequence with . By Assumption B.5(ii), the condition , and equicontinuity of at thier quantiles, we have:
By condition B.6 it suffices to show that for each :
A sufficient condition is that
By Lemma B.4 there exists a sequence of positive constants with and a sequence of events (possibly depending on ) with such that:
holds on for each . But by Assumption B.5(iii) we may deduce that
holds on for each . By equicontinuity of the distribution of we have:
for some . The result now follows by the same arguments as the proof of Theorem B.1. ∎
Proof of Lemma B.5.
To simplify notation, let . Define the generalized score of with respect to as where
Note that and . Also define and notice that is a unit vector (i.e. ). Therefore,
| (90) |
for each and .
For any , a Taylor series expansion of about yields
| (91) |
where as .
By (90), we may choose be a positive sequence with as such that (uniformly in ). Then, for any :
| (92) |
By the two-sided Chernoff bound, for any :
| (93) |
because . It follows that uniformly in . Also notice that where each is a unit vector. Therefore,
| (94) |
Substituting (92) and (94) into (91) yields:
where the term holds uniformly for all with , uniformly for all . We may therefore choose a positive sequence with slowly such that times the term is still uniformly in . Letting , we obtain
where and . ∎
Proof of Proposition B.1.
Uniform convergence in distribution is by Proposition A.5.2 of van der Vaart and Wellner (1996), since implies . ∎
Proof of Proposition B.2.
Proof of Lemma B.6.
For any , the mapping is a homeomorphism because and is an orthogonal matrix. Recall that the upper elements of is the vector and the remaining th element is zero. Therefore, for each the mapping is a homeomorphism. Since and for each , it follows that contains a ball of radius for each (because homeomorphisms map interior points to interior points).
Recall that if and only if (because ). Let . It suffices to show that as . We can map back from any by the inverse mapping given by
for , where denotes the th element of . An equivalent definition of is . As and for each by construction, we therefore need to find the smallest for which for some , for some . This is equivalent to finding the smallest for which
| (95) |
for some , for some . The left-hand side is uniformly for and uniformly in under the condition . Also notice that, since the norm dominates the maximum norm and is an orthogonal matrix, we have
| (96) |
Proof of Lemma B.7.
Condition (93) implies that
where the term holds uniformly in and . By a Taylor expansion of about , it is straightforward to deduce that
| (97) |
In particular, for any and any , we have
| (98) |
uniformly in . We want to show that an equivalence (97) holds uniformly over shrinking -divergence neighborhoods (rather -divergence neighborhoods). By similar arguments to Lemma 3.1 in Liu and Shao (2003), we may deduce that
where again . But, . Moreover, the proof of Proposition B.1 also shows that holds for each and each so uniformly in . This, together with the fact that , yields
where the term holds uniformly for and . Let be a positive sequence with and sufficiently slowly that times the term in the above display is still (uniformly in and ). We then have
Since , this implies that
and so, by (97), we obtain
It now follows by (97) that
where because and implies that there exists an with , so the constraint is never violated for any , for any such . The result follows by taking . ∎
F.4 Proofs for Appendix D
Proof of Theorem D.1.
F.5 Proofs for Appendix E
Proof of Lemma E.1.
By equations (57) and (58) in the proof of Lemma 4.1, it suffices to characterize the large-sample behavior of:
By Assumption E.2(i), there exists a positive sequence with such that: holds uniformly over . Therefore:
By similar arguments to the proof of Lemma 4.1, under Assumption 4.3 there exists a positive sequence with such that for all sufficiently large we have:
under the change of variables , where .
Assumption E.2(ii) implies that:
Using a change of variables:
(with choice of sign as appropriate) and setting , we obtain:
| (99) |
uniformly in , where .
We can use a change of variables for to obtain:
| (100) |
where denotes the volume of the set .
For the remaining integrals over we first fix any so that becomes a deterministic sequence of sets. Let . Assumption E.2(iii) gives for almost every . Now clearly:
(by dominated convergence) for almost every . Therefore:
| (101) |
We may similarly deduce that:
| (102) |
The result follows by substituting (100), (101), and (102) into (99). ∎