Optical study of the antiferromagnetic ordered state in electron-overdoped Ca0.77Nd0.23FeAs2
Abstract
In Ca1-xRExFeAs2 (RE= rare earth), an antiferromagnetic (AFM) phase as well as a structural transition has been reported, even in the electron-overdoped regime. Here we investigated the temperature-dependent in-plane optical spectroscopy of overdoped Ca0.77Nd0.23FeAs2. Upon entering the AFM state, we found an abrupt reduction of low-frequency (500-2 000) spectral weight in the optical conductivity. In sharp contrast to the parent compounds of 122 system, where spin-density-wave gaps have been clearly observed in the AFM state, a gap signature is absent in Ca0.77Nd0.23FeAs2. This may be a consequence of the poor nesting condition between hole and electron pockets. However, a spectral weight analysis shows that the reduced spectral weight at low frequency is transferred to the high frequency range (), pointing to a localization effect. These observations suggest that the AFM order in Ca0.77Nd0.23FeAs2 is most likely to originate from a localized nature rather than Fermi surface nesting.
pacs:
72.15.-v, 74.70.-b, 78.30.-jSince unconventional superconductivity usually arises as a consequence of suppressing an AFM order in the parent compounds by chemical substitution, its pairing mechanism is believed to be intimately related to the magnetism Lee et al. (2006). Understanding the origin of magnetism may provide important clue to the unconventional pairing. The parent compounds of iron-based superconductors (FeSCs), such as BaFe2As2 Richard et al. (2010) and LaFeAsO Yildirim (2008), generally feature well nested hole/electron pockets and undergoes AFM transition at low temperature Chen et al. (2014). Charge doping can degrade the nesting condition to suppress the AFM transition, thus inducing superconductivity at the boundary of AFM phase. Therefore, the paring mechanism has been proposed to be associate with the scattering between hole and electron pockets, which is induced by the nesting related spin-density-wave- (SDW-) type fluctuations Chen et al. (2014); Mazin et al. (2008). In this picture, magnetism, as well as superconductivity, may strongly depend on the topology of the Fermi surface Yin et al. (2011).
However, in FeTe the Fermi surface nesting fails in accounting for the bicollinear AFM order Li et al. (2009). Moreover, in K2Fe4Se5 Mou et al. (2011) and (Li0.8Fe0.2)(OH)FeSe Zhao et al. (2016), even though no hole pockets exist at point, the superconducting gaps still open on the Fermi surfaces. Thus, the pairing mechanism cannot be understood in terms of Fermi surface instability, the electrons below the Fermi surface may also play an important role Chen et al. (2014). Moreover, Iimura et al. Hiraishi et al. (2014); Iimura et al. (2012) has found another superconducting dome and AFM ordered state in electron-overdoped area of REFeAsO1-xHx (RE= rare earth), these anomalous behaviors introduce additional puzzle and could reveal more rich physics in FeSCs. However, since the lack of large sized single crystal, there is difficulty in carrying out detail experiments.
Ca1-xRExFeAs2 is a newly discovered iron-pnictide family with a monotonic structure (space group ) Katayama et al. (2013). It consists of alternatively stacked FeAs and (Ca,RE)As layers. Rare earth doping on Ca site can introduce electrons into the FeAs layers and induce superconductivity with Li et al. (2015). With further electron doping, superconductivity is suppressed, however instead of the Fermi-liquid (FL) behavior in some other iron pnictides, there is a recovery of the AFM order, which is confirmed by recent nuclear magnetic resonance (NMR) Kawasaki et al. (2015) and neutron scattering results Jiang et al. (2016a), similar to what happened in REFeAsO1-xHx Hiraishi et al. (2014). Since the AFM is intimately related to superconductivity, studying such anomalous behavior may provide some new physics and shed new light on the mechanism of the unconventional superconductivity in FeSCs .
In this work, we have synthesized single crystals of the electron overdoped Ca0.77Nd0.23FeAs2 Katayama et al. (2013) (73 K), and measured its temperature dependent in-plane reflectivity before and after the AFM phase transition. To analysis the optical conductivity, we use two Drude components to describe the low energy () response, to account for the multiband nature of FeSCs Wu et al. (2010); Dai et al. (2015). Such two-Drude model reveals a narrow temperature-dependent Drude item representing the coherent response, and a broad temperature-independent Drude one representing the incoherent response. Across the phase transition, we notice that the broad Drude component is significantly suppressed. Correspondingly, the spectral weight of optical conductivity at low frequency (50-2 000) is reduced. Unlike the parent compound of 122 system, a lack of the signature of SDW transition in the optical conductivity indicates the poor nesting condition. However, a spectral weight analysis shows that the reduced spectral weight at low frequency is transferred to the high frequency area (), indicating a localization effect, such as Hund’s rule coupling. We infer that the magnetism in such electron-overdoped system may come from a localization effect and do not rely on the topology of the Fermi surface.
High-quality single crystal of Ca1-xNdxFeAs2 were synthesized by heating a mixture of Ca, Nd, FeAs, As powders with nominal composition of Katayama et al. (2013); Kudo et al. (2014), typical size was about 330.1 mm3. The composition determined by Inductive Coupled Plasma Emission Spectrometer (ICP) was Ca0.77Nd0.23FeAs2. Resistivity measurement was taken on Quantum Design Physical Property Measurement System (PPMS). Magnetization was measured using a Quantum Design superconducting quantum interference device (SQUID). The reflectivity from the cleaved surface has been measured at a near-normal angle of incidence on a Fourier transform infrared spectrometer (Bruker 80v) for light polarized in the planes using an evaporation technique. Homes et al. (1993) Data from 40 to 15 000 were collected at 8 different temperatures from 15 to 300 K on an ARS-Helitran cryostat. The reflectivity in visible and UV range (10 000-40 000) at room temperature was taken with an Avaspec 204814 optical fiber spectrometer. The optical conductivity has been determined from a Kramers-Kronig analysis of reflectivity over the entire frequency range. Since the measurement is made in a limited energy range. A Hagen-Rubens relation () is used for low-frequency extrapolation. Above the highest-measured frequency (40 000), is assumed to be constant up to 40 eV, above which a free-electron response () is used Dai et al. (2013).
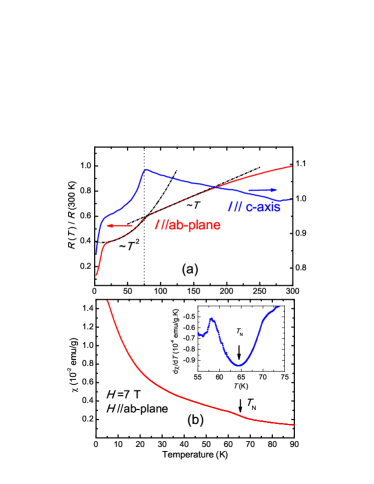
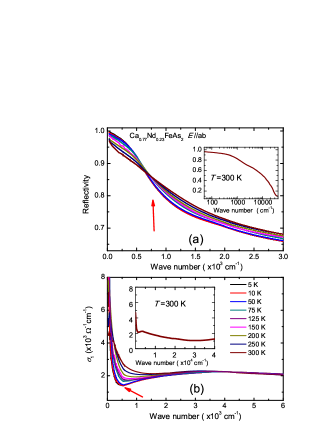
Fig. 1(a) shows the temperature dependent resistance with plane and axis, we note that above 73 K the in-plane resistance shows a metallic behavior which decreases upon cooling, while the inter-plane resistance shows an insulating behavior, i.e., increases with decreasing temperature. It means that even though the CaAs layer has been reported to be metallic, the inter-layer coupling is still weak. While at 73 K, we note a sudden drop on both curves, and a kink could also be observed in its magnetic susceptibility [Fig. 1(b)], these anomalies have been demonstrated to be caused by structural and AFM phase transition Jiang et al. (2016a). Below 10 K, another drop in [Fig. 1(a)] may come from the filamentary superconductivity. In addition to these observations, we also note that, in the normal state, the in-plane resistance shows an obvious non-Fermi-liquid (NFL) behavior(discrepancy of the behavior) Analytis et al. (2014); Dai et al. (2015), but after the phase transition the system becomes much more coherent. Such phenomenon can be understood in terms of the spin-fluctuations scattering, i.e., in the normal state, there exists strong spin fluctuation to scatter the carrier and results in NFL behavior, while in the magnetic ordered state the fluctuation is greatly suppressed Dai et al. (2015).
The measured in-plane reflectivity and the real part of the optical conductivity are summarized in Fig. 2, for selected temperature above and below the AFM phase transition. The reflectivity shows a typical metallic behavior, approaching unity at low frequencies () and increasing upon cooling. After the AFM phase transition, a suppression of in the mid-infrared range (500-2 000) can be seen. Correspondingly, similar behavior is also found in the optical conductivity spectra, indicating the change of the band structure and a loss of density of states near the Fermi level. Comparing with BaFe2As2, which also undergoes an AFM phase transition Hu et al. (2008), below 73 K, no additional gaplike feature below 3 000 can be found, indicating no SDW transition happened in Ca0.77Nd0.23FeAs2, the reason will be discussed later.
To quantitatively analyze the optical data of Ca0.77Nd0.23FeAs2, we fit the with a simple Drude-Lorentz mode for the dielectric function:
| (1) |
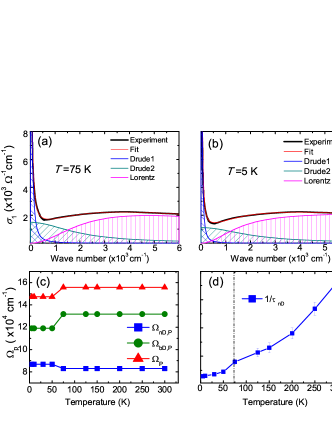
where is the real part of the dielectric function at high frequencies, the second term corresponds to the Drude response characterized by a plasma frequency , with a carrier concentration and an effective mass, and the scattering rate. The third term is a sum of Lorentz oscillators characterized by a resonance frequency , a linewidth , and an oscillator strength . The Drude term accounts for the itinerant carrier (intraband) response, while the Lorentz contributions represent the localized (interband) excitations Homes et al. (2015). The complex conductivity (in units of ). The fitting results shown in Fig. 3(a)(b) can well reproduce the experimental results.
Fig. 3(a)(b) summarize the fitting results, considering the multiband nature of FeSCs, we use two Drude component(a narrow one and a broad one) and a Lorentz components to describe the optical response below 6 000 Wu et al. (2010). The narrow Drude item has strongly temperature-dependent scattering rate at low temperature(, 10 K) and represents the coherent response. Whereas the scattering rate of the broad Drude item is 2 000or larger, corresponding to a mean free path shorter than the lattice spacing and indicating a highly incoherent character Nakajima et al. (2014a, b). The broad Drude item is much stronger than the narrow one, but it almost does not change with the temperature, representing an incoherent background Homes et al. (2015). Across the AFM transition, in Fig. 3(c) we note the broad Drude component is greatly suppressed. Meanwhile, the scattering rate of the coherent response is also reduced [Fig. 3(d)]. Considering the suppressed spin fluctuation in AFM ordered state, we infer the incoherent response may have a relation with the AFM fluctuation. The overall plasma frequency is considered to contribute from both narrow and broad Drude component with . In Fig. 3(c), we note that even though the narrow Drude component is a little enhanced, the overall frequency is suppressed across the phase transition, indicating a loss of the itinerant carriers after the transition. So where do the lost carriers go?
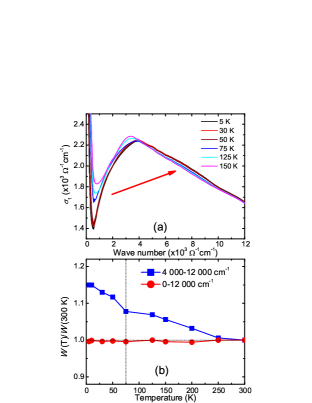
In Fig. 4(b), we have calculated the spectral weight in different areas of optical conductivity. From the results, one notes that the spectral weight at high energy (4 000-15 000) varies significantly with the temperature. Upon cooling, the spectral weight at high frequency is continuously enhanced while the overall spectral weight keeps constant. It means the spectral weight at low frequency is transferred from low to high frequency area. Such a pseudogap-like behavior has been widely attributed to the Hund’s rule coupling effect, which can localize and polarize the itinerant electrons to enhance the electron correlation and AFM exchange interaction Wang et al. (2012). At low temperature (), we observed an additional enhancement of the high-frequency spectral weight, combined with the result of fitting analysis, we find that the suppressed spectral weight at low frequency area (500-2 000) in the magnetic ordered state has been moved to the high frequency area, reflecting a sudden enhanced localization effect. Further research is needed to determine whether this effect is caused by Hund’s rule coupling or some other effects.
Even though the spectral weight at low frequency area is greatly transferred to high frequency area during the phase transition, we do not observe any additional gap-like feature in the optical conductivity (Fig. 2(b)) after the AFM phase transition (evidence given by spectral analysis is shown in Appendix B). This is different from what happened in BaFe2As2, which undergoes an SDW transition and has a signature of opening a gap in its optical spectrum Hu et al. (2008). Comparing their Fermi surface, we note that, BaFe2As2 as a compensate metal has equal sized electron and hole pockets, and there is a good nesting between them along the () direction in the Brillouin zone Richard et al. (2011, 2010). This will lead to the instability of the Fermi surface and SDW transition at low temperature Hancock et al. (2010). Whereas recent ARPES results on Ca0.73La0.27FeAs2 indicate electron-overdoped FeAs layers Jiang et al. (2016a), in which electron pockets is much bigger than hole pockets and lead to poor nesting condition (comparing with the less doped ones) so as to no SDW transition and no gap on its Fermi surface. The AFM transition in such poorly nested system suggests the magnetism in electron-overdoped Ca0.77Nd0.23FeAs2 does not rely on the topology of the Fermi surface. The spectral weight transfer without a SDW gap creates a pseudogap feature in the optical spectrum across the AFM phase transition.
Such strong magnetism in electron-overdoped Ca1-xRExFeAs2 cannot be understood by previous theoretical model Dai et al. (2012); Ikeda et al. (2010), in which the electron doping could continuously suppress the magnetic order and low energy spin fluctuation with worsening nesting condition. Moreover, recent NMR results point out that magnetism is rather enhanced with doping Kawasaki et al. (2015), such behavior cannot be understood in terms of the Fermi surface nesting. Thus, the mechanism for the magnetism in overdoped area should be reconsidered.
Very recently, the XRD experiments Jiang et al. (2016a) on Ca1-xLaxFeAs2 found that the height of As atom (in FeAs layer) corresponding to Fe layer in electron-overdoped sample () is 1.422(5) Å, while it is 1.412(5) Å for the less doped one () Katayama et al. (2013), indicating the rare earth doping could somehow increase the pnictogen height in Ca1-xLaxFeAs2. Such behavior could enlarge the distance between Fe and As atoms and suppress the hybridization between Fe 3d and As 4p orbitals Diehl et al. (2014). As a result, electrons on Fe atoms could be much more localized and the electron correlation as well as the local magnetic moment are enhanced Zhang et al. (2014); Diehl et al. (2014). Furthermore, across the AFM phase transition in Ca0.73La0.27FeAs2, the lattice parameters a,b,c as well as the cell volume are found to be enlarged abruptly, such negative thermal expansion could narrow the bandwidth and localize the electrons, which is consistent with our observations in optical spectroscopy, thus we propose that the magnetic transition is mostly like to have a localized origin. Even though an enhanced localization effect accompany with the phase transition, the system is still in a metallic state. From the fitting analysis of the optical data in Fig. 3(a)(b), we note that the AFM transition mainly affects the broad Drude item, while the narrow one is almost unaffected. This may reflect the multiband nature of FeSCs Si et al. (2009); de Medici et al. (2009), from which the much incoherent bands (or orbitals) are selected to be localized across the phase transition Neupane et al. (2009).
In summary, we have synthesized the single crystal of Ca0.77Nd0.23FeAs2 and investigated its optical response at temperatures before and after the phase transition. From the optical conductivity, we find obvious spectral weight transfer from low to high energy area without any signature of SDW gap across the AFM phase transition. Therefore, we propose the magnetism in electron-overdoped Ca1-xRExFeAs2 may come from the localization effect, which results in a pseudogap feature, and do not rely on the Fermi surface nesting. Since further electron doping by Co in Ca0.73La0.27Fe1-xCoxAs2 could induce another superconducting dome Jiang et al. (2015), more investigation on this system may shed new lights on the mechanism of high- superconductivity in FeSCs.
Acknowledgements.
We thank Kui Jin, Shiliang Li, Congcong Le and Xianxin Wu for useful discussion. This work was supported by the NSFC (Grants No. 91121004 and 973 Projects No. 2015CB921303) and the MSTC (973 Projects No. 2011CBA00107, No. 2012CB821400, No. 2012CB921302, and No. 2009CB929102).Appendix A Hall coefficient
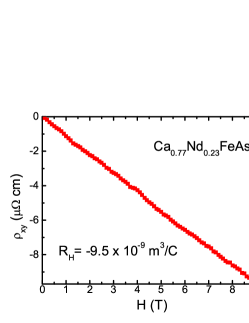
To determine the electron concentration of Ca0.77Nd0.23FeAs2 we measured its Hall resistance and calculated the Hall coefficient at 300 K. The Hall coefficient of Ca0.77Nd0.23FeAs2at 300 K is , which is comparable with that of Ca0.73La0.27FeAs2 Jiang et al. (2016b), indicating that the Ca0.77Nd0.23FeAs2 is electron-overdoped.
Appendix B Detail spectral weight analysis
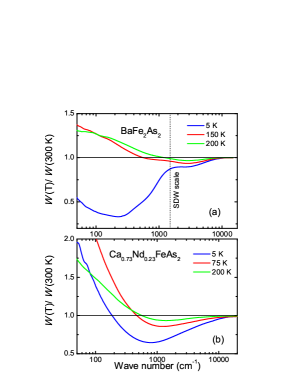
In Fig. 6 we calculated the ratio of the spectral weight as a function of cutoff frequency for BaFe2As2 and Ca0.77Nd0.23FeAs2 respectively. Comparing with BaFe2As2, we find no obvious signature characteristic of opening a gap within the SDW scale of BaFe2As2 but an enhanced spectral weight transfer from low to high energy area (Fig. 4(a)(b)), such behavior might be regarded as a pseudogap behavior.
References
- Lee et al. (2006) P. A. Lee, N. Nagaosa, and X.-G. Wen, Reviews of Modern Physics 78, 17 (2006).
- Richard et al. (2010) P. Richard, K. Nakayama, T. Sato, M. Neupane, Y.-M. Xu, J. H. Bowen, G. F. Chen, J. L. Luo, N. L. Wang, X. Dai, Z. Fang, H. Ding, and T. Takahashi, Phys. Rev. Lett. 104, 137001 (2010).
- Yildirim (2008) T. Yildirim, Phys. Rev. Lett. 101, 057010 (2008).
- Chen et al. (2014) X. Chen, P. Dai, D. Feng, T. Xiang, and F.-C. Zhang, National Science Review 1, 371 (2014).
- Mazin et al. (2008) I. I. Mazin, D. J. Singh, M. D. Johannes, and M. H. Du, Phys. Rev. Lett. 101, 057003 (2008).
- Yin et al. (2011) Z. P. Yin, K. Haule, and G. Kotliar, Nature Materials 10, 932 (2011).
- Li et al. (2009) S. Li, C. de la Cruz, Q. Huang, Y. Chen, J. W. Lynn, J. Hu, Y.-L. Huang, F.-C. Hsu, K.-W. Yeh, M.-K. Wu, and P. Dai, Phys. Rev. B 79, 054503 (2009).
- Mou et al. (2011) D.-x. Mou, L. Zhao, and X.-j. Zhou, Frontiers of Physics 6, 410 (2011).
- Zhao et al. (2016) L. Zhao, A. Liang, D. Yuan, Y. Hu, D. Liu, J. Huang, S. He, B. Shen, Y. Xu, X. Liu, L. Yu, G. Liu, H. Zhou, Y. Huang, X. Dong, F. Zhou, K. Liu, Z. Lu, Z. Zhao, C. Chen, Z. Xu, and X. J. Zhou, Nature Communications 7, 10608 (2016).
- Hiraishi et al. (2014) M. Hiraishi, S. Iimura, K. M. Kojima, J. Yamaura, H. Hiraka, K. Ikeda, P. Miao, Y. Ishikawa, S. Torii, M. Miyazaki, I. Yamauchi, A. Koda, K. Ishii, M. Yoshida, J. Mizuki, R. Kadono, R. Kumai, T. Kamiyama, T. Otomo, Y. Murakami, S. Matsuishi, and H. Hosono, Nat. Phys. 10, 300 (2014).
- Iimura et al. (2012) S. Iimura, S. Matuishi, H. Sato, T. Hanna, Y. Muraba, S. W. Kim, J. E. Kim, M. Takata, and H. Hosono, Nature Communications 3, 943 (2012).
- Katayama et al. (2013) N. Katayama, K. Kudo, S. Onari, T. Mizukami, K. Sugawara, Y. Sugiyama, Y. Kitahama, K. Iba, K. Fujimura, N. Nishimoto, M. Nohara, and H. Sawa, J. Phys. Soc. Jpn. 82, 123702 (2013).
- Li et al. (2015) M. Y. Li, Z. T. Liu, W. Zhou, H. F. Yang, D. W. Shen, W. Li, J. Jiang, X. H. Niu, B. P. Xie, Y. Sun, C. C. Fan, Q. Yao, J. S. Liu, Z. X. Shi, and X. M. Xie, Phys. Rev. B 91, 045112 (2015).
- Kawasaki et al. (2015) S. Kawasaki, T. Mabuchi, S. Maeda, T. Adachi, T. Mizukami, K. Kudo, M. Nohara, and G.-q. Zheng, Phys. Rev. B 92, 180508 (2015).
- Jiang et al. (2016a) S. Jiang, C. Liu, H. Cao, T. Birol, J. M. Allred, W. Tian, L. Liu, K. Cho, M. J. Krogstad, J. Ma, K. M. Taddei, M. A. Tanatar, M. Hoesch, R. Prozorov, S. Rosenkranz, Y. J. Uemura, G. Kotliar, and N. Ni, Phys. Rev. B 93, 054522 (2016a).
- Wu et al. (2010) D. Wu, N. Barišić, P. Kallina, A. Faridian, B. Gorshunov, N. Drichko, L. J. Li, X. Lin, G. H. Cao, Z. A. Xu, N. L. Wang, and M. Dressel, Phys. Rev. B 81, 100512 (2010).
- Dai et al. (2015) Y. M. Dai, H. Miao, L. Y. Xing, X. C. Wang, P. S. Wang, H. Xiao, T. Qian, P. Richard, X. G. Qiu, W. Yu, C. Q. Jin, Z. Wang, P. D. Johnson, C. C. Homes, and H. Ding, Phys. Rev. X 5, 031035 (2015).
- Kudo et al. (2014) K. Kudo, Y. Kitahama, K. Fujimura, T. Mizukami, H. Ota, and M. Nohara, J. Phys. Soc. Jpn. 83, 093705 (2014).
- Homes et al. (1993) C. C. Homes, M. Reedyk, D. A. Cradles, and T. Timusk, Applied Optics 32, 2976 (1993).
- Dai et al. (2013) Y. M. Dai, B. Xu, B. Shen, H. Xiao, H. H. Wen, X. G. Qiu, C. C. Homes, and R. P. S. M. Lobo, Physical Review Letters 111, 117001 (2013).
- Analytis et al. (2014) J. G. Analytis, H.-H. Kuo, R. D. McDonald, M. Wartenbe, P. M. C. Rourke, N. E. Hussey, and I. R. Fisher, Nat. Phys. 10, 194 (2014).
- Hu et al. (2008) W. Z. Hu, J. Dong, G. Li, Z. Li, P. Zheng, G. F. Chen, J. L. Luo, and N. L. Wang, Phys. Rev. Lett. 101, 257005 (2008).
- Homes et al. (2015) C. C. Homes, Y. M. Dai, J. S. Wen, Z. J. Xu, and G. D. Gu, Phys. Rev. B 91, 144503 (2015).
- Nakajima et al. (2014a) M. Nakajima, S. Ishida, T. Tanaka, K. Kihou, Y. Tomioka, T. Saito, C.-H. Lee, H. Fukazawa, Y. Kohori, T. Kakeshita, A. Iyo, T. Ito, H. Eisaki, and S.-i. Uchida, J. Phys. Soc. Jpn. 83, 104703 (2014a).
- Nakajima et al. (2014b) M. Nakajima, S. Ishida, T. Tanaka, K. Kihou, Y. Tomioka, T. Saito, C. H. Lee, H. Fukazawa, Y. Kohori, T. Kakeshita, A. Iyo, T. Ito, H. Eisaki, and S. Uchida, Sci. Rep. 4 (2014b), 10.1038/srep05873.
- Wang et al. (2012) N. L. Wang, W. Z. Hu, Z. G. Chen, R. H. Yuan, G. Li, G. F. Chen, and T. Xiang, Journal of Physics: Condensed Matter 24, 294202 (2012).
- Richard et al. (2011) P. Richard, T. Sato, K. Nakayama, T. Takahashi, and H. Ding, Reports on Progress in Physics 74, 124512 (2011).
- Hancock et al. (2010) J. N. Hancock, S. I. Mirzaei, J. Gillett, S. E. Sebastian, J. Teyssier, R. Viennois, E. Giannini, and D. van der Marel, Phys. Rev. B 82, 014523 (2010).
- Dai et al. (2012) P. Dai, J. Hu, and E. Dagotto, Nat. Phys. 8, 709 (2012).
- Ikeda et al. (2010) H. Ikeda, R. Arita, and J. Kuneš, Phys. Rev. B 82, 024508 (2010).
- Diehl et al. (2014) J. Diehl, S. Backes, D. Guterding, H. O. Jeschke, and R. Valentí, Phys. Rev. B 90, 085110 (2014).
- Zhang et al. (2014) C. Zhang, L. W. Harriger, Z. Yin, W. Lv, M. Wang, G. Tan, Y. Song, D. L. Abernathy, W. Tian, T. Egami, K. Haule, G. Kotliar, and P. Dai, Physical Review Letters 112, 217202 (2014).
- Si et al. (2009) Q. Si, E. Abrahams, J. Dai, and J.-X. Zhu, New J. Phys. 11, 045001 (2009).
- de Medici et al. (2009) L. de Medici, S. R. Hassan, M. Capone, and X. Dai, Phys. Revs Lett. 102, 126401 (2009).
- Neupane et al. (2009) M. Neupane, P. Richard, Z.-H. Pan, Y.-M. Xu, R. Jin, D. Mandrus, X. Dai, Z. Fang, Z. Wang, and H. Ding, Phys. Revs Lett. 103, 097001 (2009).
- Jiang et al. (2015) S. Jiang, C. Liu, H. Cao, T. Birol, J. M. Allred, W. Tian, L. Liu, K. Cho, M. J. Krogstad, J. Ma, K. M. Taddei, M. A. Tanatar, M. Hoesch, R. Prozorov, S. Rosenkranz, Y. J. Uemura, G. Kotliar, and N. Ni, (2015), arXiv:1505.05881 .
- Jiang et al. (2016b) S. Jiang, L. Liu, M. Schutt, A. M. Hallas, B. Shen, W. Tian, E. Emmanouilidou, A. Shi, G. M. Luke, Y. J. Uemura, R. M. Fernandes, and N. Ni, (2016b), arXiv:1603.04899 .