A Hard X-ray Study of the Normal Star-Forming Galaxy M83 with NuSTAR
Abstract
We present results from sensitive, multi-epoch NuSTAR observations of the late-type star-forming galaxy M83 ( Mpc), which is the first investigation to spatially resolve the hard ( keV) X-ray emission of this galaxy. The nuclear region and off-nuclear point sources, including a previously discovered ultraluminous X-ray (ULX) source, are detected in our NuSTAR observations. The X-ray hardnesses and luminosities of the majority of the point sources are consistent with hard X-ray sources resolved in the starburst galaxy NGC 253. We infer that the hard X-ray emission is most likely dominated by intermediate accretion state black hole binaries and neutron star low-mass X-ray binaries (Z-sources). We construct the X-ray binary luminosity function (XLF) in the NuSTAR band for an extragalactic environment for the first time. The M83 XLF has a steeper XLF than the X-ray binary XLF in NGC 253, consistent with previous measurements by Chandra at softer X-ray energies. The NuSTAR integrated galaxy spectrum of M83 drops quickly above 10 keV, which is also seen in the starburst galaxies NGC 253, NGC 3310 and NGC 3256. The NuSTAR observations constrain any AGN to be either highly obscured or to have an extremely low luminosity of 1038 erg s-1 (10–30 keV), implying it is emitting at a very low Eddington ratio. An X-ray point source consistent with the location of the nuclear star cluster with an X-ray luminosity of a few times 1038 erg s-1 may be a low-luminosity AGN but is more consistent with being an X-ray binary.
Subject headings:
galaxies: individual (M83) — galaxies: star formation — galaxies: starburst — X-rays: galaxies| NuSTAR | XMM-Newton/Chandra | ||||||
|---|---|---|---|---|---|---|---|
| Net | Net | ||||||
| Date | ObsID | Exposure | Observatory | Date | ObsID | Exposure | |
| (ks) | (ks) | ||||||
| Epoch 1 | |||||||
| Aug 7, 2013 | 50002043002 | 42 | XMM-Newton | Aug 7, 2013 | 0723450101 | 41 | |
| Aug 9, 2013 | 50002043004 | 80 | |||||
| Aug 21, 2013 | 50002043006 | 43 | |||||
| Epoch 2 | |||||||
| Jan 19, 2014 | 50002043008 | 81 | XMM-Newton | Jan 11, 2014 | 0723450201 | 20 | |
| Epoch 3 | |||||||
| Jun 4, 2014 | 50002043010 | 70 | |||||
| Jun 7, 2014 | 50002043012 | 110 | Chandra | Jun 7, 2014 | 16024 | 30 | |
I. Introduction
The NuSTAR observatory, the first focusing hard X-ray (10 keV) telescope in orbit (Harrison et al., 2013), is capable of spatially resolving the components of nearby ( 5 Mpc) star-forming galaxies in this energy range for the first time. Hard X-ray emission in star-forming galaxies lacking an AGN originates primarily from X-ray binaries, mainly high-mass X-ray binaries (HMXB) and ultraluminous X-ray sources (ULXs). There are other contributions, chiefly low-mass X-ray binaries (LMXBs), but also possibly accretion onto a supermassive black hole (SMBH) and perhaps diffuse non-thermal inverse Compton (IC) emission (Lehmer et al., 2013; Wik et al., 2014b; Ptak et al., 2015; Lehmer et al., 2015). However, the IC component results from the interaction of cosmic rays with IR and microwave background photons, and is likely to be negligible at moderately hard X-ray energies (e.g., see Wik et al. 2014b for the case of NGC 253).
We are conducting a NuSTAR starburst galaxy survey to investigate the hard X-ray properties of a sample of six nearby galaxies (NGC 253, Arp 299, M83, M82, NGC 3310, and NGC 3256), spanning star formation rates (SFRs) of 1 – 100 yr-1. We are characterizing the 0.5–30 keV spectral energy distribution (SED) of these galaxies (Lehmer et al., 2015; Ptak et al., 2015), which is of great cosmological importance. For example, this SED is used to do important k-corrections for high-z galaxies observed in the deepest Chandra X-ray surveys (Lehmer et al., 2016). For the closest galaxies ( Mpc; NGC 253, M82, and M83), the very deep NuSTAR exposures allows us for detailed studies of the spatially-resolved point source population.
The in-depth studies of starburst galaxy NGC 253 (Lehmer et al., 2013; Wik et al., 2014b) with NuSTAR and Chandra showed the utility of coordinated observations with these two facilities and hard X-ray color-color and color-intensity diagnostics to determine the states of X-ray binaries in external galaxies. In NGC 253, the majority of the luminous X-ray binaries were found to have properties consistent with (stellar-mass) black hole candidates in the intermediate state, an important measurement of the state of the population of X-ray binaries in a star-forming environment. We now seek to answer the question of whether or not the preponderance of black holes in intermediate states is ubiquitous among star-forming galaxies as well as to further investigate other populations, such as neutron star (NS) LMXBs, that might have similar colors.
It also appears that star-forming galaxies are dominated by ULXs and have overall spectra with steep turnovers at keV (e.g., NGC 253; Wik et al. 2014b; NGC 3310 and NGC 3256; Lehmer et al. 2015). This hard energy turn over around 6–10 keV is also seen for bright individual ULXs studied by XMM-Newton and NuSTAR (Stobbart et al., 2006; Gladstone et al., 2009; Walton et al., 2013; Bachetti et al., 2013; Rana et al., 2014; Walton et al., 2014) and is interpreted as super-Eddington accretion onto a stellar mass black hole instead of an intermediate mass black hole in a low/hard accretion state (e.g., Shakura & Sunyaev, 1973; King et al., 2001; Poutanen et al., 2007; Gladstone et al., 2009; Sutton et al., 2013).
Detailed investigation of the spectra of ULXs and other components contributing to the total galaxy spectrum requires observing very nearby galaxies. Even for galaxies only 10 Mpc away, X-ray binaries can be unresolved by NuSTAR’s 58′′ half-power diameter point spread function (PSF).
Therefore, we obtained a deep NuSTAR observation of the nearby star-forming galaxy, M83, a face-on late-type (SABc) spiral galaxy. Its proximity (=4.610.20 Mpc; Saha et al., 2006) and large optical angular extent (111The galaxy’s size is defined by the -band surface brightness level of 25 mag arcsec2=12.9′11.5′, 1715 kpc), make it suitable for a point source population study. We are able to achieve high efficiency in detecting point sources as compared to the edge-on galaxy NGC 253, whose resolved sources, owing to a more compact overall distribution, are more spatially blended with each other.
M83 has been studied over a variety of wavelengths quite intensively, including the X-ray band. Chandra has observed it for ks, identifying 398 point sources (Long et al., 2014, hereafter L14), including X-ray binaries down to erg s-1 in the 0.35–8.0 keV band. Notably, L14 found the observed X-ray binary luminosity function (LF) does not match with the predicted LF scaled from M83’s SFR and stellar mass. The observed LF suggests that the substantial LMXB population dominates over the HMXBs associated with the current on-going star-forming activity (i.e., Boissier et al., 2005). Ducci et al. (2013) investigated a number of bright point sources with XMM-Newton and found an overall X-ray binary LF consistent with the Chandra measurements. There are a couple of bright, individual sources in M83 that are also notable. Soria et al. (2012) discovered a ULX about 1′ to the east of the nucleus, that is likely to have a red giant counterpart. There is another ULX candidate at the location of the edge of the stellar disk reported by Immler et al. (1999) and Stobbart et al. (2006).
So far, no AGN activity has been reported in M83. However, there is an X-ray point source identified in the Chandra observations as luminous as a few times 1038 erg s-1, at the location of a nuclear star cluster (Soria & Wu, 2003; Long et al., 2014). This source is a good candidate for the center of the galaxy and a low luminosity AGN, but the authors also suggest the possibility that it is an X-ray binary.
The aims of this paper are to identify the point sources detected by NuSTAR at hard energies (4–25 keV), examine the point source population by investigating luminosities and spectral colors, characterize the broadband SED, and constrain the nuclear activity in M83. We assume the distance to M83 is 4.61 Mpc, for which 1′′ corresponds to 22 pc. Unless noted otherwise, quoted uncertainties correspond to 90% confidence intervals for one interesting parameter.
II. Data and Data Reduction
II.1. NuSTAR Data
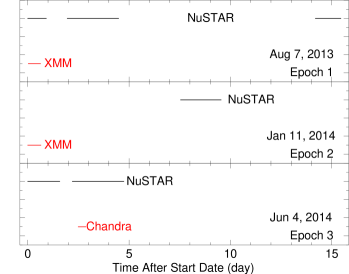
NuSTAR observed M83 in 2013 and 2014 over three epochs as part of the NuSTAR Starburst Galaxy Survey. The three NuSTAR epochs were simultaneous or nearly simultaneous with either XMM-Newton or Chandra observations, which constrain the lower energy ( keV) emission as well as identify sources potentially confused with NuSTAR’s larger beam. We show these observational intervals graphically in Figure 1 and give the observation log in Table 1.
We reduced the NuSTAR data using HEASOFT 6.15 and CALDB v. 20131223. Specifically, we processed the data using the nupipeline script, which creates calibrated and screened level 2 event lists from level 1 data. The resultant sum of the good time intervals (GTIs) is also listed in Table 1.
The optical extent of M83 (12.9′11.5′) is comparable to the field-of-view (FoV; Figure 2) of NuSTAR (13′ 13′); however, the center of the galaxy was placed a few arcminutes offset from the center of the FoV. This placement results in partial covering of M83 in each observation. Since the NuSTAR observations were taken with different roll angles, over the course of the three observations the entire region is covered after merging the data (see Figure 2).
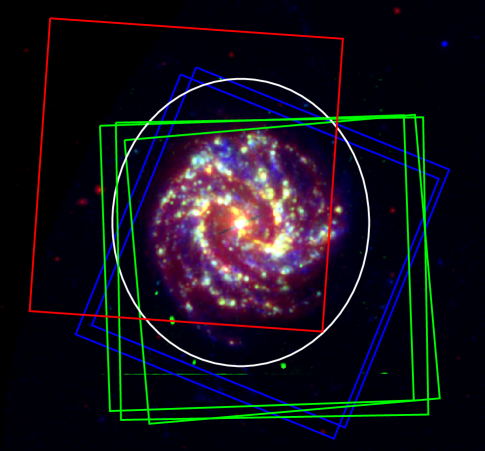
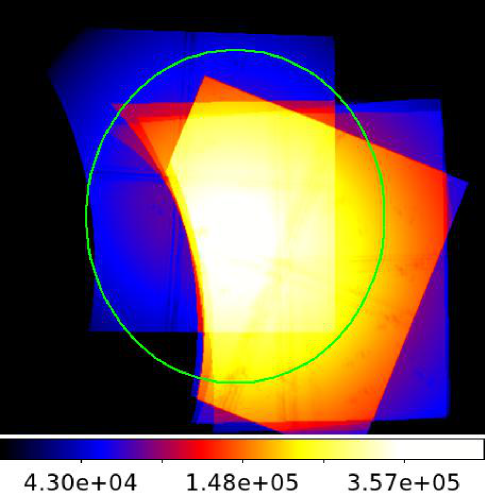
We note that there are two bright objects, the Shapley supercluster and IC 4329A, located within a 1 – 5 degree annulus centered on M83, which thus result in stray light (unfocused X-rays entering between the optics module and aperture stops) on the NuSTAR detectors. Unfortunately, the stray light pattern is apparent in all observations. However, stray light can be estimated using the location of those bright sources and the observed roll angle. We used the nustar_stray_light222https://github.com/bwgref/nustar_stray_light procedure to estimate the affected regions on each detector for each observation. IC 4239A contaminated the small region to the east of M83 in both the FPMA and FPMB data. The Shapley supercluster only appeared on one of either FPMA or FPMB (i.e., one of the telescopes), but the stray light is extended over a larger area. The contamination from both IC 4329A and the Shapley supercluster covered more than half the total area of either the FPMA or FPMB detector. We discarded the data which suffered from the Shapley supercluster stray light. Specifically, we only utilize FPMA for the Jan 2014 observation and FPMB for the remaining five observations. We also eliminated the region affected by IC 4239A in these data. This resulted in missing partially the southeast region of in our analysis. In Figure 3, we show the co-added NuSTAR exposure map after removing the contaminated areas, which presents the area coverage with effective exposures of our M83 observations.
II.2. Simultaneous XMM-Newton and Chandra Observations
XMM-Newton observations took place on Aug 8, 2013 (epoch 1) and Jan 11, 2014 (epoch 2) as part of an AO 12 GO program to monitor the newly discovered ULX, CXO 133705-295207 (P.I. Kuntz). The detailed XMM-Newton analysis of the ULX is presented in Soria et al. (2015). Our primary use of the XMM-Newton data is to locate bright point sources and to characterize the 0.5–8.0 keV spectral shape of the galaxy and bright sources. Because the XMM-Newton PN detector alone achieves a 4–10 keV sensitivity similar to our NuSTAR 4–10 keV sensitivity, we utilized the PN data only to avoid complication of data analysis between the different XMM-Newton detectors. The choice of the PN detector over MOS was motivated by the better S/N and larger FoV (i.e., due to the loss of two CCD chips of MOS 1). The XMM-Newton data were reduced using SAS v.13.0.0. The level 1 data were reprocessed using the SAS scripts, epchain, and then pn-filter is applied to eliminate high background periods. The resulting exposures are tabulated in Table 1.
Chandra observed M83 on June 2, 2014 (epoch 3) using the Advanced CCD Imaging Spectrometer (ACIS), as a part of the Chandra campaign of the NuSTAR starburst galaxy survey (P.I. Hornschemeier). To capture the entire , we used the ACIS-I array, which has a wide FoV (16′ 16′) that complements well the NuSTAR FoV. The Chandra data reduction and analysis were performed with CIAO version 4.6 and CALDB 4.6.3. Chandra data were reprocessed using the CIAO tool chandra_repro, which applies time-dependent gain and charge transfer inefficiency (CTI) corrections and removes bad pixels and bad grade events. We removed high background periods applying the sigma-clipping method. Namely, we used the CIAO deflare script, rejecting the intervals that exceeded 3 above the mean. The final net exposure was 29.6 ks of the original 30 ks observation. Figure 1 illustrates the relative NuSTAR, XMM-Newton, and Chandra coverages for each epoch.
Both the XMM-Newton and Chandra observations were spatially registered to the Chandra point source catalog of L14.
III. Spatial Analysis
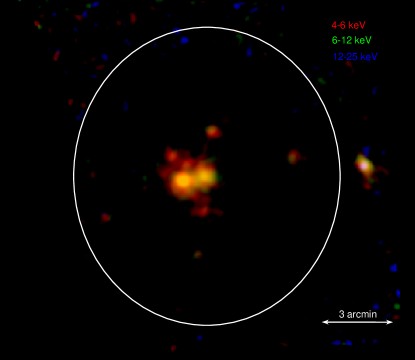
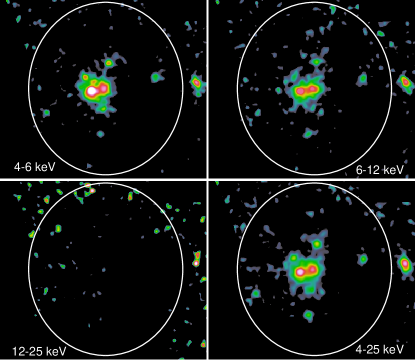
The NuSTAR M83 observations spatially resolve multiple point-like X-ray sources including the known ULX source (see Figure 4). To maximize the S/N, we co-added observations from all three epochs, resulting in an effective exposure of 370 ks in the central region of M83 (see Figure 3). The first and third epoch observations were aligned using the position of CXO 133705295207 (x299 in L14) which was obtained by fitting a circular Gaussian to 410 keV images of the ULX. In general using multiple point sources for alignment is preferred, but the S/N of the majority of the point sources for each observation was low. Nevertheless, since x299 was not bright in the second epoch observation, we used other bright sources to align the data to the remaining observations. All the aligned event lists were merged using the FTOOLS ftmerge utility to create a combined, deep exposure event list. The final event list was registered using the position of the ULX to the published Chandra coordinates of x299 by L14. In our astrometric solution, we assume no rotation since there is not a sufficient number of sources to constrain it.
The left panel of Figure 4 shows the NuSTAR false color image of M83 for the merged data. The individual 4–6, 6–12, 12–25, and 4–25 keV images are displayed in the right panel of Figure 4. All the images are exposure-corrected, background-subtracted and smoothed. The 4–6, 6–12, and 4–25 keV images clearly show that a number of point sources are resolved within the optical extent of M83. These resolved sources are not obviously seen in the 12–25 keV band image. In the next subsection, we identify the resolved point sources and measure their fluxes in the NuSTAR images.
III.1. Point Source Identification
NuSTAR fluxes for point sources were obtained via point spread function (PSF) fitting as opposed to aperture photometry, because some sources contain flux from broad PSF wings underneath them. We used Sherpa (included as a part of CIAO) for spatial fitting of the NuSTAR images. In this section, we describe the method to identify and measure the NuSTAR fluxes of 21 resolved point sources. The outline procedure is to (1) create the XMM-Newton/Chandra point source catalog, (2) measure NuSTAR fluxes based on the XMM-Newton/Chandra source positions, and (3) reject faint sources whose fluxes are below 90% confidence levels.
III.1.1 NuSTAR Background Modeling
For photometry, the NuSTAR background must also be taken into account. The NuSTAR background consists of the focused cosmic X-ray background, stray light from the cosmic X-ray background (referred as the aperture background), instrument background, and reflected solar X-rays (Wik et al., 2014a). The spatial variations of the background surface brightness are significant, therefore we use the nuskybgd script (Wik et al., 2014a) to create model background images for each observation. The nuskybgd script characterizes the spectral and spatial parameters of the observed background in the source-free region of the observations and then extrapolates across the FoV (see Wik et al., 2014a, for details). In Sherpa, the simulated background images are fitted to a 2D polynomial function to analytically determine the spatial distribution of the background model. We also note that an on-axis PSF model (An et al., 2014; Madsen et al., 2015) is applied even to off-axis sources. This approach may therefore introduce systematic uncertainties due to possibly oversimplified background and PSF models.
| L14-NuSTARb | Effective | Count Rates | ||||||
|---|---|---|---|---|---|---|---|---|
| R.A.a | Dec.a | Offset | Exp | IDc | (4–6 keV) | (6–12 keV) | (12–25 keV) | (4–25 keV) |
| (J2000) | (arcsec) | (ks) | L14 | (10-3 ct s-1) | ||||
| 13:37:04 | 29:49:27 | 3.1 | 322.1 | x281 | ||||
| 13:36:43 | 29:51:01 | 6.3 | 221.1 | x029 | ||||
| 13:36:49 | 29:52:30 | 0.3 | 309.9 | x048 | ||||
| 13:36:52 | 29:53:34 | 0.5 | 305.2 | x073 | ||||
| 13:36:57 | 29:49:11 | 1.3 | 318.2 | x145 | ||||
| 13:36:57 | 29:50:58 | 6.7 | 361.5 | x165 | ||||
| 13:36:57 | 29:53:38 | 1.8 | 345.1 | x152 | ||||
| 13:36:58 | 29:47:25 | 3.9 | 255.1 | x155 | ||||
| 13:36:59 | 29:50:01 | 1.5 | 342.9 | x185 | ||||
| 13:37:00 | 29:52:02 | 3.3 | 349.8 | x193 | ||||
| 13:37:01 | 29:47:46 | 3.1 | 264.0 | x252 | ||||
| 13:37:01 | 29:51:31 | 10.9 | 305.2 | x246 | ||||
| 13:37:01 | 29:51:56 | 0.3 | 343.9 | x233 | ||||
| 13:37:01 | 29:53:25 | 2.0 | 349.3 | x248 | ||||
| 13:37:02 | 29:55:19 | 1.5 | 292.3 | x258 | ||||
| 13:37:04 | 29:51:19 | 2.7 | 335.7 | x286 | ||||
| 13:37:05 | 29:52:07 | 0.0∗ | 353.0 | x299 | ||||
| 13:37:05 | 29:53:59 | 4.8 | 345.5 | x284 | ||||
| 13:37:07 | 29:51:01 | 0.5 | 346.2 | x321 | ||||
| 13:37:13 | 29:52:01 | 6.2 | 56.5 | x366 | ||||
| 13:37:20 | 29:53:43 | 6.1 | 49.7 | x403 | ||||
| Epoch 1 | Epoch 2 | Epoch 3 | ||||||||||||
|---|---|---|---|---|---|---|---|---|---|---|---|---|---|---|
| IDa | Count Rates | Count Rates | Count Rates | |||||||||||
| L14 | (4–6 keV) | (6–12 keV) | (12–25 keV) | (4–25 keV) | (4–6 keV) | (6–12 keV) | (12–25 keV) | (4–25 keV) | (4–6 keV) | (6–12 keV) | (12–25 keV) | (4–25 keV) | ||
| x281 | ||||||||||||||
| x029 | ||||||||||||||
| x048 | ||||||||||||||
| x073 | ||||||||||||||
| x145 | ||||||||||||||
| x165 | ||||||||||||||
| x152 | ||||||||||||||
| x155 | ||||||||||||||
| x185 | ||||||||||||||
| x193 | ||||||||||||||
| x252 | ||||||||||||||
| x246 | ||||||||||||||
| x233 | ||||||||||||||
| x248 | ||||||||||||||
| x258 | ||||||||||||||
| x286 | ||||||||||||||
| x299 | ||||||||||||||
| x284 | ||||||||||||||
| x321 | ||||||||||||||
| x366 | ||||||||||||||
| x403 | ||||||||||||||
To estimate systematic errors, we simulate a background image by adding Poisson noise onto a nuskybgd background model image and then added simulated point sources at arbitrary locations. We compared the input and measured simulated point source fluxes and concluded that using an analytic background model and an on-axis PSF model introduces 10% systematic uncertainties for sources within 5′ from the optical-axis. All of our point sources are detected within 5′ from the optical axis, and statistical errors are typically much larger than 10%. Therefore, the systematic error is negligible.
We also validate our method by comparing it to the tool developed by Wik et al. (2014b), which uses both the simulated background images and customized PSF models for individual sources. We applied the Wik et al. (2014b) method to one of our three epochs and confirmed that flux measurements done by both methods agree with each other within 90% confidence.
III.1.2 Determining the NuSTAR Point Source List
Since our NuSTAR observations are taken simultaneously or nearly-simultaneously with either XMM-Newton or Chandra, candidate point source detection is performed using these higher spatial resolution images to mitigate source confusion. We point out that the Chandra and XMM-Newton exposure times were sufficiently long to ensure that the Chandra and XMM-Newton observation sensitivities in the 4–8 keV band exceed the sensitivity of our NuSTAR observations in the same band. We ran the SAS source detection tool detect_chain with 16 spline nodes and an upper limit likelihood of 15 on the XMM-Newton PN images in the 4–10 keV band, chosen to maximize the energy range which overlaps with NuSTAR. For the Chandra data, we ran wavdetect with scale parameters of 1.0, 1.4, 2.0, 2.25, 4.0, and 5.56 on the 4–8 keV image, since the Chandra effective area drops off rapidly above 7 keV. Then, we merged the three point source lists from each epoch to create a master point source catalog.
We note that the nuclear region is detected as one source in the XMM-Newton observations, whereas it is clearly resolved into at least seven sources in the Chandra 4–8 keV image. Our final Chandra/XMM-Newton source list contains 39 sources, 38 of which were reported in L14. One source that was not included in L14 is located outside of the FoV of their Chandra observations.
We characterized the NuSTAR point sources that were detected at or above the 90% confidence level in the co-added NuSTAR 4–10 keV image via PSF-fitting. In our PSF-fitting procedure, NuSTAR point sources were modeled with 2D Gaussians with widths of 5′′; these Gaussians were convolved with the PSFs to model the sources. We chose to use a 2D Gaussian instead of a delta function to take into account the uncertainties in the PSF shape. We note that the model background parameters constrained from the nuskybgd images were fixed during the fitting.
Using the XMM-Newton/Chandra point source position in the master catalog, we initially fit the brightest point source to the NuSTAR 4–10 keV image. The source positions were derived parameters, so offsets, distortions, and rotations of the images were allowed to fit. Once we obtained the best-fit parameters for a source, we added the next brightest source in the XMM-Newton/Chandra catalog to the model and continued thereafter source by source, moving down in count rate. When the resulting source flux was negative and/or the best-fit position was more than 12′′ (5 pixel) away from the original point source position in the master catalog, the source was considered to be undetected. We also discarded sources whose fluxes were not significant at the 90% confidence level. Having identified which Chandra or XMM-Newton point sources are detected significantly in the 4–10 keV NuSTAR image, we used their positions (fixed during the PSF fitting) to measure their 4–6, 6–12, 12–25, and 4–25 keV fluxes while fixing the source positions during PSF-fitting. We note that in our method we should be able to identify and to measure sources with fluxes above 2.310-4 ct s-1, 0.8010-4 ct s-1, 1.110-4 ct s-1, 1.110-4 ct s-1and 1.510-4 ct s-1 in the 4–10, 4–6, 6–12, 12–25, and 4–25 keV, respectively for a 350 ks exposure. However, these values may fluctuate depending on source positions due to background variations and neighboring sources.
We point out that we may have missed very obscured sources that do not appear in the XMM-Newton and/or Chandra images. However, we note that no very bright sources appeared in the NuSTAR 12–25 keV image that were not also detected in the Chandra/XMM-Newton observations (see Figure 6).
There were a total of 21 NuSTAR sources with flux measurements. The results are listed in Table 2 along with the source ID of L14. We also calculate and list position differences between the NuSTAR and Chandra L14 positions. We note that some of the offsets listed in the table are large (6′′-10′′). This may be due to rotation and PSF uncertainties that could not completely be taken into account by using a 2D Gaussian model. We have compared the NuSTAR 4–10 keV images with the concurrent XMM-Newton and Chandra images in the same band. It would be less likely that sources detected in the XMM-Newton or Chandra images decreased in flux in the NuSTAR observations at the same energy band and different XMM-Newton/Chandra undetected sources increased in flux to be above the detection threshold within a few arcseconds. However, we cannot exclude the possibility that a measured NuSTAR flux may not be truly associated with the identified Chandra or XMM-Newton source.
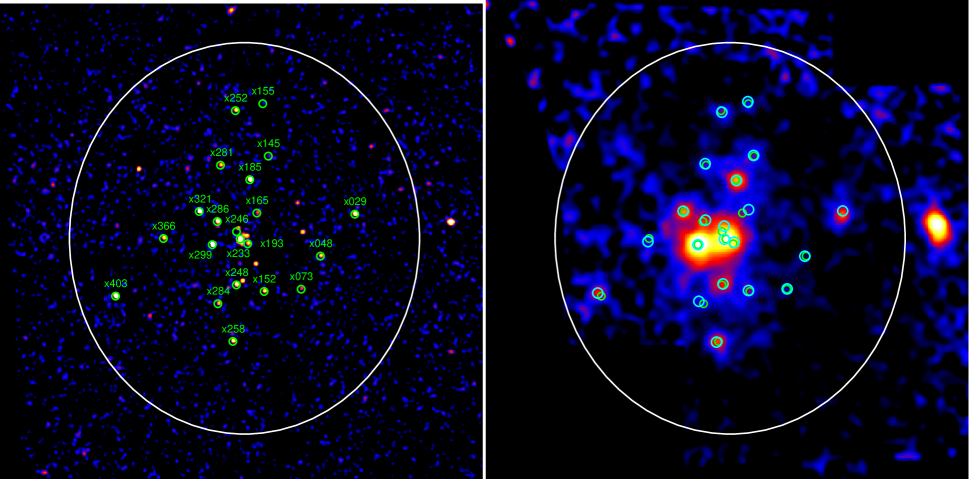
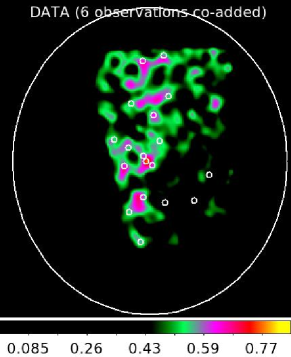
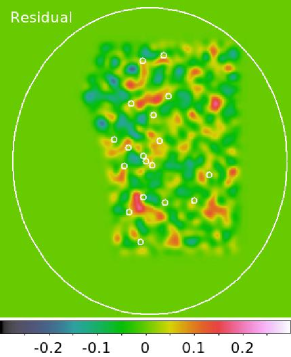
Figure 5 illustrates the location of the NuSTAR detected point sources with Chandra source IDs (from L14). Overall, about half of the Chandra/XMM-Newton sources were detected in the NuSTAR observations, while often sources were not detected due to source confusion. For example, two NuSTAR sources are identified in the nuclear region with our PSF-fitting approach, whereas Chandra clearly resolved the region into seven point sources (see Figure 8). Similarly, there are several sources detected in the XMM-Newton and Chandra images near source x248 that are detected as a single source by NuSTAR.
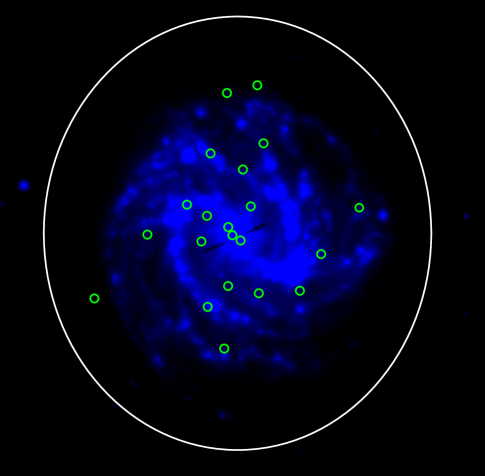
Figure 7 shows the correlation between the active star-forming regions and the location of the NuSTAR point sources. About 25% of the sources are located in intense star-forming regions; however, there is no strong relation between the X-ray source locations and the spiral arms.
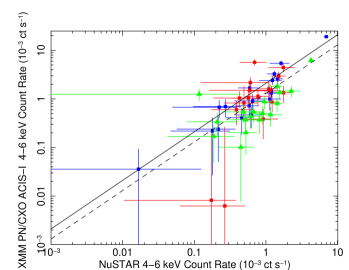
Instead of using simply the net exposure, the source count rates were obtained using the “effective exposures”, listed in Table 2, which include corrections based on effective area at the detector locations, vignetting, and removal of detector area affected by stray light. To study the long-term X-ray variability in the 4–25 keV band probed by NuSTAR (see Section III.3), we also measured the NuSTAR fluxes at each epoch. The measured fluxes are listed in Table 3. To validate our NuSTAR flux measurements, we compared the measured NuSTAR count rates to the Chandra/XMM-Newton count rates in the 4–6 keV energy band for the same sources (see Figure 9) and found reasonable agreement.
III.2. NuSTAR Color Diagnostics for Compact Binaries
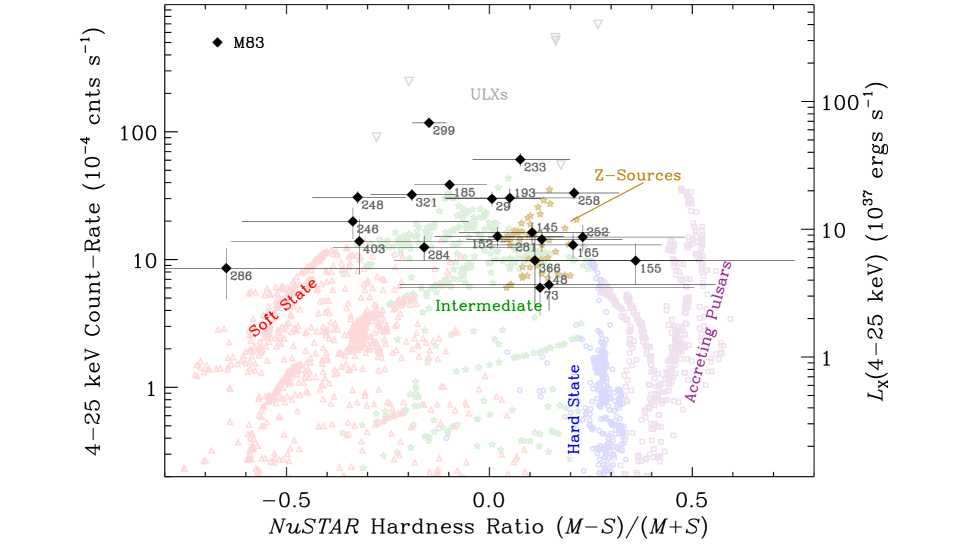
Differentiating BH binaries from NS LMXBs can be done by investigating curvature in their spectra, disk temperature and inner radius as we have shown for the bright M31 sources with very high S/N ratio spectra when extending up to 20 keV (Maccarone et al., 2016). Similarly, as black hole binaries move through different accretion states, their X-ray spectra change dramatically at 10 keV, much more so than at lower energies (e.g., Tananbaum et al., 1972; Done et al., 2007). NuSTAR’s great increase in sensitivity at 10 keV over past missions has provided the opportunity to constrain the nature of the resolved sources and to investigate accretion states of black hole binary populations in nearby galaxies for the first time (see also the NGC 253 study of Wik et al. 2014b). The color-intensity and color-color diagrams are powerful tools for diagnose point sources which are too faint for spectral analysis. In this section, we construct NuSTAR color-intensity and color-color diagrams to examine both the identities and accretion states of the X-ray point sources in M83.
Similar to Wik et al. (2014b), we compute the hardness ratios of the point sources using the NuSTAR count rates we obtained in the previous subsection. The hardness ratios are defined as follows: The NuSTAR hard color is (H–M)/(H+M), where H is the hard band (12–25 keV) count rate, and M is the medium band count rate (6–12 keV). The NuSTAR soft color is (M–S)/(M+S), where S is the soft band (4–6 keV). These colors and intensities can be compared with well-studied Galactic BH binaries in different accretion states. Using high S/N hard X-ray spectra of Galactic BH binaries from RXTE observations, NuSTAR colors and intensities were calculated for seven Galactic BH binaries, over the full range of accretion states, using the NuSTAR response. Intensities were computed assuming a distance of 4 Mpc. Similarly, a sample of 8 pulsar binaries were included in the same fashion (see A. Zezas et al., in prep for more details).
The simulated colors and intensities for the Galactic BH binaries are shown for different accretion states. Different color symbols indicate different BH accretion states in Figures 10 and 11. Specifically, soft, intermediate, and hard accretion states correspond to red, green, and blue points, respectively. Galactic accreting pulsars are plotted with magenta open squares. We also plot Galactic NS LMXBs using spectral fits from Church et al. (2012). Although high S/N ratio spectra analysis distinguish BH binaries from NS, NS LMXBs possess similar NuSTAR colors and intensities to the Galactic BH binaries in our color diagnostic diagrams. The NS LMXBs in the plots are all ”Z-sources”; another subgroup of NS LMXBs, atoll sources, are relatively faint in general and located below our M83 observation detection limit in the diagrams. We note, however, that the errors on our X-ray colors are large near the detection limit, and higher quality data would be required to clearly differentiate between a high-luminosity atoll source and a Z-source.
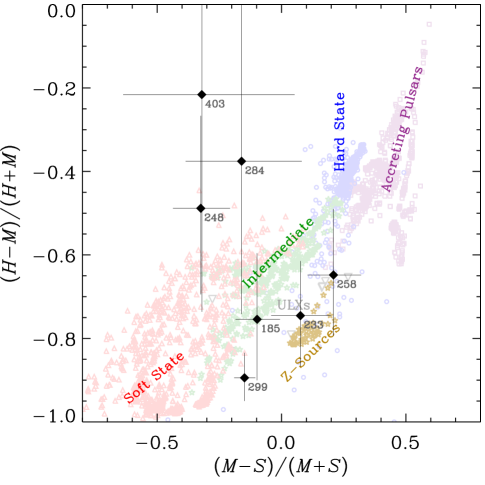
In addition to the Galactic BH binaries, accreting pulsars and ”Z-sources”, several ULXs observed by NuSTAR (Walton et al., 2013; Bachetti et al., 2013; Rana et al., 2014; Walton et al., 2014) are included as gray upside-down triangles. We note that the ULXs are well-separated from the Galactic binary tracks in the color-intensity plot (Figure 10), as expected given their high luminosities. The Galactic NS LMXBs overlap with Galactic BH binaries in the intermediate accretion state in the color-intensity plot. However, the two types may be differentiated in the color-color diagram, since NS binaries are likely to be softer in the NuSTAR hard band (12–25 keV). We plot the M83 NuSTAR sources with filled black diamonds and have annotated their L14 IDs. Fourteen out of the 21 NuSTAR sources have upper limits on the hard band flux. Therefore, we plot in Figure 11 only the seven sources with hard NuSTAR detections.
The brightest source in Figure 10 is x299, which appears to have colors similar to the other NuSTAR ULXs. The second brightest is x233, which is in the nuclear region, and may be confused with neighboring faint sources, making interpretation of this source difficult (see Figure 8).
One source, x286, has very soft X-ray colors placing it in the locus of the soft-state black holes. The remaining sources are consistent with intermediate accretion state BH binaries or NS LMXBs. We note x403 has been reported as an ULX candidate before (Immler et al., 1999; Stobbart et al., 2006; Ducci et al., 2013); the current NuSTAR observed colors and intensities suggest that this source is more consistent with a soft or intermediate accretion state BH binary. Unfortunately, we only have reliable NuSTAR fluxes for x403 from epoch 2 due to the stray light contamination from IC 4239A. We measure an of 2 1039 erg s-1 in the 0.5–8.0 keV band with XMM-Newton, which would qualify this source as a ULX based on the observed soft X-ray luminosity (see Appendix A). However, the NuSTAR properties are not consistent with other ULXs studied with NuSTAR.
III.3. NuSTAR Source Variability
Accreting binary populations are highly variable and NuSTAR has detected statistically significant variations in the X-ray binary populations in the NGC 253 monitoring campaign on timescales of several weeks to several months (Lehmer et al., 2013; Wik et al., 2014b). Here we extend this 4–25 keV variability analysis to M83 on 4–6 month timescales.
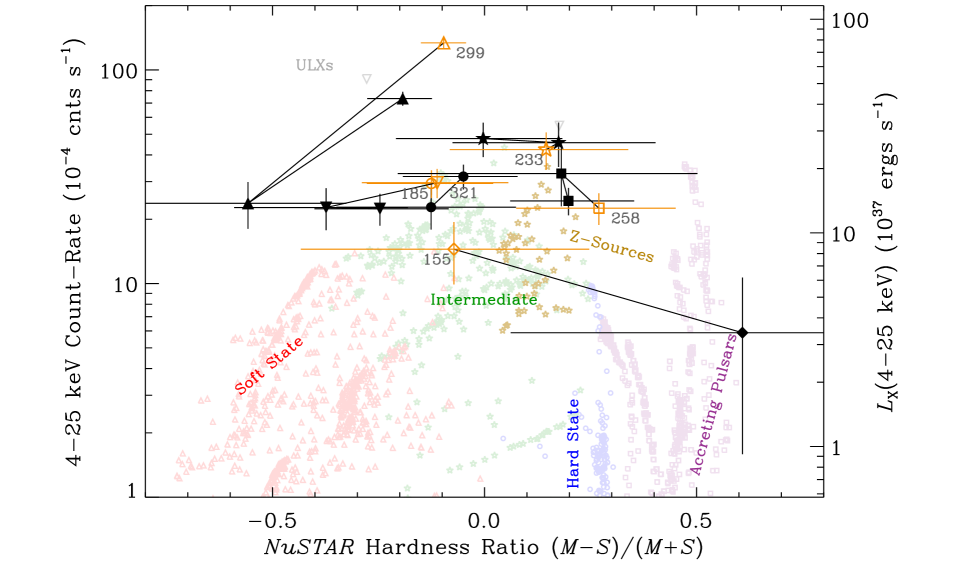
Source x299 changed in brightness significantly over the three epochs of the NuSTAR observations (90% error confidence; see Table 3). However, the majority of sources do not show statistically significant variability. This may be due to their large statistical errors. In one of the three epochs we have only an upper limit on the luminosity of three sources: x155, x048 and x286.
We also checked the variability of the NuSTAR hardness ratio (only the soft color). Figure 12 shows the variability of the five brightest sources and x155 (which shows some color variability) in the color-intensity plot. Due to the large errors in the colors of the remaining sources, they are not shown in the figure. The intensities and colors of the sources x233, x185, x321 and x258 did not change over the three epochs. x299 exhibits a possible state transition from ULX to soft/intermediate, and back to ULX. The XMM-Newton spectral analysis (the same datasets we used and an additional observation taken in July 2014) also suggests a similar state transition for this source (Soria et al., 2015). We present the detailed NuSTAR spectral analysis of this sources in the next section.
The source x155 has the same color and typical intensity as a BH-XRB in the intermediate state in epoch 1; however, this source was observed to be harder and dimmer 5 months later in epoch 2. Then, we only obtain an upper limit on its intensity another 5 months later in epoch 3. The source may be changing its accretion state from intermediate, soft, and to hard, with the soft state occurring sometime between epoch 1 and 2. However, within the formal statistical errors, we cannot rule out that the source stays in the intermediate accretion state while changing in brightness. We note that the color and intensity in epoch 2 alone is consistent with an accreting pulsar, yet this is not likely due to the observation during epoch 1. We also note that it is possible that the source is a NS binary.
We compare this NuSTAR intensity and color variability to the soft X-ray variabilities obtained from XMM-Newton and Chandra observations. Tables 10 and 11 list count rate, luminosity, and spectral parameters from the Chandra/XMM-Newton observations for spectra with at least 200 net counts. Some sources show variability in luminosity (see Table 10). However, there are no sources showing a spectral model change from disk blackbody to power law or vice versa, besides x185. For x185, the preferred spectral model changed from a power law to disk blackbody model statistically, but the overall spectral shape stayed similar having either a power law of 1.9 or a disk blackbody with 1.4 keV as well as no significant intensity change. This is consistent with the observed lack of variability for x185 in the NuSTAR hardness-intensity plot.
IV. Spectral Analysis
One of the NuSTAR starburst galaxies survey goals is to characterize the galaxy-wide 0.5–30 keV spectral properties of nearby star-forming galaxies, which ultimately is used to calibrate k-corrections for high-z galaxies (e.g., Lehmer et al. 2016). In this section, we perform joint spectral analysis using NuSTAR and XMM-Newton/Chandra to investigate the spectral properties of the brightest point sources along with the integrated galaxy spectra.
For the NuSTAR data, the source spectra and spectral response files (i.e., ARFs and RMFs) were created by the script nuproducts. We used the CIAO specextract script to create the corresponding files for the Chandra data. We utilized SAS arfgen and rmfgen to create the XMM-Newton response files.
We note that the background spectra for the Chandra data were created using a local background extracted from the vicinity of the source regions in the observation. Local backgrounds were also used for the XMM-Newton point source analysis; however, we used the ESAS analysis methods for the integrated galaxy analysis.333http://heasarc.gsfc.nasa.gov/docs/xmm/xmmhp_xmmesas.html Specifically, the instrument background was subtracted, but the soft proton, as well as foreground and cosmic background, were modeled during the fitting process. In order to characterize the soft proton, foreground, and cosmic backgrounds, we include a source-free spectrum using a 7′-10′ annulus around the galaxy center during the fitting procedure. As discussed in Wik et al. (2014a), the NuSTAR background strongly depends on detector position. Therefore, a local background is often not adequate for NuSTAR spectral analysis. We therefore obtained NuSTAR background spectra using nuskybgd.
The NuSTAR and XMM-Newton source spectra were grouped to have at least one count per spectral bin (see Wik et al., 2014a), whereas the Chandra spectra were not grouped. The joint fitting was performed in XSPEC using the C-statistic. The fitted energy is 0.5–7.0 keV for Chandra and XMM-Newton (although the 0.5–12.0 keV bandpass was used for the XMM-Newton ESAS analysis), and 3.0–20.0 keV for NuSTAR. The galaxy is not a strong hard X-ray emitter, and NuSTAR has strong instrumental line emission between 20–30 keV; therefore, we exclude data above 20 keV instead of attempting to model the complicated line emission. Except for the integrated galaxy spectra for epoch 1 (see next section for detail), we co-added spectra of obsids 50002043002 and 50002043004 for epoch 1 and obsids 50002043010 and 50002043012 for epoch 3 using the FTOOL addascaspec in order to increase the S/N ratios.
IV.1. ULX: x299
This source has the highest average luminosity over three epochs in the NuSTAR band (see Table 2). The source was discovered in 2010 with Chandra (Soria et al., 2012) as a ULX reaching 5 erg s-1 in 2011 in the 0.3–10 keV band. It has been bright for close to four years showing some color and intensity variability (Soria et al., 2015). The detailed XMM-Newton spectral analysis applying various models is published in Soria et al. (2015). We note that the third observation in Soria et al. (2015) was done with XMM-Newton in July 2014, which is about a month after our epoch 3 observation (with Chandra), although the first two XMM-Newton observations in their paper are also used in this work. Within a month, the source showed color variability, becoming harder in the Swift color band as shown in the Figure 2 of Soria et al. (2015). In summary, the high signal-to-noise XMM-Newton spectra taken in 2013 and 2014 show a curvature, although the Chandra spectra in 2010–2011 were dominated by a power law component. Soria et al. (2015) concluded that the XMM-Newton spectra were consistent with a slim disk model and that the source is varying between the ultraluminous and soft/high states.
In this paper, we jointly fit NuSTAR and Chandra/XMM-Newton spectra over the 0.5–20 keV band, applying four models to this source: an absorbed power law (PL), absorbed disk blackbody (DB), absorbed power law plus disk blackbody (PL+DB) or an absorbed broken power law (BPL). The resulting fit parameters are tabulated in Table 4. Overall, an absorbed power-law model is not preferred for epochs 1 and 3. However, an absorbed power law model and an absorbed disk blackbody model give comparable results (Cstat/dof of 525.1/611 and 524.6/611, respectively) during epoch 2, when the source is at its faintest level ( (5–10) 1038 erg s-1). The power law model was not preferred during epoch 2 when fitting only XMM-Newton data as shown in Table 11. Soria et al. (2015) also reported that a power law model was rejected during the 2013–2014 XMM-Newton observations. NuSTAR could be detecting a power law-like spectrum at 10–20 keV, where XMM-Newton is not sensitive.
We also tried an absorbed disk blackbody plus power law model. During epoch 1, the second component (power law) provides statistically significant improvement to the fit (100 for 2 additional dof). However, during epochs 2 and 3, the additional component only improves 15. The obtained fitted parameter values for epochs 1 and 2 are consistent with Soria et al. (2015). Although the power-law component for epoch 3 is not well constrained with our Chandra spectrum, our result for epoch 3 agrees with Soria et al. (2015) within the errors.
We performed a statistical test using XSPEC simftest with 1000 trials to see whether or not a power law component is required during epochs 1 and 2. The Chandra spectrum does not have enough S/N to confirm this, so we do not perform the test for the lower S/N epoch 3. During epoch 1, both XMM-Newton only and joint NuSTAR analyses require a power-law component in addition to a disk blackbody component. The power-law component was required at the 1 level during epoch 2 with the XMM-Newton only analysis. However, this power-law component was required at more than 3 when including NuSTAR data. We note that below 5 keV, the disk blackbody component dominates. Overall, the ULX shows very similar spectral properties to BH binaries in the intermediate accretion state.
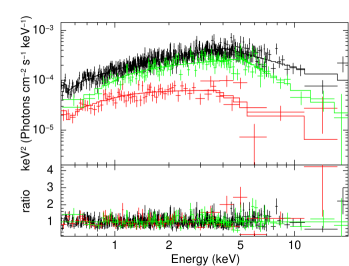
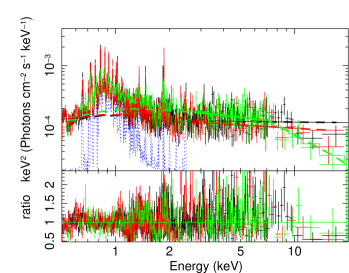
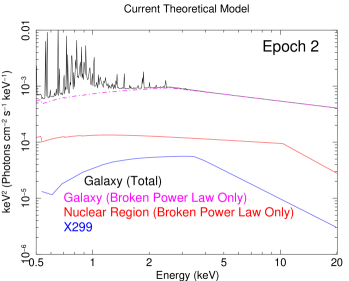
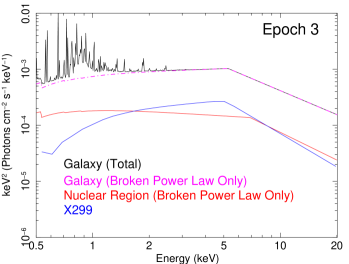
In order to compare the x299 spectral features to the integrated galaxy in Section 4.3, we also fitted with an absorbed broken power law model, which also fits the data well. Figure 13 shows the unfolded broken power-law joint NuSTAR and Chandra/XMM-Newton spectra of x299 for each epoch, exhibiting how spectral shapes are changing over three epochs.
| log | |||||||
|---|---|---|---|---|---|---|---|
| Norm (PL)/ | Norm | (0.5–30 keV) | |||||
| Modela | (1021 cm-2) | (10-4)/(keV) | (keV)/ – | (10-4) | cstat/dof | (erg s-1) | |
| Epoch 1 | |||||||
| PL | 1481.0/1342 | 39.7 | |||||
| DB | 1341.9/1342 | 39.5 | |||||
| PL+DB | 1238.3/1340 | 39.6 | |||||
| BPL | 1237.8/1340 | 39.6 | |||||
| Epoch 2 | |||||||
| PL | 525.1/611 | 39.0 | |||||
| DB | 524.6/611 | 38.7 | |||||
| PL+DB | 510.3/609 | 38.8 | |||||
| BPL | 512.3/609 | 38.8 | |||||
| Epoch 3 | |||||||
| PL | 788.0/670 | 39.4 | |||||
| DB | 662.2/670 | 39.3 | |||||
| PL+DB | 654.4/668 | 39.6 | |||||
| BPL | 665.7/668 | 39.4 | |||||
IV.2. Nucleus
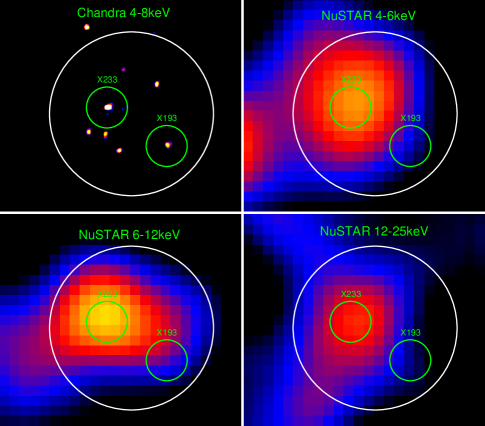
The nuclear region of M83 also appears as a bright NuSTAR source. The high spatial resolution Chandra images already reveal that there are several bright X-ray point sources near the center of M83 (see Figure 8). Yet, these sources are not resolved by the NuSTAR PSF. At most, we were able to identify via PSF-fitting two NuSTAR (x233 and x193) sources, separated by 15 arcsecond. Yet, these two sources cannot be separated when extracting spectra. Therefore, we utilize a 20′′ radius aperture (shown in Figure 8) to capture both sources as much flux as possible for spectral analysis while avoiding contamination from x299. In order to be consistent with the NuSTAR source spectra, we extract the XMM-Newton and Chandra spectra using the same 20′′ radius aperture as the NuSTAR aperture. Aperture corrections were applied to the NuSTAR and XMM-Newton data, since the sizes of the PSFs for these telescopes are larger than 20′′. For the Chandra data, we used area-weighted ARFs, since Chandra’s PSF size is much smaller than 20′′.
We applied three (PL, DB, BPL) models for the nuclear region but added a thermal gas component using a two temperature model (XSPEC apec + apec) to account for the strong diffuse soft X-ray emission seen in the Chandra data. The fitting results and luminosities for the nuclear region are tabulated in Tables 5 and 6.
For the two temperature model, the fitting suffered from a degeneracy between the column density and thermal gas temperatures, resulting in a high and a lower temperature. We, therefore, fixed the column density to the Galactic value (41020 cm-2; Dickey & Lockman, 1990). The obtained temperatures are 0.3–0.6 keV and 0.9–1.5 keV (see Table 5). The lower temperature is consistent with what Soria & Wu (2002) found ( = 0.6 keV) in the nuclear 16′′ starburst region using Chandra. We note that the second temperature is less constrained for the Chandra spectrum due to the poor S/N compared to the XMM-Newton data. The higher temperature (1 keV) is higher than those typically measured in the galaxy-wide spectra of nearby star-forming galaxies with Chandra (Mineo et al., 2012b). However, we limit our study to the nuclear region in M83, where intense star formation is on-going. It is possible that we detect a very hot gas component which is directly associated with supernova ejecta (Strickland & Heckman, 2007) as seen for example in the central region of M82.
Contrary to x299, a power law model with a steeper slope of 2.0–2.5 is preferred to a disk blackbody model. This is similar to the results obtained for the resolved nuclear sources x233 and x193 in Table B using Chandra and XMM-Newton alone. The luminosity in the 0.5–30 keV band does not change over the three epochs.
An absorbed broken power law fits well too, but it does not significantly improve the fit statistics. For epochs 1 and 2, residuals above 10 keV from a single power law indicate a break. When an absorbed broken power law is applied, the break energy is not constrained, and even after fixing it to the best-fit values (9–10 keV), the parameters of the two photon indices are almost identical, indicating that the break is not supported by the data. However, for epoch 3 we find strong support for a broken power-law model. The measured break energy is = keV as well as a steep power-law slope at harder energies (Table 5). These spectral characteristics are similar to what we expect with ULXs, intermediate accretion state BH binaries and NS binaries (Z-sources) (Church et al., 2012; Bachetti et al., 2013; Lehmer et al., 2013; Walton et al., 2013, 2014).
Since the nuclear region spectra are a collection of multiple sources, we do not interpret the fitted parameter values physically. Instead, we are curious how the spectral shape of the nuclear region varies over three epochs. The unfolded Chandra/XMM-Newton and NuSTAR spectra of the nuclear region in for each epoch are shown in Figure 14. The nuclear spectra are more or less consistent over the three epochs. The spectrum for epoch 3 becomes steeper at harder energies; however, the statistical uncertainties are very large above 10 keV for all three epochs.
One of NuSTAR’s strengths is to constrain the presence of an obscured AGN, which may not be visible in the soft X-ray bandpass with Chandra and XMM-Newton. To test this, we also applied the MyTorus model (Murphy & Yaqoob, 2009) to the nuclear region spectra. MyTorus is a model that self-consistently computes X-ray reprocessing for a power-law component in a toroidal geometry. For the fitting, the spectral model included a power-law component absorbed by a line-of-sight component (MyTorusZ) along with reflection components (MyTorusL and MyTorusS) which would likely be due to reflection from the opposite side of the toroidal obscuration as well as scattering from gas clouds in the vicinity of the nucleus. We assumed that some scattered emission (i.e., from highly ionized, optically thin gas near the AGN) is likely present and modeled this as being the same power law as used with MyTorus but with the normalization fixed at 30% of the main power-law (i.e., 30% of the AGN flux is scattered around the torus). Finally, we included components for thermal (XSPEC apec) and a second absorbed power-law to account for the X-ray binaries. All components included optically thin “global” absorption (i.e., toward the M83 system and within the extranuclear region).
To obtain a better constraint, we jointly fit three epoch spectra. We fixed global to as we used for the previous fits. The fitted thermal component temperatures were 0.62 keV and 1.0 keV with erg s-1. The best-fit AGN power-law normalization was 0, showing that no AGN component is required by the data. To establish the upper-limit on any intrinsic AGN luminosity, we fixed the AGN power-law slope to 1.8 and set MyTorus values at 1, 2 and 4 . We then increased the AGN power-law normalization until there was a change in C-statistic of 4.6. We then computed the intrinsic AGN luminosity by setting to 0, which then gave 90% upper-limits of 7.8 , 8.3 and 1.1 erg s-1 for the three values from the spectral fits. The slope and luminosities of the X-ray binary power-law component were 2.2 and 4.4 erg s-1, and 2.1 1039 erg s-1 for 10–30 keV and 0.5–30 keV, respectively.
| Norm | Norm | ||||||||
|---|---|---|---|---|---|---|---|---|---|
| Modela | Norm | (gas1) | (gas2) | ||||||
| +2 apec | (1021 cm-2) | (keV) | (keV)/– | (10-4) | (keV) | (10-4) | (keV) | (10-4) | |
| Epoch 1 | |||||||||
| PL | |||||||||
| DB | |||||||||
| BPL | 0.4 | 9.05 | |||||||
| Epoch 2 | |||||||||
| PL | 0.4 | ||||||||
| DB | 0.4 | ||||||||
| BPL | 0.4 | 10.3 | |||||||
| Epoch 3 | |||||||||
| PL | 0.4 | ||||||||
| DB | 0.4 | ||||||||
| BPL | 0.4 | ||||||||
| Modela | log | log | log | |
|---|---|---|---|---|
| 2 apec | C-stat/dof | (erg s-1) | (erg s-1) | (erg s-1) |
| Epoch 1 | ||||
| PL | 1017.6/1112 | 39.5 | 39.5 | 39.0 |
| DB | 1266.9/1113 | 39.4 | 39.5 | 39.2 |
| BPL | 1014.8/1112 | 39.4 | 39.5 | 39.0 |
| Epoch 2 | ||||
| PL | 793.4/905 | 39.4 | 39.5 | 39.0 |
| DB | 921.6/905 | 39.4 | 39.4 | 39.2 |
| BPL | 790.9/904 | 39.4 | 39.5 | 39.0 |
| Epoch 3 | ||||
| PL | 721.6/674 | 39.5 | 39.5 | 38.9 |
| DB | 775.1/674 | 39.4 | 39.5 | 39.2 |
| BPL | 703.5/672 | 39.5 | 39.5 | 39.0 |
IV.3. The 0.5–20 keV Integrated Galaxy Spectrum
The integrated galaxy spectra were extracted using the area covered by the observations, excluding data within regions of significant stray light (c.f., Figure 3). Due to the different roll angles between the observations, the size of the extraction area (see Figure 2) for the galaxy spectra were different among the six spectra (FPMA and FPMB for the three epochs). We note that all the NuSTAR sources are included in the NuSTAR spectra for all three epochs. In our NGC 253 work, we found that a small number of brightest sources dominate the integrated galaxy spectrum above 10 keV, which is characterized well as a broken power law showing rapid decrease at harder energies (Wik et al., 2014b). In this section, we examine which sources contribute to the total galaxy emission in the NuSTAR band and characterize the shape of the broadband X-ray spectrum of M83.
First, we performed the NuSTAR-only spectral analysis, which we show in Figure 15. In general, all three epochs can be characterized well with a power law of 2–3, although the integrated M83 NuSTAR spectra hint at a rapid decrease at harder energies, meaning that a broken power law would result in a good fit but with poorly constrained parameters in epochs 2 and 3. We also jointly fitted all three epoch spectra tying the power law indices but varying the normalization component. This would average the spectral shape but increase the S/N ratio. A simple power-law model gives a photon index of 2.60.1 with 1359/1268 (C-stat/dof). A broken power-law model gives a better fit with 1342/1266 (C-stat/dof), but the fit statistic is not significantly improved. The obtained fit parameters are 2.30.2 and = 3.0 with a break at 6.1 keV. These values are consistent with the integrated NuSTAR spectrum of NGC 253 (Wik et al., 2014b). Figure 15 shows the NuSTAR spectra for the integrated galaxy with the broken power-law model and data over model ratio.
For the joint NuSTAR and XMM-Newton/Chandra spectral analysis, we fit two models, either a power law or a broken power law, to the integrated galaxy spectra. Since the galaxy contains a significant amount of hot gaseous emission due to star forming activity, a thermal plasma component is also necessary. The resulting fit parameters and luminosities are listed in Tables 7 and 8.
The measured diffuse gas temperatures are 0.65–0.75 keV and 0.2–0.3 keV for both models. The 0.7 keV gas is consistent with the nuclear region; however, the second temperature is much lower compared to what we found in the spectral-fit result for the nuclear region ( 1 keV). These two temperatures are consistent with what Mineo et al. (2012b) found in the nearby star-forming galaxies. Unsurprisingly, the thermal gas component contribution is unchanged over three epochs. For all three epochs, the absorbed broken power-law model fits better than a single power-law model. The fit parameters for the broken power-law model are of 1.8 and of 2–3.5 with a break energy of 2–5.5 keV. We note that the power-law index for the harder energies and the break energy are somewhat difficult to be constrained due to low number counts in the NuSTAR spectra. Since the background/foreground components in the XMM-Newton spectra are not subtracted but modeled (see the ESAS threads and Section 4 above), we only show the models (with a broken power law) for the soft X-ray band but with the unfolded NuSTAR data points to show the statistical uncertainties in the hard X-ray energies in Figure 16.
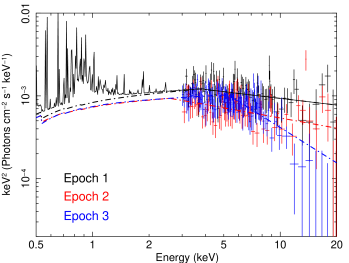
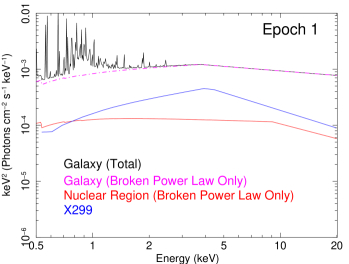
Figure 17 presents the model for the integrated galaxy spectrum for each epoch, along with the models of x299 (blue) and the nucleus (red, without thermal gas) to show how these components contribute to the integrated galaxy emission. In all cases, we show the absorbed broken power-law models. Source x299 shows about a factor of six change in its 0.5–30 keV luminosity, and this source effectively determines the shape of the integrated galaxy spectra, especially the location of the break energy. Specifically, the integrated galaxy spectra break around the energies where x299 shows breaks for epochs 1 and 3 when the source is bright. During epoch 2, x299 became dim, and the integrated galaxy spectrum shows a break at 2.5 keV, whereas the nuclear region and x299 show breaks at higher energies.
Table 9 lists the observed X-ray luminosities for the point source contribution to the galaxy, nuclear region, and x299 in the 0.5–30 keV and 10–30 keV. The nuclear region and x299 contribute about 15–30% of the total galaxy luminosity at 10–30 keV. The remaining flux is likely to be contributed by fainter point sources.
| Norm | Norm | ||||||||
|---|---|---|---|---|---|---|---|---|---|
| Modela | Norm | (gas1) | (gas2) | ||||||
| +2 apec | (1021 cm-2) | (10-4) | (keV) | (10-4) | (keV) | (10-4) | |||
| Epoch 1 | |||||||||
| PL | |||||||||
| BPL | 0.4 | ||||||||
| Epoch 2 | |||||||||
| PL | |||||||||
| BPL | |||||||||
| Epoch 3 | |||||||||
| PL | 0.4 | ||||||||
| BPL | 0.4 | ||||||||
| Modela | log | log | log | |
|---|---|---|---|---|
| 2 apec | C-stat/dof | (erg s-1) | (erg s-1) | (erg s-1) |
| Epoch 1 | ||||
| PL | 4391.3/4987 | 40.3 | 40.3 | 39.6 |
| BPL | 4343.5/4985 | 40.3 | 40.3 | 39.7 |
| Epoch 2 | ||||
| PL | 3677.0/4970 | 40.2 | 40.3 | 39.8 |
| BPL | 3631.3/4937 | 40.2 | 40.2 | 39.6 |
| Epoch 3 | ||||
| PL | 1023.2/862 | 40.2 | 40.2 | 39.4 |
| BPL | 862.5/860 | 40.1 | 40.2 | 39.6 |
| Epoch | Galaxy | Nucleus | x299 | |||
|---|---|---|---|---|---|---|
| 0.5–30 keV | 10–30 keV | 0.5–30 keV | 10–30 keV | 0.5–30 keV | 10–30 keV | |
| (1039 erg s-1) | (1039 erg s-1) | (1039 erg s-1) | (1039 erg s-1) | (1039 erg s-1) | (1039 erg s-1) | |
| 1 | 15.2 | 3.5 | 1.7 | 0.30 | 4.0 | 0.45 |
| 2 | 10.7 | 1.9 | 1.6 | 0.19 | 0.52 | 0.02 |
| 3 | 10.4 | 0.93 | 2.1 | 0.15 | 2.0 | 0.12 |
V. Discussion
V.1. Nature of the NuSTAR Point Sources in M83
We have identified a total of 21 point sources in M83 with NuSTAR and all of these sources are listed in the Chandra point source catalog compiled by L14. There are no bright hard X-ray sources that appear in the NuSTAR observations but do not have Chandra counterparts. One (x165) of these sources is classified as a background AGN based on its association with an optical counterpart (L14). It is expected that background AGN would have NuSTAR colors similar to intermediate-state BH binaries and indeed this is the case for x165. However, for x165, the NuSTAR source has a large positional offset (6.7′′) from the nearest Chandra counterpart, and may be a false match. We note that the number of expected background sources above a 4–25 keV count rate of cts s-1 is for the entire based on the NuSTAR - measurements of Harrison et al. (2015). This is far fewer than the total 21 point sources and should not affect our main results. We further note that the Chandra sources have been thoroughly studied using multi-wavelength data and since any moderate-redshift AGN would have optical/IR counterparts already identified, the remaining point sources identified in our NuSTAR observations are unlikely to be background AGN.
The remaining 20 sources are thus likely to be associated with M83. Our diagnostics suggest that the majority of the NuSTAR point sources in M83 are consistent with BH binaries in the intermediate accretion state and NS LMXBs. We note that this could be due to a selection bias. The intermediate state in our diagrams by selection traces the Very High State (VHS; Done et al., 2007) also referred to as the Steep Power Law (SPL; see review in Tetarenko et al., 2016) and thus likely our more X-ray luminous sources are in this higher state. The commonality with the intermediate state for lower X-ray luminosity black holes is that the disk and non-thermal components are of comparable magnitude. We also point out that NS LMXBs with high X-ray luminosity on the plot are likely to be Z-sources, accreting very close to their Eddington limit.
Fourteen out of the 21 NuSTAR sources have been studied in detail via Chandra spectral analysis in L14, who have classified five of them as soft state accreting BH binaries. This includes source x286, which is also classified as a BH-XRB in the soft accretion state from our NuSTAR color diagnostics. For the remaining four BH binaries (x321, x248, x284, x403) that were identified as soft state sources by Chandra, we measured NuSTAR colors that are more consistent with the intermediate state; however, they are still consistent with the soft state within the (large) errors. We also point out that the boundaries of the different states in our diagrams are not sharp.
Differentiating between intermediate and soft accretion states is difficult using only the Chandra band as the spectra are more subtly different in this band (e.g., Figure 9 of Done et al., 2007). NuSTAR has a larger lever arm, akin to the hard X-ray capabilities of RXTE, for detecting the harder components and more sensitively discriminating the intermediate accretion state for these sources. It is possible that detecting objects in this state is thus simply due to a detection limit bias.
The other previously identified ULX, x403 (Immler et al., 1999; Ducci et al., 2013), reached luminosity of (2–3)1039 erg s-1 in the 0.5–8.0 keV in Jan. 2014 (see Table 4). This source is not very bright in the NuSTAR data, indicating a steeper spectrum. In our spectral fitting of x403 (see Appendix A), an absorbed power law is preferred to an absorbed blackbody disk model. Applying an absorbed disk-blackbody plus power-law model to the XMM-Newton spectra (both epochs 1 and 2) resulted in a power-law photon index 3–3.5, and this power-law component dominates even in the softer energy band. The disk-blackbody component is still required above 2 significance. We find that the inner disk temperature is 0.9–1.1 keV, which is consistent with the measured from the XMM-Newton data taken in 2013 and 2014 as well as the Chandra observations taken in 2012 (L14), and also is a typical value for BH binaries.
L14 classified five of the 21 NuSTAR sources (x29, x185, x152, x281, x193) as NSs in XRBs with accretion rates near or above the Eddington limit. Their classification was based on the X-ray luminosity and disk temperature. We note that NS binaries likely have similar NuSTAR soft colors to those of BH binaries, and it is difficult to distinguish between the two populations in the color-intensity diagnostic alone as shown in the previous section. The NuSTAR intensity and (soft) color of the four sources (x29, x152, x281, x193) are consistent with Galactic NS LMXBs as well as BH binaries with intermediate accretion state (Figure 10). The NuSTAR color-color diagnostic may separate two types; however, the hard colors for the three sources are not constrained well. The colors and intensity for x185 is more consistent with BH binaries with intermediate accretion state. Hard X-ray luminosity is a useful discriminant (see e.g., Figure 13 of Barret et al., 2000), and it is rather unlikely to find NS binaries with erg s-1 (4–25 keV). It is thus worth exploring if the high-luminosity sources in M83 may indeed be NSs.
From the measured NuSTAR count rates, we estimate that two of the NS binary candidates (x152 and x281) have just below 1038 erg s-1 in the 4–25 keV band, suggesting that they could be NS binaries. Three other sources have a few times 1038 erg s-1 (4–25 keV), placing them in the BH luminosity range. However, L14 mention that x185 is a NS X-ray binary radiating above 2–3 times its Eddington luminosity with an inner accretion disk temperature 2.2 keV, which corresponds to 10 km. When we apply a power-law plus disk-blackbody model to the XMM-Newton epoch 1 spectrum of x185, we also obtain a high disk temperature value, 2.6 keV, although our temperature is not well-constrained. As L14 argue, this temperature would be too high for a BH binary. We also applied an absorbed blackbody plus disk-blackbody model, which is a typical spectral model for a NS compact binary. This model fit is comparable to the power-law plus disk-blackbody model fit, resulting in = 2.2 keV and a blackbody temperature of 0.3 keV. Since it is expected that NSs have –2 keV (e.g. Church et al., 2014), it is likely that we are unable to decouple the NS blackbody from the disk component.
Sometimes, the optical counterpart of X-ray sources help to distinguish the nature of the sources. Z-sources in Figure 10 are considered to be LXMBs; therefore, we do not expect these systems to contain young stars as their companions. We note that all five sources are located in/near star-forming regions (L14). However, L14 did not find unique optical counterparts for three sources (x152, x185, x281), suggesting that at least these sources could be LMXBs and possibly Z-sources.
The ULX, x299, is the brightest object in the 4–6, 6–12, and 4–25 keV bands except for the Jan 2014 observation when the source was faint ( erg s-1). NuSTAR colors and intensity among three epochs confirm that the source moves between the ultraluminous state and high/soft or intermediate accretion states, as Soria et al. (2015) suggested from the XMM-Newton spectral analysis. Soria et al. (2015) estimated the mass of the BH to be 10–20 , resulting in . The broadband spectral analysis indicates that the bulk of the emission is radiated below 10 keV.
V.2. Comparison to the NGC 253 NuSTAR source population
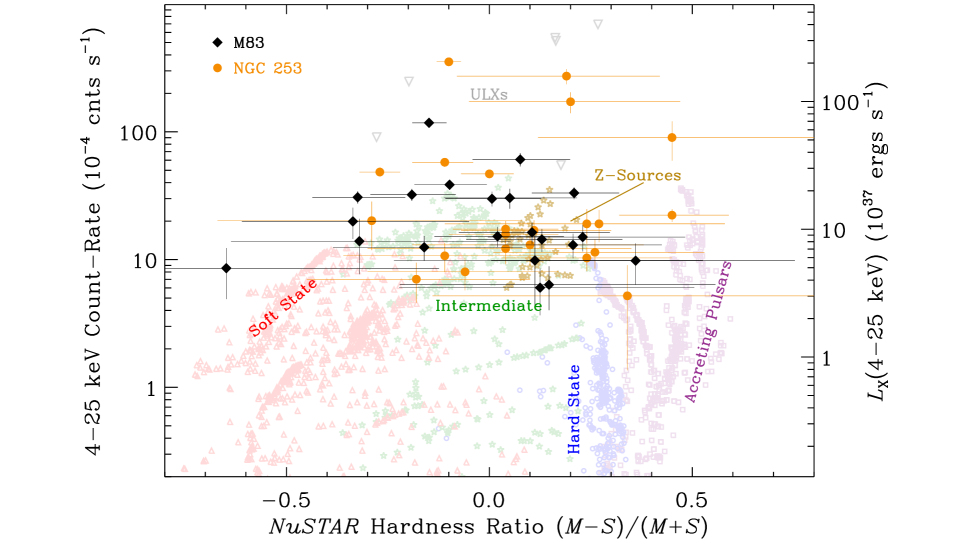
In this section we compare the NuSTAR sources detected in NGC 253 and M83, which are star-forming galaxies at comparable distances, with deep NuSTAR coverage, but slightly different star formation properties.
Based on the GALEX FUV and Spitzer 24 m luminosities by Lee et al. (2011) and Dale et al. (2009b) and using the SFR equations from Calzetti (2013), we find that M83 and NGC 253 have SFRs of 3.2 yr-1 and 6.1 yr-1, respectively. The stellar mass estimated for M83 and NGC 253 from the 2MASS -magnitudes (Jarrett et al., 2003) and the conversion by Bell et al. (2003) are 3.3 1010 and 5.7 1010 , respectively. There are 21 point sources total detected in M83 (see § 5.1) and 22 point sources total in NGC 253 (Wik et al., 2014b), with M83 exhibiting fewer luminous sources (one ULX) than NGC 253 (at least four ULXs). Based on their SFRs and the XLF of nearby galaxies, we expect 1.5 ULXs for M83 and 3 ULXs for NGC 253 (Swartz et al., 2011; Mineo et al., 2012a).
Figure 18 displays both the M83 and NGC 253 NuSTAR detected sources in the intensity-hardness plot which is useful for discriminating between BH accretion states (Zezas et al., in prep.). Most of the sources in NGC 253 and M83 have similar colors and intensities to Milky Way BH binaries in the intermediate and/or very high state. However, we note that, albeit at slightly lower X-ray luminosity, NS LMXBs occupy a similar region of the hardness-intensity diagram as BH-XRBs (Figure 10; also Done et al., 2007). Therefore, most of these sources are also consistent with Z-sources. The color-color diagram shown in Figure 11 constrains the nature of the sources better; however, not all the XRBs have sufficiently high S/N ratios in the 12–25 keV band to allow the use of this more discriminatory color-color diagnostic. We note that there has been heightened interest in luminous NS XRB populations recently given the recent discovery by NuSTAR of an extremely luminous pulsar in M82 (e.g., Bachetti et al., 2014). To address the question of the nature of higher non-magnetized NS XRBs, a system like M83 is ideal.
We found one accreting pulsar candidate (no pulsation found) in NGC 253, whereas no such candidates were found in M83. Our detection limit of 1038 erg s-1 is near the upper end of the luminosity for Galactic accreting pulsars. An accreting pulsar with such a luminosity could be either a Type II burst accreting pulsar (Be-XRB, the most numerous subclass of HMXBs in the Milky Way and the Magellanic Clouds; Reig et al. 2008) or a Roche lobe overflow pulsar with a supergiant companion like SMC X-1. Be XRBs are generally found to be associated with young bursts of star formation (10–40 Myr; Antoniou et al., 2010; Antoniou & Zezas, 2016). However, Type II X-ray bursts are rare and short-lived (generally lasting only a few orbital timescales); therefore, detecting such a system points to a host galaxy with a very young stellar population. Contrary to the transient behavior of Be XBRs, Roche lobe overflow systems with a supergiant, which are also very young systems, are persistent, but they are a small fraction of the total population. We note that the persistent nature of the pulsar candidate in NGC 253 may argue against a BeXRB nature but it could be a supergiant pulsar. We did not found any pulsar binaries in M83, because we assume that the most intense star-forming activity is the nuclear region of the galaxy which may be confused at the resolution of NuSTAR. In the disk, the XRB populations are much older, and the number of BeXRBs we would expect to observe in a single exposure is very small. The same holds for Roche lobe overflow supergiants.
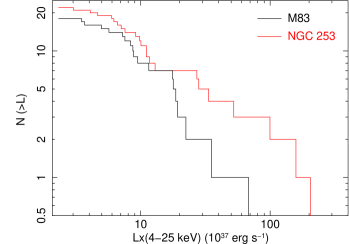
It has been more than two decades since the first measurement of the strong correlation of X-ray emission from star-forming galaxies with host galaxy properties such as SFR (e.g., David et al., 1992) and it is now relatively well established that much of this strong correlation, particularly at keV, is due to X-ray binary populations (e.g., Fabbiano, 2006, and references therein). One very useful tool for studying binary populations is the XLF. Specifically, it is now well established that the normalization of the binary XLF for HMXBs and ULXs scales with SFR (Grimm et al., 2003; Mineo et al., 2012a; Swartz et al., 2011) whereas the LMXB XLF scales with stellar mass (Gilfanov, 2004; Kim & Fabbiano, 2010). The XLF for resolved point sources is a powerful tool for characterizing point source populations in nearby galaxies. The slope of the binary XLF in the 0.5–10 keV bands gets steeper as the underlying stellar population evolves and the dominant population shifts from HMXBs to LMXBs (e.g., Wu, 2001). The high- slope of the Chandra XLF for M83 is found to be steeper (=1.38) than that of NGC 253 (=0.81) (Kilgard et al., 2002), implying that NGC 253 is likely to be HMXB dominated whereas M83 (especially in the disk) is LMXB dominated (see also L14). The XLF slopes also differ within M83, showing a flatter slope for the nuclear starburst region and a steeper slope for the disk region (L14).
We constructed NuSTAR XLFs using the 4–25 keV band for both M83 and NGC 253, which are shown in Figure 19. We excluded three (x403, x029, x366) sources in M83, because they were not in the NuSTAR FoV for all three epochs. The remaining sources have roughly similar detection sensitivities in the different epochs (a 30% difference in the effective exposures). All 22 NuSTAR sources in NGC 253 were in the NuSTAR FoV for all epochs, thus no sources were excluded.
The flattening below 5 1037 erg s-1 (0.001 cts s-1) suggests that incompleteness may be an issue below this limit. We therefore confine our comparisons to above this limit. We clearly see that the high- slope of the M83 NuSTAR LF is steeper than that of NGC 253, which is similar to the soft X-ray LFs for these galaxies with Chandra. A more detailed analysis of the NuSTAR XLF will be presented in a forthcoming paper.
V.3. Lack of an Active Nucleus?
The position of the galactic center of M83 has been debated (see Knapen et al., 2010). M83 possesses a nuclear star cluster, which is referred to as the optical nucleus (Gallais et al., 1991). The kinematic center and photometric center are coincident with each other; however, the nuclear star cluster is 3′′ offset from this location (see Figure 1 of Knapen et al. 2010 as well as Sakamoto et al. 2004, Muraoka et al. 2009). This offset suggests there may be a hidden nuclear mass (i.e., Thatte et al., 2000). However, recent studies (Houghton & Thatte, 2008; Knapen et al., 2010) prefer to adopt the nuclear star cluster as the nucleus.
Our NuSTAR observations detect hard (10 keV) X-ray emission from the nuclear region; however, our analysis suggests that the emission is likely to be the integrated emission from X-ray binaries instead of the X-ray emission from an obscured AGN based on the steep spectra and the resolution of this emission into several sources by Chandra. If M83 contained a highly obscured AGN such as the Compton-thick AGN in Arp 299 (Ptak et al., 2015), then we would have expected a rising power law to 20–40 keV, which we do not observe.
Soria & Wu (2003) and L14 have shown that there is an X-ray counterpart (x233) coincident with the position of the star cluster nucleus. The averaged spectral slope during 2010 of this X-ray source in the soft X-ray band is a power law with photon index of 1.4 and of 3 1038 erg s-1 in the 0.5–8.0 keV band (L14). They suggest that this could be a SMBH with a mass of 1.3 107 (Thatte et al., 2000) accreting with 10-7 , but they cannot reject the possibility that it is a compact binary at the location of the nuclear star cluster (e.g., La Parola et al. 2003 for M33, and Yukita et al. 2007 for NGC 2403).
X233 is also detected in our observations taken in June 2014. Taking a 2′′ radius extraction region (331 net counts in the 0.5–8.0 keV band) in the Chandra data in order to reduce the contamination of underlying thermal diffuse emission (note that Tables 10 and 11 use a 5′′ radius), an absorbed power-law model gives =2.3 and = 1.31021 cm-2 with 2.8 1038 erg s-1 in the 0.5–8.0 keV band. The intrinsic luminosity is about 1.3 times higher than the observed luminosity. The spectral slope reported here is steeper (in June 2014) than that observed in 2010 reported by L14, but the X-ray luminosity in the Chandra band is comparable.
If we extrapolate the spectral shape using a power law with photon index of 2.3, obtained from the Chandra spectrum, into the NuSTAR band, we expect x233 has NuSTAR count rates of 410-4 ct s-1, 510-4 ct s-1, and 110-4 ct s-1 for the 4–6, 6–12, 12–25 keV bands during epoch 3, respectively. These expected 4–6 keV and 6–12 keV count rates are about a factor of 5 lower than the count rates measured by NuSTAR for the nuclear region, implying x233 makes only a small contribution to the nuclear region emission (see Table 3).
We only obtained an upper limit for the observed 12–25 keV count rate, but the expected power-law model count rate in the hard band is below the upper limit of 5.9 10-4 ct s-1. The faint sources near x233, that were resolved in the Chandra image, were not resolved in the NuSTAR images, and these sources may contribute to the measured x233 count rate in the 4–12 keV band. Therefore, the NuSTAR data do not reject that x233 is M83’s SMBH accreting at very low level, whose 0.5–25 keV spectrum is characterized by a single power law with an index of 2.3. We measure a very low sub-Eddington value for the total X-ray luminosity of the central source. AGNs with these very low levels of typically have spectral slopes of (e.g., Shemmer et al., 2006; Younes et al., 2011), shallower than the constraints we have for the nuclear source. This makes it very unlikely that x233 is powered by an AGN. We note that the measured X-ray luminosity and spectral values for the nuclear source are also consistent with an X-ray binary.
VI. Summary
We present the first-ever spatially-resolved study of point sources in M83 above 10 keV, which was made possible with new NuSTAR observations. NuSTAR’s harder energy bandpass constrains and classifies the nature of the resolved sources and accretion states for both BH and NS systems (Wik et al. 2014b, Maccarone et al. 2016). This is only the second deep NuSTAR survey of “resolved” compact object populations in a star-forming galaxy outside of the MW following our first study of the nearby starburst NGC 253. Our main results are listed below:
-
•
Twenty point sources, which are likely associated with the galaxy and are thus XRBs, were found in the NuSTAR images. We found that all the NuSTAR-detected sources are detected in the extremely deep archival Chandra data available for M83, albeit with a broader range of hard X-ray colors than is seen in the soft X-ray data alone.
Overall, the NuSTAR M83 XRB population differs from that of NGC 253 studied by Wik et al. (2014b) mainly in that M83 possesses fewer luminous sources (fewer ULXs) than NGC 253 in the NuSTAR band, which is expected based on the higher SFR (6 yr-1) of NGC 253.
-
•
We have constructed the NuSTAR X-ray binary LF in the 4–25 keV for an extragalactic environment for the first time. The slope of the NuSTAR XRB XLF for M83 is steeper than that of NGC 253, consistent with previous Chandra results studied at soft X-ray energies. Note one might expect major differences in the XRB LF at keV as we probe to lower ( erg s-1) typical of the obscured HMXB population observed in the Milky Way with INTEGRAL (Lutovinov et al., 2013).
-
•
We classified XRBs using the NuSTAR point source color-intensity and color-color diagrams. Based on their NuSTAR colors and intensities, the majority of the sources are likely to be intermediate accretion state BH binaries and NS LMXBs (Z-sources). One source is likely to be a soft/high-state BH binary. The known ULX, x299, has a luminosity and color (turning over at higher energies) that is similar to other ULXs studied with NuSTAR. x299 shows long term variability and possible spectral state transitions, from ULX to soft/intermediate and then back to the ULX state. This state-transition behavior of x299 is similar to what was observed by Soria et al. (2015) using XMM-Newton data. Other sources do not show long term variability or state transitions.
-
•
The 0.5–20 keV spectra of the nuclear region indicate no strong reprocessed X-ray emission from the nucleus of M83, suggesting that there is no buried/highly obscured actively accreting SMBH present in this galaxy. We place an upper limit of erg s-1 in the 10–30 keV band for an obscured AGN. The X-ray point source, x233, found at the location of the nuclear star cluster can be described as a single power law with an index of 2.3 up to 25 keV, a spectral shape that is more consistent with a luminous X-ray binary. However, our data do not rule out the possibility that the source is a low luminosity AGN.
-
•
The galaxy-wide spectrum of M83 becomes steeper (with power law index 2) at harder energies, also seen in other starburst galaxies observed by NuSTAR. Either ULX-like sources, intermediate accretion state BH binaries, or NS LMXBs (Z-sources) dominate the 10–30 keV emission in these galaxies. This revised 0.5–30 keV SED is of great utility in doing proper k-corrections of high- X-ray constraints on galaxies in the deep Chandra surveys (see, e.g., Lehmer et al. 2016).
We thank the referee for useful comments and suggests that improved this paper. This work was supported under NASA Contract No. NNG08FD60C, and made use of data from the NuSTAR mission, a project led by the California Institute of Technology, managed by the Jet Propulsion Laboratory, and funded by the National Aeronautics and Space Administration. We sincerely thank Karl Forster and Brian Grefenstette for their work on the complicated stray light pattern and for assistance in designing the NuSTAR observational setup for minimizing this contamination. We also thank NuSTAR and Chandra mission planners for making the Chandra and NuSTAR observations simultaneous. We also thank P. Tzanavaris and D. Swartz for helpful discussion. Support for this work was provided by the National Aeronautics and Space Administration through Chandra Award Number GO4-15086Z issued by the Chandra X-ray Observatory Center, which is operated by the Smithsonian Astrophysical Observatory for and on behalf of the National Aeronautics Space Administration under contract NAS8-03060. RK acknowledges support from Russian Science Foundation (grant 14-12-01315).
Facilities: Chandra, NuSTAR, XMM-Newton
References
- An et al. (2014) An, H., Madsen, K. K., Westergaard, N. J., et al. 2014, in Society of Photo-Optical Instrumentation Engineers (SPIE) Conference Series, Vol. 9144, Society of Photo-Optical Instrumentation Engineers (SPIE) Conference Series, 1
- Anders & Grevesse (1989) Anders, E., & Grevesse, N. 1989, Geochim. Cosmochim. Acta, 53, 197
- Antoniou & Zezas (2016) Antoniou, V., & Zezas, A. 2016, MNRAS, 459, 528
- Antoniou et al. (2010) Antoniou, V., Zezas, A., Hatzidimitriou, D., & Kalogera, V. 2010, ApJL, 716, L140
- Bachetti et al. (2013) Bachetti, M., Rana, V., Walton, D. J., et al. 2013, ApJ, 778, 163
- Bachetti et al. (2014) Bachetti, M., Harrison, F. A., Walton, D. J., et al. 2014, Nature, 514, 202
- Barret et al. (2000) Barret, D., Olive, J. F., Boirin, L., et al. 2000, ApJ, 533, 329
- Bell et al. (2003) Bell, E. F., McIntosh, D. H., Katz, N., & Weinberg, M. D. 2003, ApJS, 149, 289
- Boissier et al. (2005) Boissier, S., Gil de Paz, A., Madore, B. F., et al. 2005, ApJL, 619, L83
- Calzetti (2013) Calzetti, D. 2013, Star Formation Rate Indicators, ed. J. Falcón-Barroso & J. H. Knapen, 419
- Church et al. (2014) Church, M. J., Gibiec, A., & Bałucińska-Church, M. 2014, MNRAS, 438, 2784
- Church et al. (2012) Church, M. J., Gibiec, A., Bałucińska-Church, M., & Jackson, N. K. 2012, A&A, 546, A35
- Dale et al. (2009a) Dale, D. A., Cohen, S. A., Johnson, L. C., et al. 2009a, ApJ, 703, 517
- Dale et al. (2009b) —. 2009b, ApJ, 703, 517
- David et al. (1992) David, L. P., Jones, C., & Forman, W. 1992, ApJ, 388, 82
- Dickey & Lockman (1990) Dickey, J. M., & Lockman, F. J. 1990, ARA&A, 28, 215
- Done et al. (2007) Done, C., Gierliński, M., & Kubota, A. 2007, A&A Rev., 15, 1
- Ducci et al. (2013) Ducci, L., Sasaki, M., Haberl, F., & Pietsch, W. 2013, A&A, 553, A7
- Fabbiano (2006) Fabbiano, G. 2006, ARA&A, 44, 323
- Gallais et al. (1991) Gallais, P., Rouan, D., Lacombe, F., Tiphene, D., & Vauglin, I. 1991, A&A, 243, 309
- Gilfanov (2004) Gilfanov, M. 2004, MNRAS, 349, 146
- Gladstone et al. (2009) Gladstone, J. C., Roberts, T. P., & Done, C. 2009, MNRAS, 397, 1836
- Grimm et al. (2003) Grimm, H.-J., Gilfanov, M., & Sunyaev, R. 2003, MNRAS, 339, 793
- Harrison et al. (2013) Harrison, F. A., Craig, W. W., Christensen, F. E., et al. 2013, ApJ, 770, 103
- Harrison et al. (2015) Harrison, F. A., Aird, J., Civano, F., et al. 2015, ArXiv e-prints, arXiv:1511.04183
- Houghton & Thatte (2008) Houghton, R. C. W., & Thatte, N. 2008, MNRAS, 385, 1110
- Immler et al. (1999) Immler, S., Vogler, A., Ehle, M., & Pietsch, W. 1999, A&A, 352, 415
- Jarrett et al. (2003) Jarrett, T. H., Chester, T., Cutri, R., Schneider, S. E., & Huchra, J. P. 2003, AJ, 125, 525
- Kilgard et al. (2002) Kilgard, R. E., Kaaret, P., Krauss, M. I., et al. 2002, ApJ, 573, 138
- Kim & Fabbiano (2010) Kim, D.-W., & Fabbiano, G. 2010, ApJ, 721, 1523
- King et al. (2001) King, A. R., Davies, M. B., Ward, M. J., Fabbiano, G., & Elvis, M. 2001, ApJL, 552, L109
- Knapen et al. (2010) Knapen, J. H., Sharp, R. G., Ryder, S. D., et al. 2010, MNRAS, 408, 797
- La Parola et al. (2003) La Parola, V., Damiani, F., Fabbiano, G., & Peres, G. 2003, ApJ, 583, 758
- Lee et al. (2011) Lee, J. C., Gil de Paz, A., Kennicutt, Jr., R. C., et al. 2011, ApJS, 192, 6
- Lehmer et al. (2013) Lehmer, B. D., Wik, D. R., Hornschemeier, A. E., et al. 2013, ApJ, 771, 134
- Lehmer et al. (2015) Lehmer, B. D., Tyler, J. B., Hornschemeier, A. E., et al. 2015, ApJ, 806, 126
- Lehmer et al. (2016) Lehmer, B. D., Basu-Zych, A. R., Mineo, S., et al. 2016, ArXiv e-prints, arXiv:1604.06461
- Long et al. (2014) Long, K. S., Kuntz, K. D., Blair, W. P., et al. 2014, ApJS, 212, 21
- Lutovinov et al. (2013) Lutovinov, A. A., Revnivtsev, M. G., Tsygankov, S. S., & Krivonos, R. A. 2013, MNRAS, 431, 327
- Maccarone et al. (2016) Maccarone, T. J., Yukita, M., Hornschemeier, A., et al. 2016, MNRAS, 458, 3633
- Madsen et al. (2015) Madsen, K. K., Harrison, F. A., Markwardt, C., et al. 2015, ArXiv e-prints, arXiv:1504.01672
- Mineo et al. (2012a) Mineo, S., Gilfanov, M., & Sunyaev, R. 2012a, MNRAS, 419, 2095
- Mineo et al. (2012b) —. 2012b, MNRAS, 426, 1870
- Mitsuda et al. (1984) Mitsuda, K., Inoue, H., Koyama, K., et al. 1984, PASJ, 36, 741
- Muraoka et al. (2009) Muraoka, K., Kohno, K., Tosaki, T., et al. 2009, PASJ, 61, 163
- Murphy & Yaqoob (2009) Murphy, K. D., & Yaqoob, T. 2009, MNRAS, 397, 1549
- Poutanen et al. (2007) Poutanen, J., Lipunova, G., Fabrika, S., Butkevich, A. G., & Abolmasov, P. 2007, MNRAS, 377, 1187
- Ptak et al. (2015) Ptak, A., Hornschemeier, A., Zezas, A., et al. 2015, ApJ, 800, 104
- Rana et al. (2014) Rana, V., Harrison, F. A., Bachetti, M., et al. 2014, ArXiv e-prints, arXiv:1401.4637
- Reig (2008) Reig, P. 2008, A&A, 489, 725
- Saha et al. (2006) Saha, A., Thim, F., Tammann, G. A., Reindl, B., & Sandage, A. 2006, ApJS, 165, 108
- Sakamoto et al. (2004) Sakamoto, K., Matsushita, S., Peck, A. B., Wiedner, M. C., & Iono, D. 2004, ApJL, 616, L59
- Shakura & Sunyaev (1973) Shakura, N. I., & Sunyaev, R. A. 1973, A&A, 24, 337
- Shemmer et al. (2006) Shemmer, O., Brandt, W. N., Netzer, H., Maiolino, R., & Kaspi, S. 2006, ApJL, 646, L29
- Smith et al. (2001) Smith, R. K., Brickhouse, N. S., Liedahl, D. A., & Raymond, J. C. 2001, ApJL, 556, L91
- Soria et al. (2015) Soria, R., Kuntz, K. D., Long, K. S., et al. 2015, ApJ, 799, 140
- Soria et al. (2012) Soria, R., Kuntz, K. D., Winkler, P. F., et al. 2012, ApJ, 750, 152
- Soria & Wu (2002) Soria, R., & Wu, K. 2002, A&A, 384, 99
- Soria & Wu (2003) —. 2003, A&A, 410, 53
- Stobbart et al. (2006) Stobbart, A.-M., Roberts, T. P., & Wilms, J. 2006, MNRAS, 368, 397
- Strickland & Heckman (2007) Strickland, D. K., & Heckman, T. M. 2007, ApJ, 658, 258
- Sutton et al. (2013) Sutton, A. D., Roberts, T. P., & Middleton, M. J. 2013, MNRAS, 435, 1758
- Swartz et al. (2011) Swartz, D. A., Soria, R., Tennant, A. F., & Yukita, M. 2011, ApJ, 741, 49
- Tananbaum et al. (1972) Tananbaum, H., Gursky, H., Kellogg, E., Giacconi, R., & Jones, C. 1972, ApJL, 177, L5
- Tetarenko et al. (2016) Tetarenko, B. E., Sivakoff, G. R., Heinke, C. O., & Gladstone, J. C. 2016, ApJS, 222, 15
- Thatte et al. (2000) Thatte, N., Tecza, M., & Genzel, R. 2000, A&A, 364, L47
- Tzanavaris et al. (2006) Tzanavaris, P., Georgantopoulos, I., & Georgakakis, A. 2006, A&A, 454, 447
- Walton et al. (2013) Walton, D. J., Fuerst, F., Harrison, F., et al. 2013, ApJ, 779, 148
- Walton et al. (2014) Walton, D. J., Harrison, F. A., Grefenstette, B. W., et al. 2014, ApJ, 793, 21
- Wik et al. (2014a) Wik, D. R., Hornstrup, A., Molendi, S., et al. 2014a, ApJ, 792, 48
- Wik et al. (2014b) Wik, D. R., Lehmer, B. D., Hornschemeier, A. E., et al. 2014b, ApJ, 797, 79
- Wu (2001) Wu, K. 2001, PASA, 18, 443
- Younes et al. (2011) Younes, G., Porquet, D., Sabra, B., & Reeves, J. N. 2011, A&A, 530, A149
- Yukita et al. (2007) Yukita, M., Swartz, D. A., Soria, R., & Tennant, A. F. 2007, ApJ, 664, 277
Appendix A XMM-Newton/Chandra Point Source Properties
We briefly summarize the XMM-Newton and Chandra properties for the NuSTAR identified point sources. Table 10 lists the count rates and luminosities in the 0.5–8.0 keV band using the 15′′ and 5′′ radius aperture for the XMM-Newton and Chandra data, respectively. Aperture correction has been applied. The background is obtained utilizing nearby source-free regions. The luminosities are estimated using a power law with a photon index =2. The variability is flagged if the source flux change more than 3 from the averaged value among the three epochs.
For the spectral analysis, we use the 0.5–8 keV energy band and applied two models, an absorbed power-law or an absorbed disk-blackbody model (XSPEC model diskbb; Mitsuda et al., 1984). The nuclear sources, x233 and x199, exhibit an excess of soft emission that could be due to hot gaseous emission from the nuclear starburst. Hence, we add an optically thin thermal plasma component (XSPEC apec; Smith et al., 2001) to obtain better fit statistics. The fitting results are tabulated in Table 11.
| Epoch 1 | Epoch 2 | Epoch 3 | |||||||
|---|---|---|---|---|---|---|---|---|---|
| Rate | log | Rate | log | Rate | log | ||||
| ID | (0.5–8.0 keV) | (0.5–8.0 keV) | (0.5–8.0 keV) | ||||||
| L14 | ( ct-1 s-1) | (1037 erg s-1) | ( ct-1 s-1) | (1037 erg s-1) | ( ct-1 s-1) | (1037 erg s-1) | variabilitya | ||
| x281 | 8.80.8 | 8.00.7 | 10.71.0 | 9.70.9 | 3.00.3 | 10.01.1 | |||
| x029 | 13.70.7 | 12.40.6 | 9.30.7 | 8.50.6 | 6.20.5 | 20.61.5 | v | ||
| x048 | 1.70.7 | 1.50.6 | 1.20.2 | 4.10.7 | |||||
| x073 | 4.30.7 | 4.00.7 | 1.40.2 | 4.70.8 | |||||
| x145 | 6.50.7 | 5.90.7 | 7.30.9 | 6.70.8 | 2.30.3 | 7.70.9 | |||
| x165 | 6.10.7 | 5.60.7 | |||||||
| x152 | 8.70.9 | 7.90.8 | 6.61.1 | 6.01.0 | 3.90.4 | 12.91.2 | v | ||
| x155 | 3.70.4 | 3.40.4 | 1.00.3 | 0.90.3 | |||||
| x185 | 28.91.1 | 26.31.0 | 11.10.6 | 36.62.0 | |||||
| x193 | 205.62.4 | 187.12.2 | 219.33.1 | 199.62.8 | 2.50.5 | 8.11.6 | |||
| x252 | 4.50.5 | 4.10.5 | 3.30.3 | 10.91.1 | |||||
| x246 | 21.41.3 | 19.51.1 | 41.01.7 | 37.31.6 | 0.90.2 | 3.00.7 | |||
| x233 | 321.02.9 | 292.12.6 | 312.23.8 | 284.13.4 | 12.41.0 | 40.83.4 | |||
| x248 | 29.71.0 | 27.01.0 | 24.61.4 | 22.41.2 | 8.90.6 | 29.11.8 | |||
| x258 | 8.20.7 | 7.50.6 | 2.80.3 | 9.31.0 | |||||
| x286 | 30.31.1 | 27.61.0 | 48.81.7 | 44.41.5 | 16.20.8 | 53.22.5 | v | ||
| x299 | 252.32.6 | 229.62.3 | 57.01.8 | 51.81.6 | 57.51.4 | 189.44.6 | v | ||
| x284 | 25.21.0 | 23.00.9 | 8.20.5 | 27.11.8 | |||||
| x321 | 28.51.1 | 25.91.0 | 35.11.5 | 32.01.3 | 10.20.6 | 33.72.0 | |||
| x366 | 4.60.8 | 4.20.7 | 2.00.3 | 6.60.9 | |||||
| x403 | 132.71.8 | 120.81.7 | 171.62.7 | 156.22.4 | 25.90.9 | 85.33.1 | v | ||
| log | Norm | |||||||||
|---|---|---|---|---|---|---|---|---|---|---|
| Name | / | Norm | (0.5–8.0 keV) | (gas) | ||||||
| ID | Epoch | Modela | (1021 cm-2) | /(keV) | (10-4) | C-stat/dof | (erg s-1) | (keV) | (10-4) | |
| x281 | 1 | PL | 294.6/347 | 38.0 | ||||||
| 1 | DB | 302.6/347 | 38.0 | |||||||
| 2 | PL | 216.1/275 | 38.0 | |||||||
| 2 | DB | 230.6/275 | 38.0 | |||||||
| x029 | 1 | PL | 351.4/468 | 38.4 | ||||||
| 1 | DB | 360.4/468 | 38.3 | |||||||
| 3 | PL | 337.3/509 | 38.1 | |||||||
| 3 | DB | 336.6/509 | 38.1 | |||||||
| x145 | 1 | PL | 309.5/384 | 38.3 | ||||||
| 1 | DB | 312.1/384 | 38.0 | |||||||
| x165 | 1 | PL | 274.9/325 | 37.9 | ||||||
| 1 | DB | 280.8/325 | 37.9 | |||||||
| x152 | 1 | PL | 302.4/365 | 38.1 | ||||||
| 1 | DB | 301.8/365 | 37.9 | |||||||
| x185 | 1 | PL | 479.8/629 | 38.6 | ||||||
| 1 | DB | 490.5/629 | 38.5 | |||||||
| 3 | PL | 371.9/509 | 38.5 | |||||||
| 3 | DB | 359.9/509 | 38.5 | |||||||
| x193 | 1 | PL | 649.9/685 | 39.2 | 0.43 | |||||
| 1 | DB | 0.4 | 742.1/685 | 39.0 | 0.75 | 0.49 | ||||
| 2 | PL | 503.7/588 | 39.2 | 0.45 | ||||||
| 2 | DB | 574.3/588 | 39.1 | 0.47 | ||||||
| 3 | PL | 0.4 | 280.1/507 | 38.2 | 0.75 | 0.08 | ||||
| 3 | DB | 0.4 | 282.9/507 | 38.2 | 0.75 | 0.21 | ||||
| x246 | 1 | PL | 491.3/517 | 38.3 | ||||||
| 1 | DB | 522.7/517 | 38.1 | |||||||
| 2 | PL | 511.4/498 | 38.6 | |||||||
| 2 | DB | 537.0/498 | 38.5 | |||||||
| x233 | 1 | PL | 815.8/884 | 39.4 | 0.39 | |||||
| 1 | DB | 1105.9/884 | 39.3 | 0.48 | ||||||
| 2 | PL | 663.0/741 | 39.4 | 0.39 | ||||||
| 2 | DB | 859.3/742 | 39.3 | 0.75 | 0.54 | |||||
| 3 | PL | 441.49/508 | 38.2 | 0.75 | 0.60 | |||||
| 3 | DB | 451.5/508 | 39.1 | 0.75 | 0.30 | |||||
| x248 | 1 | PL | 518.5/600 | 38.9 | ||||||
| 1 | DB | 508.3/600 | 38.6 | |||||||
| 2 | PL | 342.0/451 | 38.6 | |||||||
| 2 | DB | 342.7/451 | 38.4 | |||||||
| 3 | PL | 333.4/509 | 38.4 | |||||||
| 3 | DB | 325.7/509 | 38.3 | |||||||
| x258 | 1 | PL | 309.1/367 | 38.1 | ||||||
| 1 | DB | 312.3/367 | 38.2 | |||||||
| x286 | 1 | PL | 495.1/552 | 38.8 | ||||||
| 1 | DB | 483.1/552 | 38.6 | |||||||
| 2 | PL | 417.4/526 | 38.7 | |||||||
| 2 | DB | 404.3/526 | 38.6 | |||||||
| 3 | PL | 427.8/509 | 38.6 | |||||||
| 3 | DB | 417.1/509 | 38.6 | |||||||
| x299 | 1 | PL | 1182.0/1220 | 39.5 | ||||||
| 1 | DB | 1138.0/1220 | 39.4 | |||||||
| 2 | PL | 435.5/534 | 38.8 | |||||||
| 2 | DB | 416.6/534 | 38.6 | |||||||
| 3 | PL | 512.0/509 | 39.3 | |||||||
| 3 | DB | 501.9/509 | 39.3 | |||||||
| x284 | 1 | PL | 436.2/450 | 38.9 | ||||||
| 1 | DB | 416.2/450 | 38.4 | |||||||
| 3 | PL | 295.9/509 | 38.3 | |||||||
| 3 | DB | 284.8/509 | 38.3 | |||||||
| x321 | 1 | PL | 627.3/740 | 39.3 | ||||||
| 1 | DB | 618.0/740 | 38.8 | |||||||
| 2 | PL | 499.6/594 | 38.9 | |||||||
| 2 | DB | 477.0/594 | 38.6 | |||||||
| 3 | PL | 435.4/509 | 38.6 | |||||||
| 3 | DB | 429.8/509 | 38.6 | |||||||
| x403 | 1 | PL | 714.1/738 | 39.4 | ||||||
| 1 | DB | 762.4/738 | 39.1 | |||||||
| 2 | PL | 706.8/756 | 39.5 | |||||||
| 2 | DB | 753.0/756 | 39.4 | |||||||
| 3 | PL | 390.0/509 | 39.0 | |||||||
| 3 | DB | 392.1/509 | 38.9 |