∎
ETH Zurich, Stefano-Franscini-Platz 3, CH-8093 Zurich, Switzerland
22email: konstantin.melnikov@ifb.baug.ethz.ch
Micro-mechanical Failure Analysis of Wet Granular Matter
Abstract
We employ a novel fluid-particle model to study the shearing behavior of granular soils under different saturation levels, ranging from the dry material via the capillary bridge regime to higher saturation levels with percolating clusters. The full complexity of possible liquid morphologies Scheel et al (2008) is taken into account, implying the formation of isolated arbitrary-sized liquid clusters with individual Laplace pressures that evolve by liquid exchange via films on the grain surface Melnikov et al (2015). Liquid clusters can grow in size, shrink, merge and split, depending on local conditions, changes of accessible liquid and the pore space morphology determined by the granular phase. This phase is represented by a discrete particle model based on Contact Dynamics Brendel et al (2005), where capillary forces exerted from a liquid phase add to the motion of spherical particles. We study the macroscopic response of the system due to an external compression force at various liquid contents with the help of triaxial shear tests. Additionally, the change in liquid cluster distributions during the compression due to the deformation of the pore space is evaluated close to the critical load.
Keywords:
Wet granular material Triaxial shear test Contact dynamics Shear strength Liquid clusters1 Introduction
The presence of liquid is known to have a significant impact on the mechanical properties of granular materials Herminghaus (2005); Mitarai and Nori (2006). An illustrative example we know from our childhood are sand castles: while it is nearly impossible to build with dry sand, one can easily accomplish this task after mixing some water to it. However, if we keep on adding more water, from a certain saturation on, the structures collapse. Cohesion by capillary forces is the reason for the change in material behavior. After reaching a maximum at lower saturation Scheel et al (2008), cohesive forces slowly decrease until the gravitational load gets too large. The nature of this phenomenon can be studied by tracking the liquid distribution on the micro-scale. In the last years, advanced experimental tools like micro-tomography created this possibility and Scheel et al. found a rich variety of liquid cluster morphologies Scheel (2009); Scheel et al (2008) beyond the well-studied liquid bridge regime Mani et al (2012, 2013); Richefeu et al (2006); Scholtès et al (2009b). The number and the size of observed liquid clusters proved to strongly depend on the saturation level. Inspired by these findings, we developed a model that explicitly takes into account all possible liquid morphologies on the pore scale inside a random sphere packing Melnikov et al (2015). Better understanding of the impact of higher liquid content is crucial for solving a number of open problems including e.g. rainfall-induced slope failures or fluid motion in sheared granular systems.
Wet granulates at low saturation, i.e. being in the so-called pendular state, are well studied Gröger et al (2003); Mani et al (2012); Richefeu et al (2006); Scholtès et al (2009a, b). With regard to cohesion the fully saturated state resembles the dry one since all cohesive forces vanish. However intermediate states, as well as the evolution of liquid structures under imbibition and drainage are rarely addressed due to their complexity. Starting from our grain-scale model for arbitrary saturation Melnikov et al (2015), we now allow particles to move and introduce a coupling between fluid and particles. Our intention is to investigate the effect of higher saturation on the macroscopic behavior of the material and vice versa the effect of macroscopic deformations on the morphogenesis of the liquid body. To capture the effect of hydrostatic stress, triaxial shear tests are simulated at different initial saturation states Belheine et al (2009); Wang and Lade (2001).
First we give a short description of the model with respect to the used discrete particle method (DPM) of contact dynamics (CD), before we summarize the most important features of the implemented liquid structure and evolution model. Special attention is given to the coupling between fluid and particles. The numerical procedure is described in detail and the triaxial shear cell used for measuring macroscopic behavior is introduced. We discuss the macroscopic response of the granular material to external compression for different saturation levels and the respective observations of the liquid body before we summarize main results and draw conclusions in Sec. 4.
2 Fluid-Particle Model for Arbitrary Liquid Saturation
We focus on wet granular material at various saturation levels under triaxial compression. Consequently one has to consider a solid, liquid and gaseous phase in the model. We limit ourselves to granular material consisting of uni-sized spherical particles and simulate time evolution of the dense packing under external load by Contact Dynamics. For the liquid phase, we develop a grain-scale model, capable of resolving the liquid body by combinations of capillary bridges, menisci and fully saturated pores. This way we resolve local liquid clusters from the dry to the fully saturated state. However gas can be trapped inside of pores, that is considered as incompressible.
2.1 Solid Phase Model
The solid phase is modeled using a DPM based on Contact Dynamics (CD). Originally proposed by Moreau Moreau (1994); Brendel et al (2005), this method is particularly suited representing rigid frictional particle systems with high packing fractions but negligible particle elasticity. Hence Newton‘s equations of motion are integrated implicitly, considering a volume exclusion constraint to avoid overlap of particles. In such systems, the rearrangements of rigid, frictional particles exclusively determines the system’s behavior.
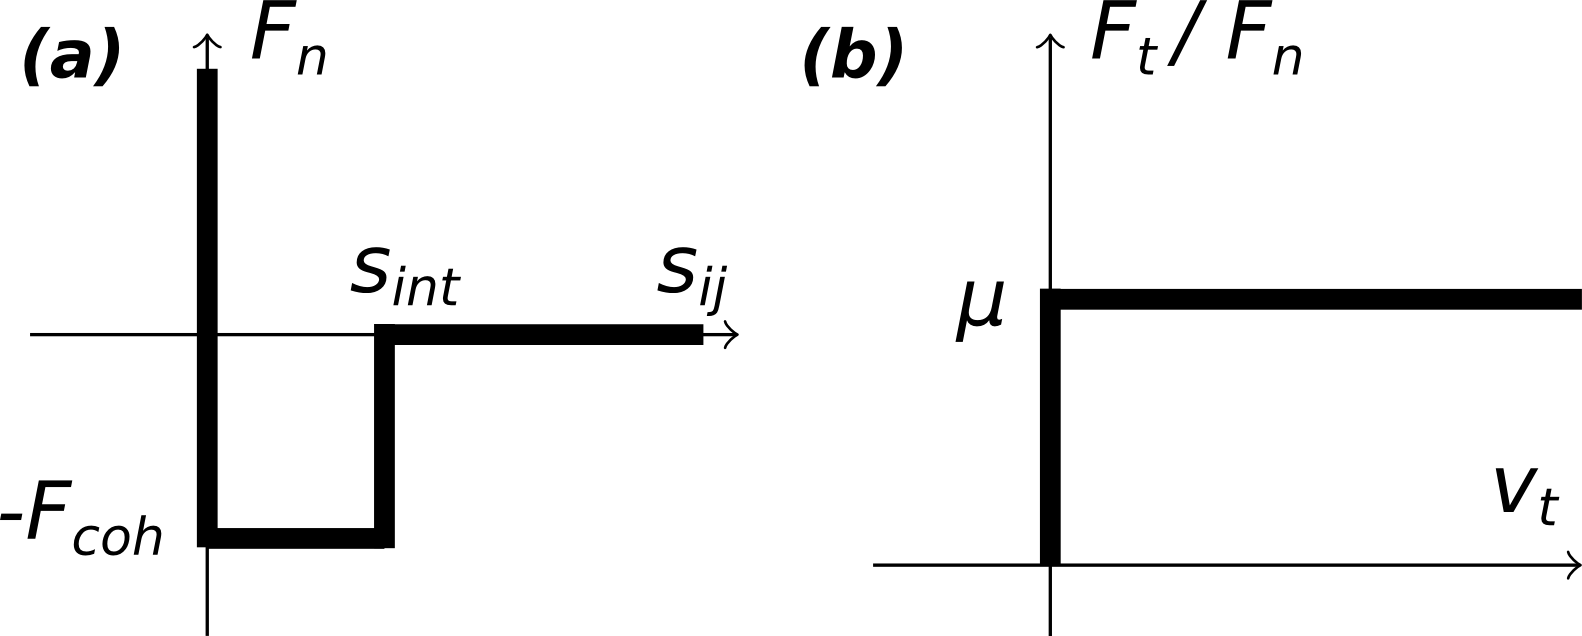
Each particle experiences a force that is composed of the contact forces with all contacting particles and the wall, a gravitational force , as well as forces from the liquid, that are described along with the considered liquid structures in Sec. 2.2.1. The essential difference between CD and soft particle methods is the strict volume exclusion constraint, where the normal force component can take arbitrary large positive values if the distance or gap between surfaces of particle and , to prevent interpenetration of surfaces (see Fig.1). Hence, in an iterative process the position of the particle must be found for which the normal force component of each active contact is minimal for all active contacts such that there is no overlap of particles at the next time step. When , the corresponding vanishes, unless attractive cohesive forces act in the normal direction, e.g. in a range . Sliding between particles is prevented if the tangential component of the contact force does not exceed the threshold given by the Coulomb friction coefficient : (see Fig. 1(b)). Note that the static friction coefficient is set equal to the dynamic one. The tangential force at the contact point and the resulting moment around the particle center lead to particle rotation.
In a dense packing, many particles are interacting in a force contact network. The contact forces acting on each particle are influenced by adjacent contact forces in the neighborhood, requiring a global solution of contact forces. The ones for a particle are described by a system of equations which can be approximately solved by an iterative algorithm on all particles in a random order. Over several iterations, the global contact force network relaxes towards a state where only minor changes occur. The calculated forces are then used to integrate the equations of motion by an implicit Euler method. The larger computational cost for the iterative force calculation is often outbalanced in CD by the possibility to use significantly larger time steps compared to soft particle dynamics.
2.2 Liquid Phase Model
From micro tomography experiments it is known, that liquid builds highly complex structures inside the granular material above the liquid bridge regime Scheel et al (2008). In order to simulate this behavior, we use a general model for liquid saturation which is able of resolving all possible liquid structures observed in experiments. In this section we give a short overview of this model, while the detailed description can be found in Ref. Melnikov et al (2015).
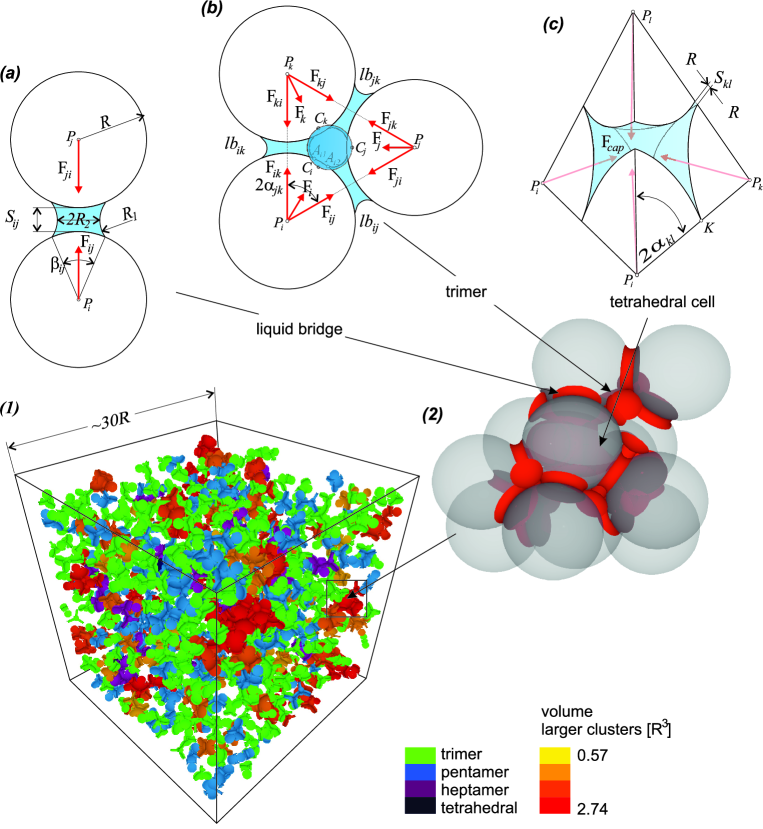
Based on the exact geometrical positions of the particles, the pore-throat network is constructed via Delaunay triangulation. The void space in each tetrahedral cell of the triangulation (see Fig. 2(c)) is called the pore body, while the cutting areas of the pore body with the respective faces of the cell form the four pore throats. Liquid clusters are represented as a combination of three types of elementary units: liquid bridges, menisci and entirely filled pore bodies. These elements can form higher geometrical configurations called liquid clusters. This evolution is determined by local instability criteria for imbibition and drainage.
2.2.1 Basic Liquid Structures
The elemental liquid structure involving two grains and of radius , is a liquid bridge (Fig. 2(a)). With their centers and , the inter-particle separation distance is given. In general, the pressure drop = across the liquid-gas interface with surface tension and curvature with the principal radii of curvature , is described by the Young-Laplace equation de Gennes et al (2003): . We interpolate the solution of this equation for liquid bridges from tabulated values by Semprebon et al. Mani et al (2015) obtained with a numerical energy minimization method (NEM) of the software Surface Evolver Brakke (1996) for a constant contact angle . With the liquid volume of the bridge , being a state variable, we interpolate , as well as the filling angle from the tables. The capillary force of the liquid bridge acting on particles and in the direction given by the unit vector from to is calculated via the experimentally found expression by Willett et al. Willett et al (2000)
| (1) |
Note that for contact () the capillary force is independent of , resulting in a constant force , provided and .
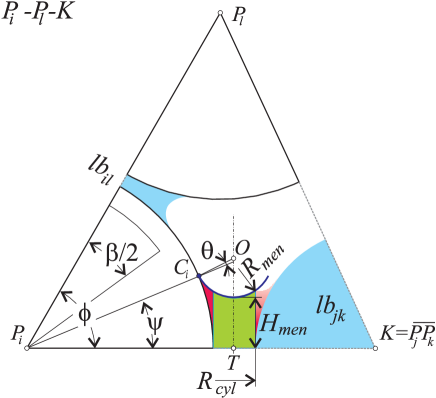
As soon as three particles with respective liquid bridges and are involved, the remaining pore throat can be filled, on condition that enough liquid is stored in the bridges, resulting in trimer formation (Fig. 2(b)). Based on ideas by Haines Haines (1927), we model the resulting liquid body of equal Laplace pressure by adding to the three bridges a fluid filled cylindrical pore throat that is located between the grains and limited by two menisci of spherical shape as liquid-gas interface (see section cut Fig. 3). The position of the meniscus center and its radius is calculated following the geometric construction proposed by Gladkikh Gladkikh (2005) with contact angle . and determine the fluid volume in the cylindrical pore throat of radius and height . denotes the contact point between meniscus and particle (see Figs. 2(b),3). The negative pressure drop across the meniscus is calculated using the Young-Laplace equation with the constant curvature . A capillary force from the meniscus acts on particles additionally to the forces from the liquid bridges. For simplicity, it acts in the direction given by the points (see Fig. 3) with the unit vector and is calculated as with the effective wetted area defined for example for particle by a triangle through the points -- (in Fig. 2).
With four particles, a tetrahedral cell can be formed, with the void space in the center being filled by a pore body. This pore body can be either connected to another filled pore body or it can be bounded by a meniscus through each of the four existing pore throats. In the latter case, the meniscus defines the Laplace pressure of the liquid phase inside the pore. The Laplace pressure drop leads to a capillary force component due to the wetted particle surface area inside the pore body. The resulting capillary force pulls each of the four particles towards the center of the pore as shown in Fig. 2(c). The respective wetted particle surface area is the surface of each particle inside the triangulation cell. If a liquid bridge between the corresponding particles exists, their wetted area is reduced in the calculation by the wetted area of the liquid bridge with opening angle . Note that in this case we do not correct the direction of the force and for simplicity keep it directed from the particle to the cell center. When particles are entirely immersed in liquid, forces from the pore body vanish, since the pressure inside the cluster is constant. When a tetrahedral cell contains four menisci, an incompressible gas bubble can be trapped.
The elementary units liquid bridge, meniscus, and filled pore body are the building blocks of local liquid clusters which can evolve inside the granular material (see Fig. 2(1-2)). Following the description of Scheel et al. Scheel et al (2008) for clusters without filled pore bodies, we call the smallest possible cluster trimer (three contacts, see Fig. 2b), the next one is a pentamer, heptamer and if more than 7 contacts are involved we simply call it cluster. The smallest cluster with a filled pore body is a tetrahedral cluster consisting of 6 associated liquid bridges and 4 menisci. We assume that pressure inside a each liquid cluster is constant, implying that all menisci have the same curvature. Pressure is calculated individually for each liquid cluster based on its volume Melnikov et al (2015), which is the control variable of the model. With imbibed pore bodies and menisci in a cluster
| (2) |
where denotes the volume of the imbibed pore body and the volume of the meniscus including its associated liquid bridges. The volume of the filled pore is calculated by subtracting the partial volumes of the four particles contained within the tetrahedral cell from the volume of this cell. The second component in the term accounts for the volumes of the liquid bridges associated with the meniscus :
| (3) |
The geometrical correction parameter describes the volume excess of a real meniscus with the connected liquid bridges, compared to our approximation in which underestimates the volume bounded by the meniscus (see Fig. 3 red area and Ref. Melnikov et al (2015)). Only half of each bridge volume is considered in the above formula since the other half is located in the opposite triangulation cell.
2.2.2 Evolution of Liquid Structures
Liquid structures can change due to relative particle movements or volume changes, for example through condensation or evaporation at gas-liquid interfaces or by local liquid sources or sinks. To take recent experimental observations into account Lukyanov et al (2012); Scheel et al (2008), we include transport via the liquid film on the particle surface. This transport occurs at low and intermediate saturations, where liquid exists in form of spatialy disconnected clusters. For stationary flow in the film, the volume flux into structure is proportional to the local Laplace pressure differences between liquid structures sharing at least one grain. If structures can be connected to the same grain, one obtains
| (4) |
with the dimensionless conductance coefficient that defines the equilibration time scale. In general should depend on details like distance between structures, the number of structures connected to the grain and others Mani et al (2015); Mani (2014). However for simplicity we set for all presented simulations (see Tab. 1). Particle movement, as well as flow from or into liquid structures can trigger local instabilities that propagate liquid interfaces inside the porous particle packing. This is consequently a discontinuous process with instantaneous jumps between stable configurations. Micro mechanically, these interface jumps are associated with drainage or imbibition of pore bodies or throats, or bridge rupture. We identified a set of seven geometrical criteria for instability, similar to Motealleh et al. Motealleh et al (2013) and Gladkikh Gladkikh (2005), with criteria i1-i4 for imbibition and d1-d3 for drainage:
Criterion i1: If two liquid bridges with filling angles touch each other, they can form a new trimer by filling the pore throat if sufficient liquid for a stable meniscus according to the drainage criterion d1 is available. With the opening angle (see Fig. 2(b)) it reads .
Criterion i2: If a meniscus in a tetrahedral cell touches a single liquid bridge, that was up to now not part of the liquid body, the pore body is filled. Hence the respective meniscus with the filling angle of the meniscus and the face-edge angle shown in Fig. 3 becomes unstable when .
Criterion i3: If the centers of two menisci inside one pore body touch, they build a single spherical interface and can fill the pore body (see Fig. 3), however with all four menisci formed, a gas bubble gets trapped.
Criterion i4: If a meniscus touches the opposite particle, the pore body is imbibed.
Criterion d1: Pore throats will drain if they reach a minimum size, expressed by the critical height of the menisci with the arbitrary drainage parameter . Best agreement with experimental data was found for Melnikov et al (2015).
Criterion d2: Pore bodies become unstable when the center of the meniscus of a neighboring cell touches the respective pore throat plane of an entirely saturated cell. Instantaneously the liquid interface jumps to a new stable position, leaving behind a drained pore body.
Criterion d3: Liquid bridges between particles and can rupture when the empirical expression derived by Willett et al. Willett et al (2000) for the rupture distance in units of the particle radius to the bridge volume is reached (see Fig. 2(a)). in combination with a zero distance for the formation of liquid bridges results in the hysteretic behavior of wet granular material. is sucked back to the surface of the holding particles and redistributed equally to their other contacts Mani et al (2013).
2.3 Numerical Procedure
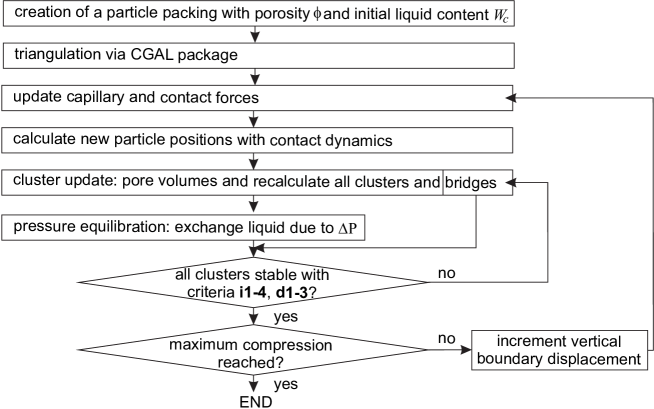
The different steps of the numerical procedure are schematized in Fig. 4, while a detailed description of the system construction and fluid calculation was previously published in Melnikov et al. Melnikov et al (2015). The initial packing, that is dynamically created via the DPM model (see Sec. 2.1) already allows for the introduction of an initial liquid content by assigning a liquid film to each particle, small enough to stay in the pendular regime Herminghaus (2005). When particles contact, liquid bridges are created that can rupture under criterion d3.We define the liquid content as total liquid volume normalized by the void volume : , where the void volume is calculated as the difference between the sample volume and the total volume of the grains . The porosity is defined as , where is the solid fraction given by the total volume of particles via . Before entering the simulation, the pore space is triangulated into tetrahedral cells using a Delaunay triangulation on particle centers Caroli and Teillaud (2015). To increase , liquid is condensed into already existing bridges, leading to formation of local clusters due to occurring instabilities. To avoid boundary effects with the wall, we suppress the formation of liquid structures at a distance from all walls. After addition of liquid to existing structures, we recalculate them such that the Laplace pressure corresponds to the changed volume. Before checking for instabilities, the liquid transport due to Laplace pressure gradients is calculated for the entire time increment, leading to equilibration of pressure differences. Then the instability criteria for imbibition i1-i4 and drainage d1-d3 are checked in ascending order. Identified instabilities are eliminated through drainage or imbibition as described in Sec. 2.2.2 and a cluster update is made before the time is incremented by . During the new time step, we first update particle positions through the DPM algorithm, and consecutively calculate the respective liquid body configuration as described above. To ensure conservation of the total liquid volume in the specimen, all liquid clusters are subsequently recalculated considering the changed volume of the pore bodies. Note, that in this paper we stick to small strains up to 4 to be able to retain the initial pore-throat network.
2.4 Triaxial Shear Test Model
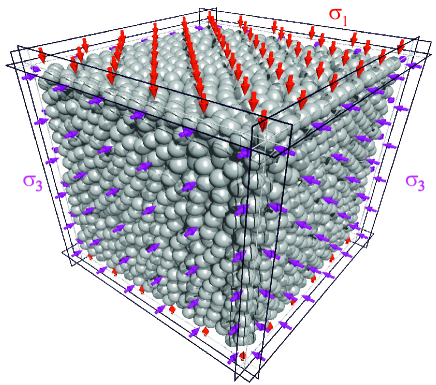
To study the shear strength of the wet granulate, we simulate triaxial shear tests that are a common tool in geotechnique for obtaining macroscopic systems responses Belheine et al (2009); Scholtès et al (2009b). The cubic sample contains randomly distributed particles of mass density , radius and hence particle mass . To randomize the particles, the solid fraction is kept low, and random velocities are assigned to the particles, before the sample is confined by a hydrostatic pressure on each cube walls of mass 2000. To obtain the desired solid fraction , friction is omitted, resulting in initial system dimensions of (see Fig. 5). Note that in CD overlaps are avoided. Hence no elastic energy is stored in overlaps, opposite to soft particle dynamics. The confining forces on each wall are calculated with the respective stress and the true area of the wall involved. and denote the confining pressures at the upper and side walls, respectively (see Fig. 5). For the compression with friction is switched on, and the mass of the bottom wall is set to infinity. The hydrostatic stress is applied on all movable walls before the upper wall of the cubic sample is lowered at a constant strain rate with the vertical displacement rate . The strain rate is chosen such that the assumption of quasi-static compression is satisfied, meaning that the response of the system for even lower strain rates would be the same. The unit of time is defined as meaning that for a simulation with the upper wall moves by a distance of during a time unit.
We calculate the differential stress by measuring the normal stresses on the upper and the side walls from the reaction forces of the particle contacts. The axial strain is calculated via . Note, that we use the absolute value in the above definition which implies that the axial strain during compression is positive. The volumetric strain is calculated as where is the volume change of the sample with respect to the initial volume .
| Solid phase: | ||
| 5000 | number of particles | |
| 1 | particle radius | |
| 1 | particle mass density | |
| 0.60 | solid fraction | |
| 0.001 - 0.01 | time step | |
| contact angle | ||
| 0.3 | friction coefficient | |
| Liquid phase: | ||
| 0.01 | conductance coefficient | |
| 0.07 | geometrical correction parameter | |
| 0.15 | drainage parameter for meniscus | |
| 1 | surface tension | |
3 Results of Wet Triaxial Shear Tests
To quantify the effect of liquid on the behavior of granular material under load, triaxial compression tests were simulated with increasing initial liquid content from dry (0%) up to 40% and at three distinct values of confining pressure is with the unit . Since no dimensional quantities are used in Contact Dynamics, a direct comparison with experimental data can be done by considering the ratio of inertial to confining forces proposed by Rognon et al. Rognon et al (2006): where is the confining pressure. In our simulations this number is equal to , and . Note, that these inertial numbers correspond to the quasi-static regime since our simulations show no changes if the strain rate is further reduced. The resolution of local liquid structures gives the opportunity to study the evolution of liquid clusters during compression. We are interested in micro-mechanical changes in terms of morphology distributions of the liquid body or morphogenesis of individual clusters due to deformation. Finally we quantify the dependence of macroscopic dilatation and limit surfaces upon the liquid content.
3.1 Liquid Cluster Evolution During Compression
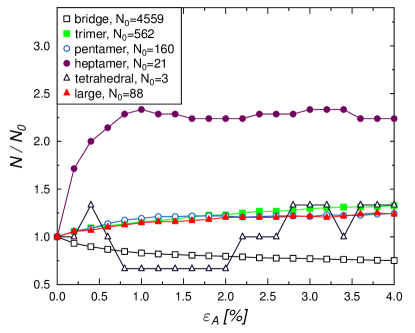
In particulate systems, shear typically results in dilatation, that can strongly effect the stability of the liquid body. For a sample with liquid content and confining pressure of we analyze the consequences of the compression on the distribution of liquid cluster morphologies from the single bridge up to large clusters. In Fig. 6 the relative change of the number of liquid cluster morphologies with respect to the stress-free state at (Fig. 2(1)) is given as function of the axial strain up to . The compression in one axial direction as considered in this study leads to the dilatation of the sample in directions perpendicular to this axis. A drop in solid fraction and increasing sample volume are the consequences. Since dilatation means increasing inter-particle distances, it is not surprising that isolated liquid bridges become less common with increasing strain due to bridge rupture. The liquid is used for the formation of new trimers and of other cluster morphologies like pentamers and large clusters. Because of the limited sample size with , the total number of larger cluster morphologies is consequently small, resulting in strong fluctuations for tetrahedral clusters and heptamers. Nevertheless, one can conclude that the pore space deformation triggers new instabilities that lead to trimer formation and consolidation of existing clusters into larger structures. This process is fueled by the liquid volume from existing liquid bridges as their number drops and from other existing structures by coalescence.
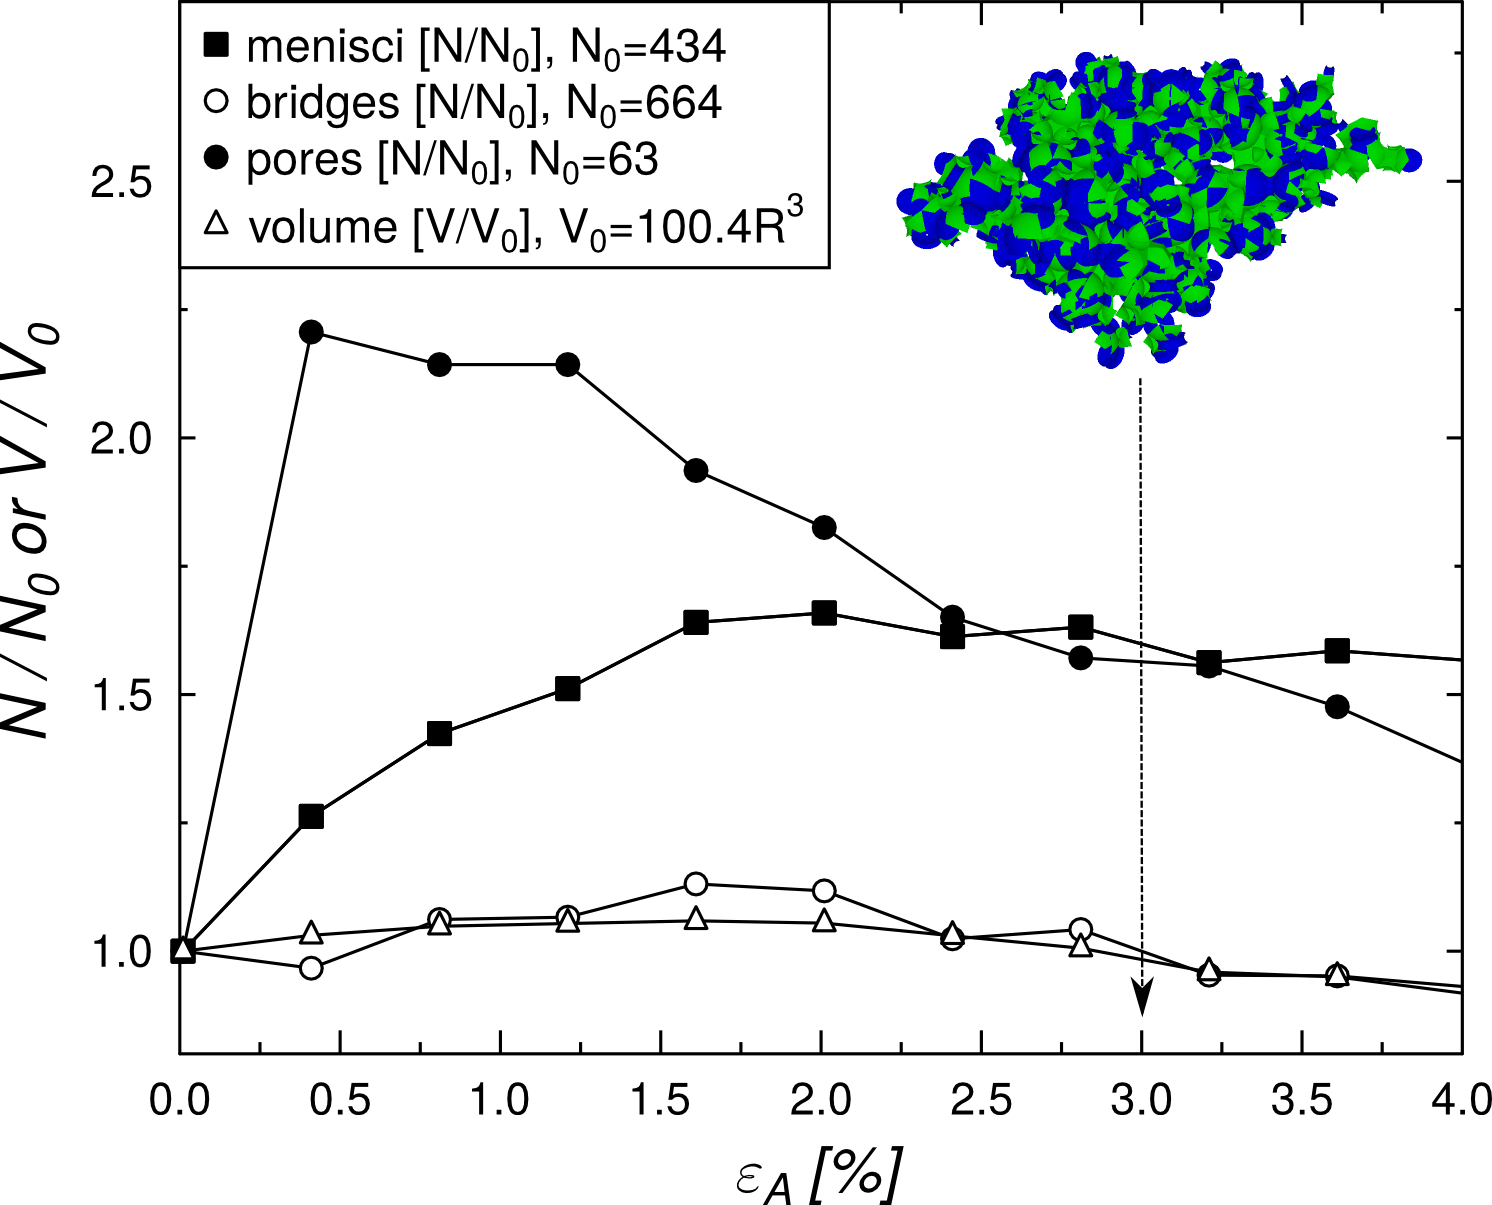
The deformation does not only have an effect on the statistics of liquid clusters. In particular for large deformations, parameters that characterize the cluster morphology evolve. We exemplify the morphogenesis of a single liquid cluster during the triaxial shear test (). While it remains rather isochoric with , there are changes in the number of individual units which constitute the cluster as the axial strain increases (see Fig. 7). This is observed for the number of individual units like menisci, liquid bridges and filled pore bodies (see Sec. 2.2.1). The axial compression leads to spreading of the cluster in the plane vertical to the axial load, which can be seen from the increasing number of menisci. The increasing number of menisci can be explained by the formation of new trimer units due to local instabilities or the incorporation of already existing trimers by the large cluster after contacting. Note, that although we take a look at a single cluster here, also other (smaller) clusters exist in the sample. The number of filled pore bodies and the number of liquid bridges decrease after reaching a local maximum due to increasing inter-particle distances from dilatation in directions that resulted in liquid bridge ruptures. The cluster evolves from a compact shape into a looser structure. The rapid increase of the number of menisci and filled pore bodies in the beginning (small strains ) does not result in a higher cluster volume because the Laplace pressure decreases when new pores are filled. A lower Laplace pressure leads to a decrease of menisci volumes since they move deeper into pore throats, see Fig.3.
3.2 Dependence of Limit Surfaces on Liquid Content
We previously referred to the role of the volumetric strain . Its dependence on the axial strain and confining pressure is shown in Fig. 8. We observe a decrease of with increasing , similar to Ref. Scholtès et al (2009a). A typical observation is that the spread between volumetric strain curves for different confining pressures increases with increasing axial strain. Note that the spontaneous increase of is a consequence of the Contact Dynamics approach. Comparable studies with the soft particle contact models exhibit a slight initial decrease of the sample volume due to the elasticity of the particles (see e.g. Ref Scholtès et al (2009b)).
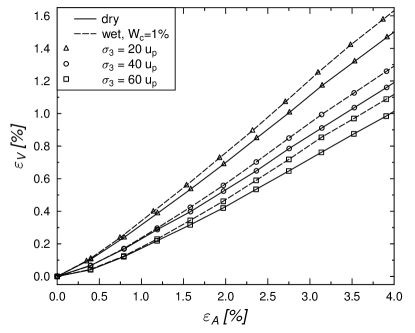
Attractive capillary forces hinder the spatial rearrangement of particles, resulting in a slightly higher volumetric strain for the wet sample (see Fig. 8).
During the compression, the differential stress is calculated as function of the axial strain . In Fig. 9 the stress-strain curve exhibits a rapid increase for small independent on the liquid content . This behavior is typical for a dense packing and in agreement with experimental Wang and Lade (2001) and numerical observations Belheine et al (2009); Scholtès et al (2009a). For larger strains, saturates and reaches a constant plateau, whose value depends on .
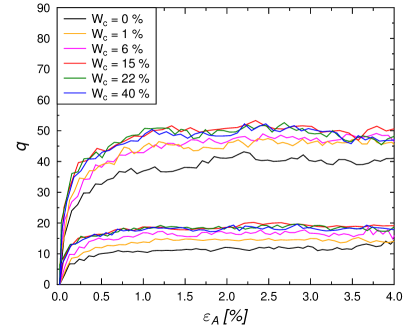
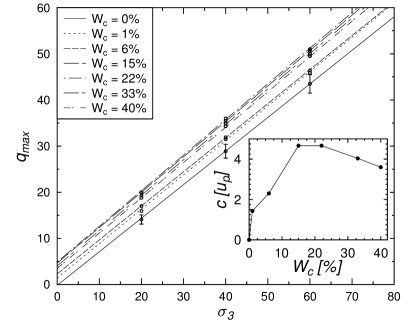
When monitoring the shear strength, or maximum in differential stress as function of the liquid content (see Fig. 9) at a single value of confining pressure, one can see a huge increase from the dry state to , corresponding to a pendular state where only liquid bridges exist. From there on, the gradient in shear strength with respect to liquid content quickly decays. Our data suggests a maximum in shear strength between , followed by a decay that in principle should reach the one of the dry state for . Shear strength versus confining pressure can be approximated by a straight line which goes through zero for the dry granular material (see Fig. 10). This behavior is well known Scholtès et al (2009b) and described by the Mohr-Coulomb failure criterion in the form
| (5) |
where is the shear strength, the internal friction coefficient, denotes the angle of internal friction and cohesion. The curves for wet material also show a linear trend, but with cohesion that results from the sum of capillary forces of all liquid bridges and clusters. When looking at the dependence of on the liquid content (see Fig. 10(inset)) it becomes evident that the increased shear strength is due to an increased cohesion and not to a change in . As a matter of fact proves to be independent on the liquid content within our statistical error bars at . The maximal increase in shear strength is about 5, independent on the confining pressures.
4 Summary and Conclusions
The described micro-mechanical model couples liquid structures to individual moving particles. For simplicity, the solid phase consists of spherical particles whose evolution in time and space is simulated with Contact Dynamics. For the liquid phase, the model incorporates rather complicated liquid structures observed in experiments which became feasible due to recent advances in the micro-tomography technique Scheel et al (2008). To ensure the conservation of mass, volume is chosen as the control variable in the model. The corresponding pressure is calculated separately for each liquid structure. The fluid-particle coupling induces cohesive forces exerted by the liquid structures on the holding particles. Note, that the present version of the model is limited to small strains up to 4-5 where an initial triangulation structure does not need to be updated. For higher strains the particle positions must be triangulated anew to provide a valid pore network. The proposed model was applied for the simulation of triaxial compression tests at different saturation levels. We could qualitatively reproduce results reported in both numerical and experimental studies, including the well-known Mohr-Coulomb failure criterion. Furthermore, shear tests well beyond the pendular regime were simulated. Due to the micro-mechanical approach, we were able to track and characterize the evolution of liquid structures inside the deforming granular material and to relate it to the deformation state. In the future we will extend the model to larger deformations.
Acknowledgements.
The research leading to these results has received funding from the People Programme (Marie Curie Actions) of the European Union’s Seventh Framework Programme FP7 under the MUMOLADE ITN project (Multiscale Modelling of Landslides and Debris Flow) with REA grant agreement n∘ 289911, as well as from the European Research Council Advanced Grant no. 319968-FlowCCS and the DFG under PiKo SPP 1486 HE 2732/11-3.References
- Belheine et al (2009) Belheine N, Plassiard JP, Donzé FV, Darve F, Seridi A (2009) Numerical simulation of drained triaxial test using 3D discrete element modeling. Computers and Geotechnics 36(1–2):320–331, DOI 10.1016/j.compgeo.2008.02.003
- Brakke (1996) Brakke K (1996) The surface evolver and the stability of liquid surfaces. Phil Trans R Soc A 354:2143–2157 DOI 10.1098/rsta.1996.0095
- Brendel et al (2005) Brendel L, Unger T, Wolf DE (2005) Contact Dynamics for Beginners, Wiley-VCH Verlag, pp 325–343. DOI 10.1002/352760362X.ch14
- Caroli and Teillaud (2015) Caroli M, Teillaud M (2015) {3D} Periodic Triangulations. In: {CGAL} User and Reference Manual, 4th edn, CGAL Editorial Board
- de Gennes et al (2003) de Gennes PG, Wyard FB, Quèrè D (2003) Capillary and wetting phenomena: bubbles, pearls, waves, Springer, pp 325–343
- Gladkikh (2005) Gladkikh M (2005) A Priori Prediction of Macroscopic Properties of Sedimentary Rocks Containing Two Immiscible Fluids. PhD thesis, University of Texas at Austin
- Gröger et al (2003) Gröger T, Tüzün U, Heyes DM (2003) Modelling and measuring of cohesion in wet granular materials. Powder Technology 133(1–3):203–215, DOI 10.1016/S0032-5910(03)00093-7
- Haines (1927) Haines WB (1927) Studies in the physical properties of soils: IV. A further contribution to the theory of capillary phenomena in soil. The Journal of Agricultural Science 17(02):264–290, DOI 10.1017/S0021859600018499
- Herminghaus (2005) Herminghaus S (2005) Dynamics of wet granular matter. Adv Phys 54(3):221–261, DOI 10.1080/00018730500167855
- Lukyanov et al (2012) Lukyanov AV, Sushchikh MM, Baines MJ, Theofanous TG (2012) Superfast Nonlinear Diffusion: Capillary Transport in Particulate Porous Media. Phys Rev Lett 109(21):214,501, DOI 10.1103/PhysRevLett.109.214501
- Mani et al (2012) Mani R, Kadau D, Or D, Herrmann HJ (2012) Fluid Depletion in Shear Bands. Phys Rev Lett 109(24):248,001, DOI 10.1103/PhysRevLett.109.248001
- Mani et al (2013) Mani R, Kadau D, Herrmann HJ (2013) Liquid migration in sheared unsaturated granular media. Granular Matter 15(4):447–454, DOI 10.1007/s10035-012-0387-3
- Mani et al (2015) Mani R, Semprebon C, Kadau D, Herrmann HJ, Brinkmann M, Herminghaus S (2015) Role of contact-angle hysteresis for fluid transport in wet granular matter. Phys Rev E 91(4):42,204, DOI 10.1103/PhysRevE.91.042204
- Mani (2014) Mani RA (2014) Capillary interactions, shear thickening and liquid migration in wet granular media. PhD thesis, ETH Zurich
- Melnikov et al (2015) Melnikov K, Mani R, Wittel FK, Thielmann M, Herrmann HJ (2015) Grain-scale modeling of arbitrary fluid saturation in random packings. Phys Rev E 92:022,206, DOI 10.1103/PhysRevE.92.022206
- Mitarai and Nori (2006) Mitarai N, Nori F (2006) Wet granular materials. Adv Phys 55(1-2):1–45, DOI 10.1080/00018730600626065
- Moreau (1994) Moreau JJ (1994) Some numerical methods in multibody dynamics: application to granular materials. European journal of mechanics A Solids 13:93–114
- Motealleh et al (2013) Motealleh S, Ashouripashaki M, DiCarlo D, Bryant S (2013) Unified Model of Drainage and Imbibition in 3D Fractionally Wet Porous Media. Transport in Porous Media 99(3):581–611, DOI 10.1007/s11242-013-0201-7
- Richefeu et al (2006) Richefeu V, El Youssoufi MS, Radjaï F (2006) Shear strength properties of wet granular materials. Phys Rev E 73(5):51,304, DOI 10.1103/PhysRevE.73.051304
- Rognon et al (2006) Rognon PG, Roux JN, Wolf D, Naaïm M, Chevoir F (2006) Rheophysics of cohesive granular materials. EPL (Europhysics Letters) 74(4):644
- Scheel (2009) Scheel M (2009) Experimental investigations of the mechanical properties of wet granular matter. PhD thesis, Georg-August-Universitaet Goettingen
- Scheel et al (2008) Scheel M, Seemann R, Brinkmann M, Michiel MD, Sheppard A, Breidenbach B, Herminghaus S (2008) Morphological clues to wet granular pile stability. Nat Mater 7(3):189–193, DOI 10.1038/nmat2117
- Scholtès et al (2009a) Scholtès L, Chareyre B, Nicot F, Darve F (2009a) Micromechanics of granular materials with capillary effects. International Journal of Engineering Science 47(11-12):1460–1471, DOI 10.1016/j.ijengsci.2009.10.003
- Scholtès et al (2009b) Scholtès L, Hicher PY, Nicot F, Chareyre B, Darve F (2009b) On the capillary stress tensor in wet granular materials. International Journal for Numerical and Analytical Methods in Geomechanics 33(10):1289–1313, DOI 10.1002/nag.767
- Wang and Lade (2001) Wang Q, Lade PV (2001) Shear Banding in True Triaxial Tests and Its Effect on Failure in Sand. J Eng Mech 127(8):754–761, DOI 10.1061/(ASCE)0733-9399(2001)127:8(754)
- Willett et al (2000) Willett CD, Adams MJ, Johnson SA, Seville JPK (2000) Capillary Bridges between Two Spherical Bodies. Langmuir 16(24):9396–9405, DOI 10.1021/la000657y