Determining the radio AGN contribution to the radio–FIR correlation using the black hole fundamental plane relation
Abstract
We investigate the 1.4 GHz radio properties of 92 nearby () ultra hard X-ray selected Active Galactic Nuclei (AGN) from the Swift Burst Alert Telescope (BAT) sample. Through the ultra hard X-ray selection we minimise the biases against obscured or Compton-thick AGN as well as confusion with emission derived from star formation that typically affect AGN samples selected from the UV, optical and infrared wavelengths. We find that all the objects in our sample of nearby, ultra-hard X-ray selected AGN are radio quiet; 83% of the objects are classed as high-excitation galaxies (HEGs) and 17% as low-excitation galaxies (LEGs). While these low- BAT sources follow the radio–far-infrared correlation in a similar fashion to star forming galaxies, our analysis finds that there is still significant AGN contribution in the observed radio emission from these radio quiet AGN. In fact, the majority of our BAT sample occupy the same X-ray–radio fundamental plane as have been observed in other samples, which include radio loud AGN —evidence that the observed radio emission (albeit weak) is connected to the AGN accretion mechanism, rather than star formation.
keywords:
galaxies: active, galaxies: Seyfert, galaxies: evolution, X-rays: galaxies, radio continuum: galaxies1 Introduction
Much progress has been made towards understanding the co-evolution of central supermassive black holes (SMBHs) and their host galaxies in both theoretical simulations (e.g. Sesana et al., 2014; Hopkins et al., 2015) and observations (e.g. Kormendy & Ho, 2013; Heckman & Best, 2014). Recently, it is becoming apparent that SMBHs (like their host galaxies) follow two distinct evolutionary modes: (1) one that exhibits a high excitation and high efficiency accretion; and (2) another with a low excitation and low efficiency accretion (Hopkins et al., 2014; Gatti et al., 2015; Menci et al., 2014). The accreting SMBHs at the centre of galaxies are known as Active Galactic Nuclei (AGN).
While much overlap exists between samples, the AGN populations identified through soft X-rays, ultraviolet (UV )/optical, mid-infrared (MIR) and radio observations result in largely distinct samples. This is largely due to the different origin of the observed emission, dust obscuration and orientation of the AGN with respect to the observer’s line-of-sight (e.g. Antonucci, 1993; Urry & Padovani, 1995). Typically, soft X-ray- and UV/optical- selected samples of AGN are biased against obscured AGN (Mushotzky, 2004), while strong MIR emission can be confused with emission from star formation (Stern et al., 2005; Hickox et al., 2009). Emission at the shorter wavelengths (soft X-ray and UV/optical) originate from regions closer to the central SMBHs (corona and/or the accretion disk), while the dominant source of MIR emission is the dusty torus (e.g. Manners et al., 2002).
Griffith & Stern (2010) studied a sample of radio-, X-ray, and MIR-selected AGN identified within the COSMOS survey. Though the soft X-ray selection is biased against obscured AGN, the MIR and radio selection is less biased against obscured AGN. From this sample of mostly unobscured AGN, the optical brightness appears to scale with that observed in the X-ray and MIR wavelengths—suggestive that the X-ray- and mid-IR-selected AGNs have high Eddington ratios, similar to those of optically-selected AGN. On the other hand, the radio brightness of radio-selected AGN are not typically correlated with their optical brightness. Many low power radio-selected AGN do not exhibit narrow emission lines in the optical wevelengths (Laing et al., 1994; Jackson & Rawlings, 1997); can lack the IR emission from a dusty torus (Whysong & Antonucci, 2004; Ogle et al., 2006); and may not show accretion-related X-ray emission (Hardcastle et al., 2006; Evans et al., 2006). Hence, it is generally thought that radio-selected AGN represents a SMBH growth mode that involves accretion mechanism(s) with a lower and wider range of Eddington ratios (Hickox et al., 2009; Griffith & Stern, 2010; Schawinski et al., 2015).
On the other hand, the radio and X-ray emission from luminous radio-selected AGN have long been understood to be closely-linked due to the assumed coupling between the accretion disk and the occasional presence of radio outflows —as described by the black hole “fundamental plane” correlation (Merloni et al., 2003; Falcke et al., 2004) observed between the X-ray luminosities (), radio luminosities () and the mass of the SMBH. With few exceptions (Coriat et al., 2011; Burlon et al., 2013; Panessa & Giroletti, 2013; Dong et al., 2014), this correlation holds for radio loud AGN on scales of parsecs (e.g. Merloni et al., 2003) to kiloparsecs (Panessa et al., 2015) as well as accreting stellar mass black holes (as in the case of X-ray binaries). Therefore, how does the black hole “fundamental plane” correlation fit into the current paradigm of bimodality in AGN samples?
To investigate the physical mechanisms that are driving the observed emission at X-ray and radio wavelengths, we study a sample of nearby ultra hard X-ray selected Seyfert AGN from the Swift BAT survey ( keV) compiled by Koss et al. (2011a) (hereafter known as the K11 sample). While a hard X-ray selection from emission observed at 2–10 keV is sufficient at revealing hidden or obscured narrow-line AGN (e.g. Ueda et al., 2007), an ultra hard X-ray selection at energies greater than 15 keV will reveal even Compton-thick sources (with obscuring column densities cm-2) and provide a more complete census of the AGN population. At the ultra hard energy bands keV, we also avoid any possible emission contribution from star formation.
The radio observations in this paper are obtained from two large surveys at 1.4 GHz using the Very Large Array located in New Mexico: 1) the Faint Images of the Radio Sky at Twenty-centimeters (FIRST; Becker et al., 1995; White et al., 1997) survey; and 2) the NRAO VLA Sky Survey (NVSS; Condon et al., 1998). The 1.4 GHz observations will be analysed in combination with the X-ray and far-infrared properties of the host galaxy in order to shed light on the radio properties (and origin) of a more complete sample of low-redshift AGN. However, we do not include beamed AGN such as blazars in our sample because we are interested in studying the co-evolution between the host galaxy and its accreting central SMBH.
We describe our ultra hard X-ray selected sample of nearby AGN from the Swift BAT survey in Section 2.1. Section 2.2 describes the complementary 1.4 GHz radio observations used in this paper. Section 3 presents the 1.4 GHz radio properties of the K11 objects which reside in the surveyed regions of FIRST. Section 4.1 examines the relationship between the 1.4 GHz and X-ray properties of our BAT sample in the context of the black hole “fundamental plane”. We discuss the implications of our findings in Section 4.2. A summary of our results and conclusions can be found in Section 5.
2 Sample and observations
2.1 The nearby Swift BAT ultra hard X-ray AGN sample
The Burst Alert Telescope (BAT) instrument on board the Swift satellite telescope has conducted an all-sky survey in the ultra hard X-ray wavelengths, keV (Tueller et al., 2010). As the position error of the BAT observations is large (′; Koss et al., 2011a), higher resolution X-ray observations have been obtained for nearly every source using the Swift X-ray Telescope (XRT) instrument (Burrows et al., 2005). To investigate the co-evolution of AGN and their host galaxies, Koss et al. (2011a) selected 183 nearby AGN that reside at . Beamed AGN such as blazars have been specifically excluded from this sample.
2.2 Complementary 1.4 GHz observations
In this paper, we study the 1.4 GHz properties of the K11 sample primarily using the observations from the Faint Images of the Radio Sky at Twenty Centimeters (FIRST; Becker et al., 1995; White et al., 1997) survey111http://sundog.stsci.edu/ covering square degrees of the Northern sky down to a 1 noise level of 150 Jy beam-1 at 5″ angular resolution. We also compare the results from FIRST to the larger NRAO VLA Sky survey (NVSS; Condon et al., 1998) which uses the VLA in a different array configuration.
The FIRST survey was selected as the primary source of the 1.4 GHz observations because the angular resolution afforded by FIRST is more consistent with observations at shorter wavelengths and minimises confusion in the cross-identification of sources. The angular resolution of FIRST is a factor of 9 smaller than that obtained by NVSS. While NVSS covers a larger area of sky than FIRST, NVSS is relatively shallow and has a 50% completeness level at 2.5 mJy beam-1 and an angular resolution of 45″ (Condon et al., 1998). The trade-off with greater angular resolution in interferometric observations is the likelihood of resolving out the larger angular scale diffused emission. While NVSS is unable to distinguish between multiple radio sources which are closer than 50″ in separation, extended NVSS sources would be resolved into several radio components by FIRST where the total flux of all components is less than a single extended Gaussian component (White et al., 1997).
Due to these complications in comparing the flux densities between the FIRST and NVSS surveys, we use the measurements from both the FIRST and NVSS surveys in Section 4 to ensure that the results found in this paper are not biased by the technical aspects of radio interferometry.
3 Radio 1.4 GHz properties of the Swift BAT sample
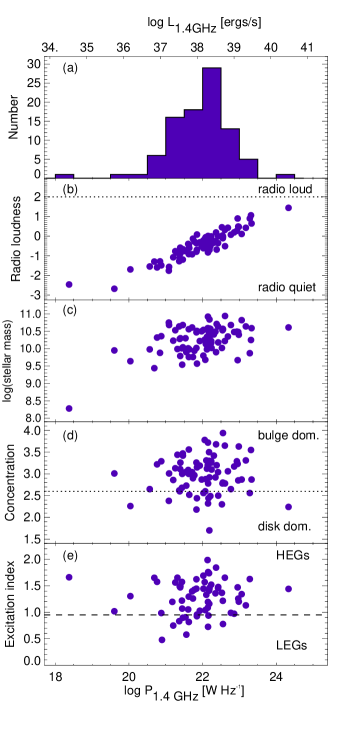
Of the 183 BAT nearby AGN from Koss et al. (2011a), we find 108 sources that are located in regions observed by the FIRST 1.4 GHz radio survey (Becker et al., 1995). The 1.4 GHz flux measurements for our sample are obtained from the FIRST catalogue (White et al., 1997)222The FIRST catalogue is available online at http://sundog.stsci.edu/cgi-bin/searchfirst. Table LABEL:genprop lists the properties of these 108 BAT-selected sources. Figure 1a shows the distribution of 1.4 GHz radio luminosity densities () of the nearby Swift BAT AGN sample. With the exception of Mrk 463, the K11 sample detected by FIRST have 1.4 GHz luminosity densities below W Hz-1333A luminosity density, W Hz-1 corresponds to a monochromatic radio luminosity, of ergs s-1.. Previous radio source population studies at 1.4 GHz have found that sources with 1.4 GHz luminosities greater than W Hz-1 are most likely from AGN, whereas 1.4 GHz luminosities below W Hz-1 consist of radio emission from both AGN and star-forming galaxies (e.g. Rosario et al., 2013; Condon et al., 2012; Kimball et al., 2011; Mauch & Sadler, 2007).
The radio loudness of a source can be defined using the radio loudness parameter, (Ivezić et al., 2002):
| (1) |
where and represents the -band and 1.4 GHz radio magnitude in the AB-magnitude system, respectively. The AB radio magnitude where represents the integrated flux from FIRST (Ivezić et al., 2002). A radio source is considered radio-loud where . The observed correlation between and is not surprising due to the presence of the radio flux measurements in both parameters. We find that the ultra hard X-ray selection of the K11 sample consists of radio-quiet galaxies (see Figure 1b).
For the 16 K11 sources which have not been detected by the FIRST survey, we stacked all 16 non-detections and found an average W Hz-1 ( ergs s-1). We find that on average, the radio luminosity densities of our sample do not correlate with the stellar mass nor the structural concentration of the host galaxies (panels c and d of Figure 1). A bulge-dominated galaxy is described by concentration indices greater than 2.6, while disk-dominated galaxies is described by concentration indices below 2.6 (Strateva et al., 2001).
A hard X-ray AGN selection selects for AGN which straddle the division between high-excitation- and low-excitation- galaxies; also known as HEGs and LEGs (e.g. Hardcastle et al., 2007). While HEGs dominate at radio luminosity densities above W Hz-1 ( ergs s-1), both HEGS and LEGS are found at lower luminosity densities. LEGs are also typically associated with early-type galaxies. Conversely, HEGs can be hosted by late-type galaxies with younger stellar populations and have high Eddington ratios. Optical spectroscopic measurements of emission lines are obtained from Koss et al. (2011a) and from SDSS DR10 (for the K11 sample with FIRST detections) in order to determine the distribution of excitation indices in our hard X-ray selected sample of nearby AGN. The excitation index () is parameterised from six optical emission lines as follows (Buttiglione et al., 2010; Best & Heckman, 2012):
| (2) |
Recent studies by Best & Heckman (2012) found that LEGs typically have while HEGs have . Following this definition, we find that only 17% of our sample have excitation indices that are consistent with LEGs, with the remaining sample consisting of HEGs (Figure 1e).
3.1 Compact radio sources
With the advent of the current generation of large area radio continuum surveys such as NVSS (Condon et al., 1998), FIRST (Becker et al., 1995) and WENSS (Rengelink et al., 1997) in the Northern hemisphere and SUMSS (Bock et al., 1999; Mauch et al., 2003) in the Southern hemisphere; it is now commonly understood that the most luminous radio sources in the Universe are powered by AGN. However at low luminosity densities, we see an increase in radio emission contribution from star-forming galaxies to the radio luminosity function (e.g. Condon, 1989; Mauch & Sadler, 2007; Prescott et al., 2016).
The vast majority (93.4%) of the nearby Swift BAT AGN have been found by the FIRST survey to be compact radio sources in addition to being radio-quiet. Therefore, is the radio emission originating from the star formation, or the AGN, or a combination of both (Condon, 1992; Haarsma et al., 2000; Kimball et al., 2011; Condon et al., 2013)?
To further investigate the radio emission origin in this ultra hard X-ray selected sample, we begin by examining this sample in the context of the radio–FIR correlation—a correlation often used to calibrate and determine the star formation rates of galaxies (Van der Kruit, 1971; Helou et al., 1985; Condon & Broderick, 1988; Yun et al., 2001). It is often thought that this correlation is a reflection of the star formation process because the far-infrared emission at 60-to-250 m is typically dominated by emission from star formation processes (e.g. Yun et al., 2001; Bell, 2003). The infrared emission arising from AGN typically originates from the AGN torus that is composed of hot dust at temperatures of – K (close to the sublimation temperatures of silicate and graphite grains), which results in emission that peaks in the mid-infrared (7–30 m) wavelengths (Rodríguez-Ardila & Mazzalay, 2006; Elitzur, 2006; Schartmann et al., 2005).
We calculate the 60 m luminosities following the calibration from Yun et al. (2001) where log and the 60 m fluxes () are from the IRAS Faint Source Catalog (Moshir & et al., 1990). Figure 2 shows that our sample is largely consistent with the radio–FIR correlation found by Yun et al. (2001) (represented by the solid black line).
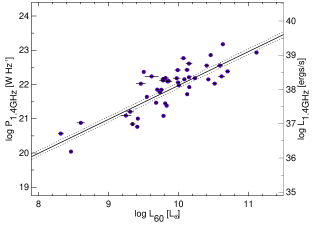
We would not have naively expected the FIR emission to correlate with the 1.4 GHz radio emission if the AGN is contributing solely to the observed radio emission because the FIR emission of AGN and non-AGN galaxies are relatively similar. Recent results have verified indeed that it is not possible to distinguish between AGN and non-AGN galaxies solely from the far-infrared emission at 60-to-250 m (Hatziminaoglou et al., 2010) and the addition of mid-infrared observations is crucial for the identification of the AGN population (Hatziminaoglou et al., 2010; Manners et al., 2002). Therefore, to further investigate the AGN origin of the observed radio emission, we compare the slope of the radio–FIR correlation with the far-infrared spectral index between 25 m and 60 m (a proxy for the dust temperature within the galaxy).
The slope of the radio–FIR correlation is parameterised as (e.g. Helou et al., 1985; Condon et al., 2002):
| (3) |
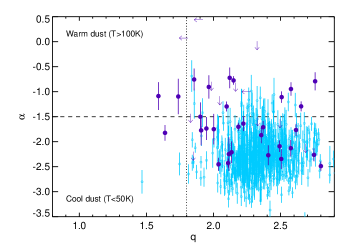
where the FIR flux between 42.5 m and 122.5 m, [W m; and and are the observed flux densities at 60 m and 100 m (in units of Jansky). Following the methodology of Mauch & Sadler (2007), we calculate the far-infrared spectral index as (e.g. Condon et al., 2002; Mauch & Sadler, 2007). Figure 3 compares the distribution of values as a function of the parameters for our BAT sample (purple solid points) to those of a low redshift sample of star-forming galaxies. Similar to Figure 2, the uncertainties in the 1.4 GHz measurements are smaller than the data points shown in Figure 3.
While the distribution of parameters for our sample appear similar to that of star-forming galaxies, we do find a significant fraction of the nearby BAT AGN that appear to have warmer dust temperatures (flatter FIR spectral indices, ) as well as lower values than are typical for star-forming galaxies (small blue circles). The Kolmogorov-Smirnov test is used to compare the distribution of and values that we obtained for the compact objects in our BAT sample to those of star forming galaxies from Mauch & Sadler (2007). We find low probability values of and (for the and values, respectively), meaning that the distributions for the BAT sample and that of star forming galaxies do not arise from the same parent distribution. Therefore, from the comparison of and values, it is statistically unlikely for the radio and FIR emission of our sample to be due solely to star formation within the host galaxy.
So why is our sample largely consistent with the radio–FIR correlation even though the radio emission of our sample is unlikely to have a star formation origin? One likely explanation for this is that while our radio emission may be dominated by the compact core AGN emission; the 60 m measurements probably include emission from star formation that is occuring beyond the cores of our sample galaxies, as the native angular resolution from IRAS is a few arcminutes in size (Moshir & et al., 1990). Hence, the main conclusion from this section is that the origin of the 1.4 GHz radio emission is likely to include a significant AGN contribution even though our sample is largely consistent with the radio–FIR correlation. We further investigate the AGN origin of our radio-quiet K11 sample in the context of the black hole fundamental plane relationship in Section 4.1
3.2 Extended radio sources
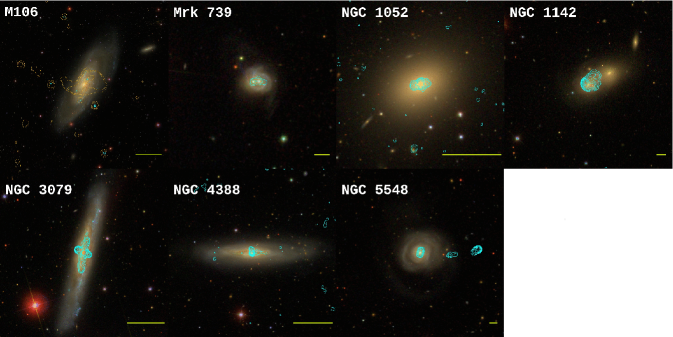
We find seven BAT sources with extended radio morphologies. Figure 4 presents the radio and optical maps of the K11 sample with extended radio emission. With the exception of M 106, the extended radio morphologies for the remaining six BAT sources exhibit characteristics consistent with being AGN-driven radio outflows. The extended radio emission in NGC 1052 appears to be bipolar radio jets emanating from the central AGN. In the cases of NGC 3079 and NGC 4388, the extended radio emission shows orthogonal radio jets as well as star formation within the disks of the galaxies. Due to our proximity to M 106, we observe extended radio emission due to star formation from within the galaxy disk.
Mrk 739 is a rare binary AGN (Koss et al., 2011b; Teng et al., 2012) and consist of Mrk 739E (the eastern core) and Mrk 739W (the western core). Mrk 739E has high Eddington ratio and is accreting efficiently, while, Mrk 739W only shows evidence for an AGN in hard X-ray observations as it has very low [OIII] optical line emission. It is possible that the extended radio emission observed to the west of Mrk 739W is due to the inefficiently-accreting AGN in Mrk 739W.
Due to the face-on nature of NGC 5548 and the projected proximity to a pair of unrelated radio sources, it is unclear whether the observed extended emission within the core of the galaxy is due to star formation or the central supermassive black hole. While not explicitly a merger, this galaxy does show signs of previous interactions (as exemplified by the long tidal tail).
4 Discussion
4.1 The radio–X-ray “fundamental plane” for weak radio AGN
We have shown in Section 3.1 that the radio and FIR properties of our radio quiet K11 sample is statistically distinct from that of star-forming galaxies even though a large number of BAT sources appear to follow the radio–FIR correlation that is typically populated by star-forming galaxies. The radio–X-ray “fundamental plane” correlation infers a scale invariant coupling between the accretion of matter onto a black hole and the observed radio synchrotron emission, often in the form of a radio jet. Therefore we hypothesise that the K11 sample of radio quiet AGN is likely to follow the radio–X-ray ‘fundamental plane’ relationship (e.g. Merloni et al., 2003; Falcke et al., 2004; Panessa et al., 2015) if the observed radio emission is due to an accreting supermassive black hole rather than star formation from within the host galaxy.
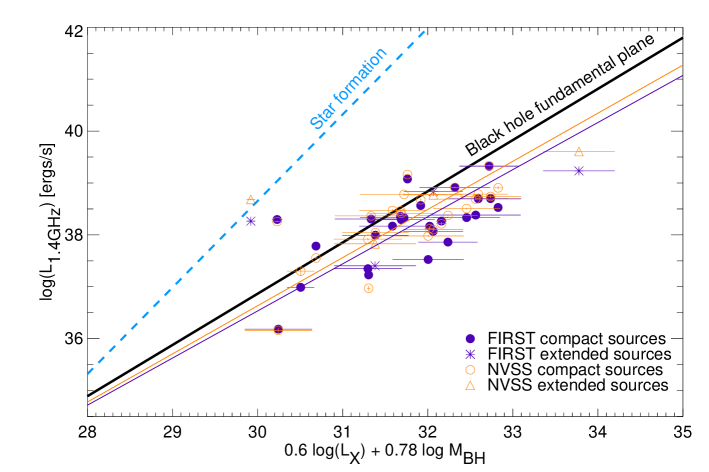
Figure 5 shows the radio–X-ray ‘fundamental plane’ relationship as described by Merloni et al. (2003) as the thick solid black line. We represent the FIRST measurements of the compact and extended radio sources as purple solid points and purple asterisks, respectively. In addition, the NVSS measurements of the same compact and extended radio sources are represented by the orange open circles and orange triangles, respectively. We use the 1.4 GHz measurements from both the FIRST and NVSS surveys to rule out the potential for the underestimation of diffused radio emission from the FIRST observations.
The black hole masses for our sample are determined using the central stellar velocity dispersion and single epoch broad line H measurements (Koss & et al., 2016). The measurements assumed the the M- relation from Kormendy & Ho (2013). For broad line sources, we estimate the black hole masses using an H fitting routine which includes the fitting of the Fe II lines on the red wing as well as [O III] (=4959Å) as described by Trakhtenbrot & Netzer (2012). In addition, the 15–195 keV emission from the Swift BAT observations were scaled by a factor of 2.67 to X-ray luminosities expected at 2–10 keV (Rigby et al., 2009).
To determine the expected correlation between the radio and X-ray emission for galaxies whose emission is entirely dominated by the star formation process, we assume a zero black hole mass. The blue dashed line in Figure 5 represents the relationship that we would expect from a purely star-forming galaxy without a central supermassive black hole. The X-ray luminosity to star formation rate calibration from Mineo et al. (2014) and Bell (2003) is used to estimate the blue dashed line in Figure 5.
As can be seen from Figure 5, the radio–X-ray ‘fundamental plane’ relationship provides a useful diagnostic for differentiating between the radio emission that originates from black hole activity and that from star formation. This is especially the case for the K11 sample where the radio emission in a majority of our sample is consistent with that expected from an accreting supermassive black hole. The purple and orange thin solid lines in Figure 5 are ordinary least squares bisector fits to the observed measurements from the FIRST and NVSS surveys, respectively. The residual dispersions of these fits are 0.84 dex and 0.78 dex for the FIRST and NVSS measurements, respectively. While the fits to our sample (as shown by the purple and orange lines in Figure 5) appear to be offset from the ‘fundamental plane’ relationship as described by Merloni et al. (2003), we note that this offset is not statistically significant as the relationship described by Merloni et al. (2003) lies within the uncertainties of our fits.
The two largest outliers to the ‘fundamental plane’ are NGC 3079 and Mrk 766. NGC 3079 has an extended radio morphology which includes radio emission from its star forming disk for which we have not subtracted. Mrk 766 is a narrow line Seyfert 1 AGN hosted by a nearby star forming spiral galaxy where a 60 parsec extended radio outflow have been previously observed at 3.6 cm by Ulvestad et al. (1995). Similar to NGC 3079, the synchrotron emission from star formation within Mrk 766 is likely to dominate the observed 1.4 GHz emission even though a radio jet is present. In addition to greater uncertainties in the measurements of diffused radio emission (White et al., 1997), it is also known that the connection to the radio jet emission mechanism may depend on timescale and observed radio frequency (Burlon et al., 2013).
Our current understanding of the relationship between the radio and X-ray luminosities of radio-loud AGN is that the X-ray emission is typically correlated with the global radio emission and not the emission from the younger parsec-scale inner radio jet emission (Panessa & Giroletti, 2013; Burlon et al., 2013; Panessa et al., 2015). In addition, the radio–X-ray comparison by Burlon et al. (2013) at 20 GHz found a significantly different slope to previous studies which investigated the radio emission at lower frequencies (e.g. Merloni et al., 2003; Panessa et al., 2015). However, the results from Burlon et al. (2013) are likely to be hampered by distance effects and the inclusion of beamed blazars in their sample.
While the accretion disk–radio jet coupling has often been thought to be the physical interpretation for the radio–X-ray ‘fundamental plane’ (e.g. Doi et al., 2011), recent studies such as Behar et al. (2015) and Kharb et al. (2015) have proposed alternative non-jet origins for the observed radio emission from radio quiet AGN which may also account for any observed offset in the ‘fundamental plane’ between our K11 sample and those of nearby Seyferts from Merloni et al. (2003). Unlike radio loud AGN, the radio emission from radio quiet AGN can originate from the accretion disk corona (Behar et al., 2015; Kharb et al., 2015). The corona radio emission are neither collimated nor relativistic and are analogous to stellar coronal mass ejections (Bastian et al., 1998; Bastian, 2007). If this is the true explanation for the observed radio emission in radio quiet AGN, the corollary is a lower radio-to-X-ray luminosity ratio than that observed in radio loud AGN (Behar et al., 2015). However, as we have not observed a statistically significant decrease in the radio-to-X-ray luminosity ratio for our sample, relative to that found from Merloni et al. (2003), we are not able to confirm the possibility of the non-jet origin for the radio emission observed in our sample.
In summary, we have found that the majority of our radio quiet K11 sample is consistent with the general black hole ‘fundamental plane’ even though our sample appears to be consistent with the radio–FIR correlation that we expect from star-forming galaxies. While it is possible for the observed radio emission to be dominated by star formation from the host galaxy, our ‘fundamental plane’ results indicate that star formation alone is not able to explain the observed radio and X-ray emission from these radio quiet AGN. Our results are consistent with other recent studies that make the argument that the radio emission of radio quiet quasars are AGN-related (Zakamska et al., 2016; Barger et al., 2015; White et al., 2015). Related to these results are those from previous studies by Ho & Ulvestad (2001); Nagar et al. (2002) who found significant detections of radio sources with both compact and jet morphologies in radio surveys of optically-selected low luminosity AGN. This is in contrast to to other results that find that the radio emission from radio quiet galaxies are more consistent with that of star-forming galaxies (e.g. Bonzini et al., 2015).
4.2 Implications
The similarity of the K11 radio and FIR properties to the radio–FIR correlation for star forming galaxies is consistent with previous studies such as Morić et al. (2010) who found that a significant number of Seyfert galaxies also follow the radio–FIR correlation. Therefore, caution should be exercised when using the radio–FIR correlation to differentiate between galaxies dominated by AGN versus star formation as well as to infer accurate star formation rates in galaxies that host an actively accreting, albeit radio quiet, supermassive black hole.
While some studies suggest that the accretion mechanism for radio-selected AGN is different to that of optical- or X-ray selected AGN samples (e.g. Griffith & Stern, 2010), we argue that the ‘fundamental plane’ correlation between the radio and X-ray luminosities (Merloni et al., 2003; Falcke et al., 2004) support the idea that the radio and X-ray properties are likely to be linked by the accretion mechanism. We hypothesise that the difference is rather in the origin of the observed radio emission. The non-jet alternative origin for the observed radio emission, that is, the accretion disk corona origin for the observed radio emission (Behar et al., 2015; Kharb et al., 2015) can explain any observed offset in our sample relative to the ‘fundamental plane’ from Merloni et al. (2003) as well as the consistency between the K11 sample and the radio–FIR correlation observed in star forming galaxies. A corona origin for the observed radio emission is likely to be correlated to the FIR luminosities and dust temperatures. In fact, a recent study by Smith et al. (2014) has found a temperature dependence in the radio–FIR correlation in the Herschel-ATLAS survey, whereby 250 m sources with warm dust spectral energy distributions have larger 1.4 GHz luminosities than cooler sources.
While many simulations have used the AGN radio-mode as a regulator of star formation within galaxies (e.g. Croton et al., 2006), a recent study by Kaviraj et al. (2015) have found that the onset of the radio AGN is relatively late (after a few dynamical timescales) into the associated starburst phases. As such, the radio mode of AGN is unlikely to affect the star formation history of the galaxy. On the other hand, given the ubiquity of accreting supermassive black holes, our results show that radio quiet AGN are still injecting additional radio feedback into its surrounding medium and provide observational evidence for the radio maintenance mode that have long been proposed by simulations. An important implication of our result is that the observed differences between optically-selected and radio-selected samples of AGN cannot be simply attributed to the accretion efficiencies.
5 Summary and conclusions
We find that the ultra hard X-ray selection of AGN from Koss et al. (2011a) have radio properties that appear to follow the radio–FIR correlation that we expect for star-forming galaxies. However, further analysis of our K11 sample as a population and as individual sources show that the observed radio emission is more consistent with with the processes associated with accreting supermassive black holes.
We show that our sample of BAT sources follows the radio–X-ray ‘fundamental plane’ correlation—an indication that the observed radio emission is related to the accretion processes traced by the observed X-ray emission. Consistent with recent studies of radio quiet AGN (e.g. Zakamska et al., 2016; Barger et al., 2015; White et al., 2015), we conclude that radio quiet AGN includes a non-negligible component of AGN-driven radio emission and that the radio emission from galaxies hosting radio quiet AGN does not solely consist of radio emission from star formation even if the radio and FIR emission is mostly consistent with the radio–FIR correlation.
Chapter \thechapter Acknowledgments.
MJK acknowledges support from the Swiss National Science Foundation and Ambizione fellowship grant PZ00P2_154799/1. KS is supported by SNF Grant PP00P2 138979/1. ADK acknowledges financial support from the Australian Research Council Centre of Excellence for All-sky Astrophysics (CAASTRO), through project number CE110001020. CR acknowledges financial support from the CONICYT-Chile grants “EMBIGGEN” Anillo ACT1101 (CR), FONDECYT 1141218 (CR), and Basal-CATA PFB–06/2007. We thank the referee for their suggestions that improved this paper. This research has made use of the NASA/IPAC Extragalactic Database (NED) and the NASA/IPAC Infrared Science Archive (IRSA), which is operated by the Jet Propulsion Laboratory, California Institute of Technology, under contract with the National Aeronautics and Space Administration.
References
- Alam et al. (2015) Alam S., et al., 2015, ApJS, 219, 12
- Antonucci (1993) Antonucci R., 1993, ARA&A, 31, 473
- Barger et al. (2015) Barger A. J., Cowie L. L., Owen F. N., Chen C.-C., Hasinger G., Hsu L.-Y., Li Y., 2015, ApJ, 801, 87
- Bastian (2007) Bastian T. S., 2007, ApJ, 665, 805
- Bastian et al. (1998) Bastian T. S., Benz A. O., Gary D. E., 1998, ARA&A, 36, 131
- Becker et al. (1995) Becker R. H., White R. L., Helfand D. J., 1995, ApJ, 450, 559
- Behar et al. (2015) Behar E., Baldi R. D., Laor A., Horesh A., Stevens J., Tzioumis T., 2015, MNRAS, 451, 517
- Bell (2003) Bell E. F., 2003, ApJ, 586, 794
- Best & Heckman (2012) Best P. N., Heckman T. M., 2012, MNRAS, 421, 1569
- Bock et al. (1999) Bock D. C.-J., Large M. I., Sadler E. M., 1999, AJ, 117, 1578
- Bonzini et al. (2015) Bonzini M., et al., 2015, MNRAS, 453, 1079
- Burlon et al. (2013) Burlon D., Ghirlanda G., Murphy T., Chhetri R., Sadler E., Ajello M., 2013, MNRAS, 431, 2471
- Burrows et al. (2005) Burrows D. N., et al., 2005, Space Sci. Rev., 120, 165
- Buttiglione et al. (2010) Buttiglione S., Capetti A., Celotti A., Axon D. J., Chiaberge M., Macchetto F. D., Sparks W. B., 2010, A&A, 509, A6
- Condon (1989) Condon J. J., 1989, ApJ, 338, 13
- Condon (1992) Condon J. J., 1992, ARA&A, 30, 575
- Condon & Broderick (1988) Condon J. J., Broderick J. J., 1988, AJ, 96, 30
- Condon et al. (1998) Condon J. J., Cotton W. D., Greisen E. W., Yin Q. F., Perley R. A., Taylor G. B., Broderick J. J., 1998, AJ, 115, 1693
- Condon et al. (2002) Condon J. J., Cotton W. D., Broderick J. J., 2002, AJ, 124, 675
- Condon et al. (2012) Condon J. J., et al., 2012, ApJ, 758, 23
- Condon et al. (2013) Condon J. J., Kellermann K. I., Kimball A. E., Ivezić Ž., Perley R. A., 2013, ApJ, 768, 37
- Coriat et al. (2011) Coriat M., et al., 2011, MNRAS, 414, 677
- Croton et al. (2006) Croton D. J., et al., 2006, MNRAS, 365, 11
- Doi et al. (2011) Doi A., Nakanishi K., Nagai H., Kohno K., Kameno S., 2011, AJ, 142, 167
- Dong et al. (2014) Dong A.-J., Wu Q., Cao X.-F., 2014, ApJ, 787, L20
- Elitzur (2006) Elitzur M., 2006, NewAR, 50, 728
- Evans et al. (2006) Evans D. A., Lee J. C., Kamenetska M., Gallagher S. C., Kraft R. P., Hardcastle M. J., Weaver K. A., 2006, ApJ, 653, 1121
- Falcke et al. (2004) Falcke H., Körding E., Markoff S., 2004, A&A, 414, 895
- Gatti et al. (2015) Gatti M., Lamastra A., Menci N., Bongiorno A., Fiore F., 2015, A&A, 576, A32
- Griffith & Stern (2010) Griffith R. L., Stern D., 2010, AJ, 140, 533
- Haarsma et al. (2000) Haarsma D. B., Partridge R. B., Windhorst R. A., Richards E. A., 2000, ApJ, 544, 641
- Hardcastle et al. (2006) Hardcastle M. J., Evans D. A., Croston J. H., 2006, MNRAS, 370, 1893
- Hardcastle et al. (2007) Hardcastle M. J., Evans D. A., Croston J. H., 2007, MNRAS, 376, 1849
- Hatziminaoglou et al. (2010) Hatziminaoglou E., et al., 2010, A&A, 518, L33
- Heckman & Best (2014) Heckman T. M., Best P. N., 2014, ARA&A, 52, 589
- Helou et al. (1985) Helou G., Soifer B. T., Rowan-Robinson M., 1985, ApJ, 298, L7
- Hickox et al. (2009) Hickox R. C., et al., 2009, ApJ, 696, 891
- Ho & Ulvestad (2001) Ho L. C., Ulvestad J. S., 2001, ApJS, 133, 77
- Hopkins et al. (2014) Hopkins P. F., Kocevski D. D., Bundy K., 2014, MNRAS, 445, 823
- Hopkins et al. (2015) Hopkins P. F., Torrey P., Faucher-Giguere C.-A., Quataert E., Murray N., 2015, preprint, (arXiv:1504.05209)
- Ivezić et al. (2002) Ivezić Ž., et al., 2002, AJ, 124, 2364
- Jackson & Rawlings (1997) Jackson N., Rawlings S., 1997, MNRAS, 286, 241
- Kaviraj et al. (2015) Kaviraj S., Shabala S. S., Deller A. T., Middelberg E., 2015, MNRAS, 452, 774
- Kharb et al. (2015) Kharb P., Das M., Paragi Z., Subramanian S., Chitta L. P., 2015, ApJ, 799, 161
- Kimball et al. (2011) Kimball A. E., Kellermann K. I., Condon J. J., Ivezić Ž., Perley R. A., 2011, ApJ, 739, L29
- Kormendy & Ho (2013) Kormendy J., Ho L. C., 2013, ARA&A, 51, 511
- Koss & et al. (2016) Koss M., et al. 2016, in preparation
- Koss et al. (2011a) Koss M., Mushotzky R., Veilleux S., Winter L. M., Baumgartner W., Tueller J., Gehrels N., Valencic L., 2011a, ApJ, 739, 57
- Koss et al. (2011b) Koss M., et al., 2011b, ApJ, 735, L42
- Laing et al. (1994) Laing R. A., Jenkins C. R., Wall J. V., Unger S. W., 1994, in Bicknell G. V., Dopita M. A., Quinn P. J., eds, Astronomical Society of the Pacific Conference Series Vol. 54, The Physics of Active Galaxies. p. 201
- Manners et al. (2002) Manners J., Almaini O., Lawrence A., 2002, MNRAS, 330, 390
- Mauch & Sadler (2007) Mauch T., Sadler E. M., 2007, MNRAS, 375, 931
- Mauch et al. (2003) Mauch T., Murphy T., Buttery H. J., Curran J., Hunstead R. W., Piestrzynski B., Robertson J. G., Sadler E. M., 2003, MNRAS, 342, 1117
- Menci et al. (2014) Menci N., Gatti M., Fiore F., Lamastra A., 2014, A&A, 569, A37
- Merloni et al. (2003) Merloni A., Heinz S., di Matteo T., 2003, MNRAS, 345, 1057
- Mineo et al. (2014) Mineo S., Gilfanov M., Lehmer B. D., Morrison G. E., Sunyaev R., 2014, MNRAS, 437, 1698
- Morić et al. (2010) Morić I., Smolčić V., Kimball A., Riechers D. A., Ivezić Ž., Scoville N., 2010, ApJ, 724, 779
- Moshir & et al. (1990) Moshir M., et al. 1990, in IRAS Faint Source Catalogue, version 2.0 (1990).
- Mushotzky (2004) Mushotzky R., 2004, in Barger A. J., ed., Astrophysics and Space Science Library Vol. 308, Supermassive Black Holes in the Distant Universe. p. 53 (arXiv:astro-ph/0405144), doi:10.1007/978-1-4020-2471-9˙2
- Nagar et al. (2002) Nagar N. M., Falcke H., Wilson A. S., Ulvestad J. S., 2002, A&A, 392, 53
- Ogle et al. (2006) Ogle P., Whysong D., Antonucci R., 2006, ApJ, 647, 161
- Panessa & Giroletti (2013) Panessa F., Giroletti M., 2013, MNRAS, 432, 1138
- Panessa et al. (2015) Panessa F., et al., 2015, MNRAS, 447, 1289
- Prescott et al. (2016) Prescott M., et al., 2016, MNRAS, 457, 730
- Rengelink et al. (1997) Rengelink R. B., Tang Y., de Bruyn A. G., Miley G. K., Bremer M. N., Roettgering H. J. A., Bremer M. A. R., 1997, A&AS, 124
- Rigby et al. (2009) Rigby J. R., Diamond-Stanic A. M., Aniano G., 2009, ApJ, 700, 1878
- Rodríguez-Ardila & Mazzalay (2006) Rodríguez-Ardila A., Mazzalay X., 2006, MNRAS, 367, L57
- Rosario et al. (2013) Rosario D. J., Burtscher L., Davies R., Genzel R., Lutz D., Tacconi L. J., 2013, ApJ, 778, 94
- Schartmann et al. (2005) Schartmann M., Meisenheimer K., Camenzind M., Wolf S., Henning T., 2005, A&A, 437, 861
- Schawinski et al. (2015) Schawinski K., Koss M., Berney S., Sartori L. F., 2015, MNRAS, 451, 2517
- Sesana et al. (2014) Sesana A., Barausse E., Dotti M., Rossi E. M., 2014, ApJ, 794, 104
- Smith et al. (2014) Smith D. J. B., et al., 2014, MNRAS, 445, 2232
- Stern et al. (2005) Stern D., et al., 2005, ApJ, 631, 163
- Strateva et al. (2001) Strateva I., et al., 2001, AJ, 122, 1861
- Teng et al. (2012) Teng S. H., et al., 2012, ApJ, 753, 165
- Trakhtenbrot & Netzer (2012) Trakhtenbrot B., Netzer H., 2012, MNRAS, 427, 3081
- Tueller et al. (2010) Tueller J., et al., 2010, ApJS, 186, 378
- Ueda et al. (2007) Ueda Y., et al., 2007, ApJ, 664, L79
- Ulvestad et al. (1995) Ulvestad J. S., Antonucci R. R. J., Goodrich R. W., 1995, AJ, 109, 81
- Urry & Padovani (1995) Urry C. M., Padovani P., 1995, PASP, 107, 803
- Van der Kruit (1971) Van der Kruit P. C., 1971, A&A, 15, 110
- White et al. (1997) White R. L., Becker R. H., Helfand D. J., Gregg M. D., 1997, ApJ, 475, 479
- White et al. (2015) White S. V., Jarvis M. J., Häußler B., Maddox N., 2015, MNRAS, 448, 2665
- Whysong & Antonucci (2004) Whysong D., Antonucci R., 2004, ApJ, 602, 116
- Yun et al. (2001) Yun M. S., Reddy N. A., Condon J. J., 2001, ApJ, 554, 803
- Zakamska et al. (2016) Zakamska N. L., Lampayan K., Petric A., Dicken D., Greene J. E., Heckman T. M., Hickox R. C., Ho L. C. e. a., 2016, MNRAS, 455, 4191
| Galaxy | RA | Declination | Redshift | Distance | log () | |
|---|---|---|---|---|---|---|
| 2MASX J01064523+0638015 | 01:06:45.2 | 06:38:01.6 | 0.041 | 178.7 | 10.4 | 1.8 |
| MCG -01-05-047 | 01:52:49.0 | -03:26:48.6 | 0.016 | 72.2 | 10.5 | 15.1 |
| NGC 788 | 02:01:06.5 | -06:48:57.0 | 0.013 | 58.0 | 10.68 | 3.0 |
| Mrk 1018 | 02:06:16.0 | -00:17:29.3 | 0.042 | 186.1 | 10.92 | 3.4 |
| ARP 318 | 02:09:20.9 | -10:07:59.2 | 0.013 | 56.3 | — | 2.1 |
| Mrk 590 | 02:14:33.6 | -00:46:0.3 | 0.026 | 113.7 | 10.84 | 9.9 |
| Mrk 1044 | 02:30:05.5 | -08:59:53.6 | 0.016 | 70.4 | 9.88 | 1.2 |
| NGC 985 | 02:34:37.9 | -08:47:17.0 | 0.043 | 187.7 | 10.71 | 5.7 |
| NGC 1052 | 02:41:04.8 | -08:15:20.7 | 0.005 | 19.6 | 10.35 | 1053.0 |
| Mrk 595 | 02:41:34.9 | 07:11:14.0 | 0.027 | 116.4 | 10.3 | — |
| MCG -02-08-014 | 02:52:23.4 | -08:30:37.7 | 0.017 | 71.7 | 10.01 | 6.6 |
| NGC 1142 | 02:55:12.3 | -00:11:01.8 | 0.029 | 124.6 | 10.93 | |
| NGC 1194 | 03:03:49.1 | -01:06:13.0 | 0.013 | 56.9 | 10.32 | 1.5 |
| 2MASX J03305218+0538253 | 03:30:52.2 | 05:38:25.3 | 0.046 | 201.3 | 10.02 | 3.6 |
| Mrk 79 | 07:42:32.9 | 49:48:35.0 | 0.022 | 95.4 | 10.57 | 14.9 |
| UGC 03995 | 07:44:09.1 | 29:14:50.7 | 0.016 | 68.0 | 10.57 | — |
| Mrk 10 | 07:47:29.0 | 60:56:00.9 | 0.029 | 126.4 | 10.73 | — |
| 2MASX J07595347+2323241 | 07:59:53.5 | 23:23:24.2 | 0.030 | 128.0 | 10.57 | 18.0 |
| IC 0486 | 08:00:21.0 | 26:36:48.3 | 0.027 | 117.5 | 10.61 | 3.1 |
| MCG +02-21-013 | 08:04:46.4 | 10:46:36.3 | 0.034 | 149.3 | 10.68 | 21.9 |
| CGCG 031-072 | 08:14:25.3 | 04:20:32.4 | 0.033 | 143.2 | 10.27 | — |
| MCG +11-11-032 | 08:55:12.6 | 64:23:45.2 | 0.036 | 156.3 | 10.33 | — |
| Mrk 18 | 09:01:58.4 | 60:09:06.2 | 0.011 | 47.2 | 9.57 | 26.3 |
| 2MASX J09043699+5536025 | 09:04:37.0 | 55:36:02.7 | 0.037 | 161.4 | 9.76 | 1.4 |
| 2MASX J09112999+4528060 | 09:11:30.0 | 45:28:06.0 | 0.026 | 115.5 | 9.76 | 3.4 |
| Mrk 704 | 09:18:26.0 | 16:18:19.7 | 0.029 | 126.3 | 10.34 | 6.9 |
| SBS 0915+556 | 09:19:13.2 | 55:27:55.2 | 0.049 | 213.0 | — | 2.5 |
| IC 2461 | 09:19:58.0 | 37:11:27.8 | 0.008 | 72.9 | 9.54 | 4.4 |
| MCG +04-22-042 | 09:23:43.0 | 22:54:32.4 | 0.033 | 141.5 | 10.49 | 9.3 |
| Mrk 110 | 09:25:12.9 | 52:17:10.5 | 0.035 | 153.6 | 9.9 | 8.2 |
| Mrk 705 | 09:26:03.2 | 12:44:04.1 | 0.028 | 120.8 | 10.18 | 8.5 |
| NGC 2885 | 09:27:18.5 | 23:01:12.1 | 0.026 | 112.0 | 10.56 | 2.8 |
| CGCG 312-012 | 09:29:37.9 | 62:32:38.3 | 0.026 | 110.3 | 10.3 | 2.4 |
| CGCG 122-055 | 09:42:04.8 | 23:41:06.6 | 0.021 | 91.8 | 9.94 | 5.9 |
| IC 2515 | 09:54:39.4 | 37:24:30.8 | 0.019 | 82.7 | 10.04 | 3.6 |
| NGC 3079 | 10:01:57.8 | 55:40:47.2 | 0.004 | 19.3 | 9.98 | 293.0 |
| NGC 3227 | 10:23:30.6 | 19:51:54.3 | 0.003 | 20.9 | 9.98 | 82.8 |
| MCG +06-24-008 | 10:44:49.0 | 38:10:52.5 | 0.026 | 111.5 | 10.23 | 9.7 |
| UGC 05881 | 10:46:42.5 | 25:55:54.0 | 0.021 | 88.1 | 10.22 | 9.0 |
| Mrk 417 | 10:49:30.9 | 22:57:52.4 | 0.033 | 142.1 | 10.2 | — |
| Mrk 728 | 11:01:01.8 | 11:02:48.8 | 0.030 | 154.7 | 10.09 | 2.9 |
| Mrk 732 | 11:13:49.7 | 09:35:10.7 | 0.029 | 126.3 | 10.48 | 4.7 |
| ARP 151 | 11:25:36.2 | 54:22:57.3 | 0.021 | 90.5 | 9.7 | 3.0 |
| NGC 3718 | 11:32:34.9 | 53:04:04.2 | 0.003 | 17.0 | 9.98 | 10.6 |
| UGC 06527 | 11:32:40.2 | 52:57:01.1 | 0.026 | 113.9 | 10.22 | 25.8 |
| IC 2921 | 11:32:49.3 | 10:17:47.4 | 0.044 | 191.0 | — | — |
| Mrk 739E | 11:36:29.3 | 21:35:45.0 | 0.030 | 128.4 | 10.47 | 3.4 |
| NGC 3786 | 11:39:42.5 | 31:54:33.7 | 0.009 | 41.6 | 10.01 | 13.2 |
| KUG 1141+371 | 11:44:29.9 | 36:53:08.6 | 0.038 | 165.5 | 10.19 | — |
| UGC 06732 | 11:45:33.2 | 58:58:40.0 | 0.010 | 42.3 | — | 4.7 |
| MCG +05-28-032 | 11:48:46.0 | 29:38:28.6 | 0.023 | 99.0 | 10.14 | 10.4 |
| IC 0751 | 11:58:52.6 | 42:34:13.7 | 0.031 | 134.1 | 10.48 | 43.0 |
| 2MASX J12005792+0648226 | 12:00:57.9 | 06:48:22.7 | 0.036 | 156.1 | 10.58 | 5.2 |
| Mrk 1310 | 12:01:14.4 | -03:40:41.0 | 0.019 | 86.1 | — | 3.1 |
| NGC 4051 | 12:03:09.7 | 44:31:52.5 | 0.002 | 14.5 | 9.44 | 19.3 |
| ARK 347 | 12:04:29.6 | 20:18:58.1 | 0.023 | 96.9 | 10.3 | 2.2 |
| UGC 07064 | 12:04:43.4 | 31:10:38.0 | 0.025 | 107.6 | 10.54 | 7.6 |
| NGC 4102 | 12:06:23.1 | 52:42:39.4 | 0.003 | 21.0 | 9.68 | 223.4 |
| Mrk 198 | 12:09:14.1 | 47:03:30.3 | 0.025 | 105.8 | 10.12 | 9.4 |
| NGC 4138 | 12:09:29.8 | 43:41:07.2 | 0.003 | 15.6 | 9.61 | — |
| KUG 1208+386 | 12:10:44.3 | 38:20:10.2 | 0.023 | 98.0 | 10.02 | 5.9 |
| Mrk 1469 | 12:16:07.1 | 50:49:30.1 | 0.031 | 134.1 | 10.22 | 7.9 |
| NGC 4235 | 12:17:09.9 | 07:11:30.0 | 0.008 | 35.1 | 10.36 | 5.1 |
| Mrk 766 | 12:18:26.5 | 29:48:46.2 | 0.013 | 54.0 | 10.02 | 40.3 |
| M 106 | 12:18:57.6 | 47:18:13.4 | 0.002 | 7.5 | 9.95 | 93.0 |
| Mrk 50 | 12:23:24.1 | 02:40:44.4 | 0.023 | 99.7 | 9.9 | — |
| NGC 4388 | 12:25:46.8 | 12:39:43.5 | 0.008 | 18.3 | 10.53 | 45.0 |
| NGC 4395 | 12:25:48.9 | 33:32:48.3 | 0.001 | 4.1 | 8.28 | 1.2 |
| NGC 4593 | 12:39:39.5 | -05:20:39.2 | 0.009 | 44.0 | 10.75 | 5.2 |
| NGC 4686 | 12:46:39.8 | 54:32:03.1 | 0.017 | 71.7 | 10.68 | 4.7 |
| SBS 1301+540 | 13:03:59.4 | 53:47:30.1 | 0.030 | 129.2 | 9.79 | 1.2 |
| NGC 4992 | 13:09:05.6 | 11:38:02.7 | 0.025 | 108.5 | 10.64 | 1.6 |
| UGC 08327 | 13:15:17.3 | 44:24:25.9 | 0.037 | 158.8 | 10.55 | 11.8 |
| NGC 5106 | 13:20:59.6 | 08:58:42.2 | 0.032 | 138.3 | 10.59 | 93.0 |
| NGC 5231 | 13:35:48.3 | 02:59:55.6 | 0.022 | 93.5 | 10.51 | 6.7 |
| NGC 5252 | 13:38:15.9 | 04:32:33.0 | 0.022 | 95.5 | 10.59 | 12.6 |
| Mrk 268 | 13:41:11.2 | 30:22:41.1 | 0.040 | 173.6 | 10.64 | 41.3 |
| NGC 5273 | 13:42:08.4 | 35:39:15.3 | 0.004 | 17.7 | 9.64 | 2.9 |
| CGCG 102-048 | 13:44:15.7 | 19:33:59.7 | 0.027 | 116.0 | 10.31 | 2.2 |
| NGC 5290 | 13:45:19.1 | 41:42:44.4 | 0.009 | 35.7 | 10.23 | 10.4 |
| UM 614 | 13:49:52.8 | 02:04:45.0 | 0.033 | 142.3 | 9.99 | 0.9 |
| Mrk 464 | 13:55:53.5 | 38:34:28.7 | 0.051 | 222.8 | 9.67 | 15.0 |
| Mrk 463 | 13:56:02.8 | 18:22:17.3 | 0.050 | 221.0 | 10.61 | 367.8 |
| CGCG 046-033 | 14:00:18.4 | 05:02:42.2 | 0.034 | 148.7 | 10.18 | 10.0 |
| NGC 5506 | 14:13:14.9 | -03:12:27.2 | 0.006 | 28.7 | 10.02 | 337.9 |
| NGC 5548 | 14:17:59.5 | 25:08:12.4 | 0.017 | 71.4 | 10.46 | 24.4 |
| NGC 5610 | 14:24:22.9 | 24:36:51.4 | 0.017 | 72.3 | 10.28 | 22.4 |
| NGC 5674 | 14:33:52.3 | 05:27:29.8 | 0.025 | 107.3 | 10.57 | 11.0 |
| NGC 5683 | 14:34:52.5 | 48:39:42.9 | 0.036 | 157.3 | 10.22 | — |
| Mrk 817 | 14:36:22.1 | 58:47:38.9 | 0.031 | 135.2 | 10.41 | 9.2 |
| Mrk 477 | 14:40:38.1 | 53:30:15.0 | 0.038 | 164.0 | 9.87 | 59.2 |
| 2MASX J14530794+2554327 | 14:53:07.9 | 25:54:32.8 | 0.049 | 213.0 | — | — |
| Mrk 841 | 15:04:01.2 | 10:26:16.4 | 0.036 | 158.2 | 9.97 | — |
| Mrk 1392 | 15:05:56.6 | 03:42:26.2 | 0.036 | 157.3 | 10.64 | 8.8 |
| NGC 5899 | 15:15:03.3 | 42:02:59.5 | 0.009 | 43.9 | 10.28 | 10.4 |
| NGC 5940 | 15:31:18.1 | 07:27:27.7 | 0.034 | 147.4 | 10.47 | — |
| Mrk 290 | 15:35:52.4 | 57:54:09.5 | 0.030 | 128.1 | 9.8 | 5.3 |
| 2MASX J16174158+0607100 | 16:17:41.6 | 06:07:10.0 | 0.038 | 164.8 | 10.14 | — |
| CGCG 198-020 | 17:12:28.4 | 35:53:02.3 | 0.026 | 112.0 | 10.38 | — |
| ARP 102B | 17:19:14.5 | 48:58:49.4 | 0.024 | 104.0 | 10.25 | 158.7 |
| CGCG 300-062 | 17:43:17.3 | 62:50:20.8 | 0.033 | 143.0 | 9.9 | 1.5 |
| Mrk 520 | 22:00:41.4 | 10:33:08.0 | 0.027 | 114.7 | 10.4 | 60.8 |
| MCG +01-57-016 | 22:40:17.1 | 08:03:13.4 | 0.025 | 107.5 | 10.26 | 8.2 |
| NGC 7469 | 23:03:15.7 | +08:52:25.3 | 0.016 | 69.8 | 10.49 | 145.7 |
| Mrk 926 | 23:04:43.5 | -08:41:08.5 | 0.047 | 206.5 | 10.82 | 22.5 |
| NGC 7603 | 23:18:56.6 | 00:14:37.6 | 0.029 | 126.6 | 10.94 | 21.1 |
| NGC 7679 | 23:28:46.7 | +03:30:41.0 | 0.017 | 73.4 | 10.17 | 26.6 |
| NGC 7682 | 23:29:03.9 | +03:32:00.0 | 0.017 | 73.1 | 10.53 | 54.0 |
Col. (1): Object identification. Col. (2): Galaxy centre’s right ascension (J2000). Col. (3): Galaxy center’s declination (J2000). Col. (4): Redshift. Col. (5): Distance in Megaparsecs. Col. (6): log stellar mass (M⊙). Col. (7): Total 1.4 GHz flux in mJy from FIRST.