Symbiotic stars in X-rays III: Suzaku observations.
Abstract
We describe the X-ray emission as observed with Suzaku from five symbiotic stars that we selected for deep Suzaku observations after their initial detection with ROSAT, ASCA and Swift. We find that the X-ray spectra of all five sources can be adequately fit with absorbed, optically thin thermal plasma models, with either single- or multi-temperature plasmas. These models are compatible with the X-ray emission originating in the boundary layer between an accretion disk and a white dwarf. The high plasma temperatures of kT keV for all five targets were greater than expected for colliding winds. Based on these high temperatures, as well as previous measurements of UV variability and UV luminosity, and the large amplitude of X-ray flickering in 4 Dra, we conclude that all five sources are accretion-powered through predominantly optically thick boundary layers. Our X-ray data allow us to observe a small, optically thin portion of the emission from these boundary layers. Given the time between previous observations and these observations, we find that the intrinsic X-ray flux and the intervening absorbing column can vary by factors of three or more on a time scale of years. However, the location of the absorber and the relationship between changes in accretion rate and absorption are still elusive.
1 Introduction
When observed at optical wavelengths, symbiotic stars (SS) show a composite spectrum that suggests that they are binary systems. A hot, compact component (usually a white dwarf, WD) contributes to the blue-UV region of the spectrum, while a cool red giant dominates the spectrum at longer wavelengths.
Observations at other wavelengths reveal a very complex and rich scenario for these systems. Optical, infrared and UV spectral regions are rich in emission lines from forbidden and permitted transitions, which arise mainly from photoionization and recombination of the nebular plasma heated by the the hot component (Kenyon, 1986). Radio, optical, and X-ray observations reveal jets with velocities of a few hundred to around 1,000 km s-1 (e.g., Brocksopp et al., 2004; Crocker et al., 2001; Kellogg et al., 2007) and thermal emission from the ionized red-giant wind (Seaquist & Taylor, 1990; Seaquist et al., 1993). Symbiotic stars can even produce -rays during nova eruptions (e.g. V407 Cyg, Abdo et al., 2010; Ackermann et al., 2014). Symbiotics are now recognized as a population of X-ray sources. From the 220 systems known (Belczyński et al., 2000), 45 have been detected at X-ray wavelengths, most of them with emission in the 0.3 to 10 keV range. A few, however, were detected at energies up to 100 keV (Kennea et al., 2009).
The X-ray emission from symbiotic stars consist of some combination of four distinct spectral components (dubbed and ), which most likely arise from distinct emission regions and/or processes (Luna et al., 2013, hereafter Paper I). In particular, , and -type X-ray spectral components come from thermal X-ray emission (optically thin or blackbody-type) that arises from the quasi-stable nuclear burning on the WD surface (), a colliding-wind region with kT 1 keV (), or an accretion-disk boundary layer (). Those symbiotics with a neutron star as the accreting compact object and non-thermal, power-law type X-ray spectra are classified as -type by Mürset et al. (1997).
Sensitive and broadband X-ray satellites such as Suzaku have played a significant role in observing symbiotics, specially those with X-ray emission above 10 keV (T CrB, CH Cyg, V648 Car; Luna et al., 2008; Mukai et al., 2007; Kennea et al., 2009). Luna et al. (2013) and Nuñez at al. (2014) studied and classified the first X-ray detections of many symbiotics with Swift, XMM-Newton and/or Chandra. Here we describe Suzaku observations of CD-28 3719, Hen 3-1591, Hen 3-461, EG And and 4 Dra. All five symbiotic stars have previously been observed with Swift, ROSAT or ASCA (Luna et al., 2013; Mürset et al., 1997); the Suzaku observations provide higher quality X-ray spectra. Here we present the analysis of these Suzaku XIS data. In Section 2 we detail the data reduction and analysis for these five sources, while in Section 3 we present the results. We discuss our interpretation of the results in Section 4 and explain our conclusions in Section 5.
2 Observations and data reduction
Suzaku observed the five symbiotic stars with the X-ray Imaging Spectrometer (XIS; Koyama, 2007). Details of each observation are presented in Table 1. Data were taken with the XIS0, XIS1, and XIS3 detectors, which are sensitive in the 0.2-12 keV range (XIS2 has not been operational since November 2006). All sources were too faint to be detected with the Hard X-ray detector (HXD). We reprocessed all data using the aepipeline script and obtained event files with the processing version 2.5.16.29 (2014-07-01) applied.
Source spectra and light curves were extracted from circular regions centered on the source SIMBAD111http://simbad.u-strasbg.fr/simbad/sim-fid coordinates. The recommended radius of the extraction region222http://heasarc.gsfc.nasa.gov/docs/suzaku/analysis/abc/ is 260 (this size encircles 99% of the point source flux); given the source and background brightnesses, however, we were able to use this size only in the case of 4 Dra. Comparing the source spectra with that of the background, we found that the optimal radius for the source region, which maximizes the signal-to-noise ratio, was of 120 in the case of Hen 3-1591, CD -28 3719, and EG And, and 60 for Hen 3-461. Background spectra and light curves were extracted from annular regions centered on the source (with inner and outer radius of 340 and 430, respectively) in the case of Hen 3-1591, CD -28 3719, Hen 3-461, and 4 Dra, while a circular region with 160 radius was used for EG And because the location of the source on the chip did not allow us to select an annular region for the background. The response matrices were created using the xisrmfgen and xisarfgen tools. We then fit the binned spectra (grouped by a minimum of 20 to 25 counts per bin) using XSPEC333http://heasarc.gsfc.nasa.gov/docs/xanadu/xspec/ and the statistic to select the best-fit models.
One of our targets, Hen 3-1591, was observed serendipitously with ASCA (Tanaka et al., 1994) on 1999 September 22 during an observation of the supernova remnant (SNR), G5.2-2.6 (catalog ). The Solid-state Imaging Spectrometer (SIS) was operated in 1-CCD mode for this observation (of the 4 chips available), which put Hen 3-1591 outside the operational SIS field of view. On the other hand, Hen 3-1591 was securely in the field of view of the Gas Imaging Spectrometer (GIS) instrument, which has two units (GIS2 and GIS3). We selected intervals when the satellite was outside the South Atlantic Anomaly (SAA), when the attitude control was stable and the satellite pointed within 0.02 degrees of the target, and when the line of sight was greater than 5 degrees above the Earth limb. We also applied standard selection criteria combining monitor count rates and geomagnetic cutoff rigidity (COR) to exclude time intervals of high-particle background, in the end obtaining 15 ks of good on-source data.
For the ASCA observation on Hen 3-1591, we extracted the source spectrum from a 6′-radius circular extraction region centered on the source, and the background spectrum from a 6′-radius region centered at =271.6619, =-25.8192, away from the SNR and other obvious sources. We used the v4.0 rmf downloaded from the CALDB and generated an arf file for each unit of the GIS. We then combined the GIS2 and GIS3 spectra and responses, ignored the data outside the well-calibrated range of 0.7–10 keV, and binned the data by a factor of 32, leaving 26 channels.
| Source | Date | ObsId | Exp. Time [ks] |
|---|---|---|---|
| CD -28 3719. | 2013-10-12 | 408032010 | 14 |
| Hen 3-1591. | 2012-10-03 | 407042010 | 51 |
| - ASCA . | 1999-09-22 | 57055000 | 15 |
| Hen 3-461. | 2012-12-17 | 407007010 | 46 |
| EG And. | 2011-02-05 | 405034010 | 100 |
| 4 Dra. | 2010-04-18 | 405035010 | 42 |
| 2011-11-09 | 406041010 | 42 |
In those cases where the thermal nature of the emission was not obvious, i.e. lines arising from optically thin thermal emission were weak or absent, we evaluated whether any of three spectral models — an absorbed single-temperature optically thin thermal plasma, an absorbed multi-temperature cooling flow, or an absorbed non-thermal plasma — properly fit the data based on their . The parameters of the best-fit models are listed in Table 2. We used the Tbabs to model absorption that completely covered the sources of X-ray emission, using the abundances of Wilms et al. (2000) and the cross-sections of Verner & Yakovlev (1996).
3 Results
3.1 Spectral analysis
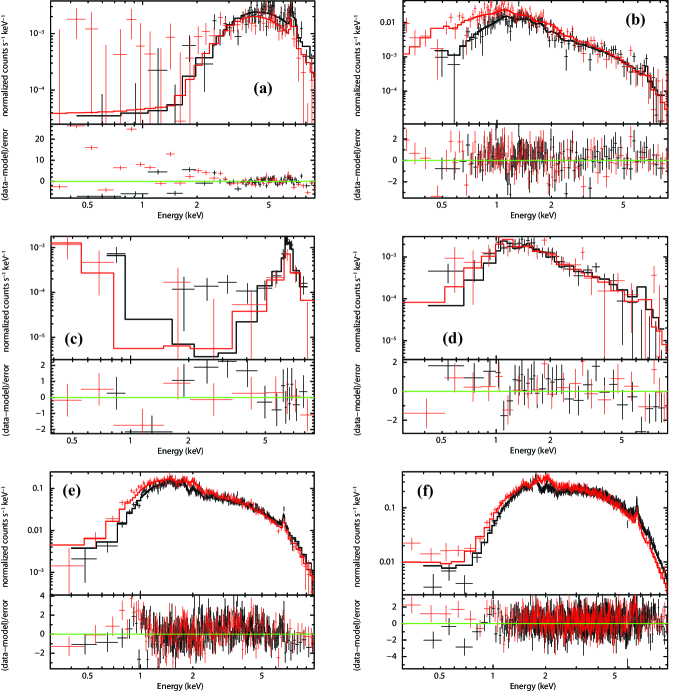
The X-ray emission from each of the five sources we observed with Suzaku was successfully modeled as absorbed, optically thin thermal emission from either a single or multi-temperature plasma. Temperatures were high, with kT of about a few keV for all sources. The fluxes from both objects in common with Paper 1 (Hen 3-461 and CD -28 3719) were higher when observed with Swift than when observed more recently with Suzaku. The parameters from the best fit models are listed in Table 2 while spectra are shown in Fig. 1.
3.1.1 CD -28 3719
To improve the basic spectral modeling, we intended for our Suzaku observation to provide a spectrum with a higher signal-to-noise ratio than previous datasets. During the observation of CD -28 3719, however, there were some problems in the acquisition of the XIS0 chip data, which did not return to the 55 editing mode after dark frame dump during a South Atlantic Anomaly passage, and the data during these segments were corrupted. For this reason, we only analyzed the data from the XIS1 and XIS3 chips.
The presence of excess counts in the 6.6 keV region led us to test optically thin thermal plasma models for the spectrum instead of non-thermal models, which should not produce emission lines in this spectral region. Fe K fluorescent emission line, if present, should be centered at 6.4 keV. We interpret the line near 6.6 keV as being due to a combination of H-like, He-like, and fluorescent Fe lines. The best fit model for this source, whose x-ray spectrum we show in Figure 1, consists of an absorbed, single-temperature, optically thin thermal plasma with variable abundance, Tbabsapec. The metal abundance was 0.44. The other best-fit model parameters are listed in Table 2. The results from this fit are commensurate with the results obtained from the Swift data analyzed in Paper I.
3.1.2 Hen 3-1591
Hen 3-1591 was serendipitously observed with ASCA/GIS, and our reduction of the ASCA data revealed that it was detected with a net count rate of 0.016 c/s/GIS. Figure 2 shows the ASCA spectrum of Hen 3-1591, which contains 200 photons. A power-law fit with a photon index near 2.4, with excess counts around 6.6 keV, provides an acceptable fit. Adding a Gaussian, the line centroid was found to be near 6.6 keV with an equivalent width well in excess of 1 keV (calculated by including eqwidth in the gaussian component of the model). As this line is probably due to a combination of H-like, He-like, and fluorescent Fe lines, the X-ray emission should be modeled as optically thin thermal emission with reflection adding the 6.6 keV line rather than a power-law. In fact, a cooling flow plus Gaussian model gives a good description of the observed spectrum. The maximum temperature is around 14 keV, iron is strongly overabundant ( twice the solar value), and the equivalent width of the fluorescent line ( 600 eV) also requires an overabundance of iron. This X-ray spectrum suggests that Hen 3-1591 hosts a WD accreting matter that is overabundant in Fe.
To model the Suzaku spectrum, we tested a non-thermal model like that suggested by the early ROSAT data Mürset et al. (1997) and thermal models inspired by the ASCA data, which suggested that the X-ray emission is due to an optically thin thermal plasma. The two thermal models we tested (a single temperature apec model and multi-temperature cooling flow model) returned similar statistics (=1.2). We prefer the Tbabsapec model. As with the ASCA data, the Suzaku data show indicate an overabundance of iron. Based on the fit statistic alone, we cannot rule out an absorbed non-thermal model (=1.2). Because of the low number of photons detected in the Fe K line region of the Suzaku spectrum, the continued presence of the H-like, He-like emission lines, which arise from thermal emission, was not immediately obvious. We addressed the significance of a detection of emission lines in the Fe K region by adding a gaussian line profile (centered at 6.660.23 keV) to the power-law model, which represents the underlying continuum, and comparing this model with a simple absorbed power-law model using the Likelihood Ratio Test (LRT, Protassov et al. (2002) with a 1,000 simulations. In 88.3 % of the simulations, a model with an emission line at 6.66 keV yields values smaller that the model without the emission line. We take this as evidence of the thermal nature of the emitting plasma. We discuss additional evidence that supports a thermal origin for the X-ray emission in Section 4.

3.1.3 Hen 3-461
Almost two and half years after the Swift observation, Suzaku observed Hen 3-461 and only detected 285 source photons, i.e. an 8 detection after background subtraction. Given the low number of photons detected, we were only able to perform crude spectral modeling (=0.93; see Table 2). We noticed that a weak soft component was detected at a low significance level (2). We thus decided to include a second component in our spectral model, being aware of the similarity with the well-known, two-spectral component -type emission observed in few WD symbiotics (e.g. NQ Gem, V347 Nor, see Paper I). We observed a strong excess of counts in the Fe K region, which is naturally explained if the emission originates in an optically thin thermal plasma. Thus, our best spectral model consisted of two optically thin thermal components and a Gaussian emission line at 6.4 keV to account for the fluorescent Fe K line. The hard component was modified by full- and partial-covering absorbers (apec+Tbabs*pcfabs(apec+gauss)).
| Object | Model | Count rate | NH,22aaAbsorption column density (in units of 1022 atoms cm-2) and covering fraction (CF) of the partial absorber model pcfabs. | kTbbIndicates the value of the maximum temperature in the case of the cooling flow model mkcflow, , photon index of model power-law | FXccUnabsorbed X-ray flux, in units of 10-13 erg s-1 cm-2 in the 0.3-10.0 keV energy range. | LXddUnabsorbed X-ray luminosity, in units of 1031 erg s-1 in the 0.3-10.0 keV energy range, scaled by the distances listed in Section 3. | /d.o.f. |
|---|---|---|---|---|---|---|---|
| [10-2 c s-1] | [keV] | ||||||
| CD -28 3719 (catalog ) . | Tbabsapec | 0.90.1 | 10 | 8 | 141 | 181 (d/1 kpc)2 | 1.2/181 |
| Tbabsmkcflow | 13 | 11 | 191 | 221 (d/1 kpc)2 | 1.2/182 | ||
| Hen 3-1591 (catalog ) . | Tbabsapec | 3.70.1 | 0.040.01 | 31 | 6.00.2 | 6.10.2 (d/1 kpc)2 | 1.2/210 |
| Tbabsmkcflow | 0.100.04 | 61 | 6.90.3 | 7.80.3 (d/1 kpc)2 | 1.2/214 | ||
| Hen 3-461 (catalog ) . | apec+Tbabspcfabs(apec+gauss) | 0.20.1 | 3 | 8 | 265 | 316 (d/1 kpc)2 | 1.5/23 |
| 7525; CF=0.970.02 | |||||||
| EG And (catalog ) . | Tbabsapec | 0.40.1 | 0.3 | 32 | 1.10.2 | 0.40.1 (d/512 pc)2 | 0.9/134 |
| Tbabsmkcflow | 0.90.3 | 31 | 2.40.2 | 0.8 0.1 (d/512 pc)2 | 1.1/134 | ||
| 1st scenario | |||||||
| (see Sect. 3.1.5) | |||||||
| 4 Dra(4050) (catalog ) . | Tbabspcfabsvapec | 381 | 0.430.05 | 6.10.2 | 1182 | 51 (d/190 pc)2 | 1.1/5406 |
| 1.30.5 , CF=0.220.07 | |||||||
| 4 Dra(4060) (catalog ) . | Tbabspcfabsvapec | 1101 | 0.960.06 | 6.10.2 | 5773 | 252 (d/190 pc)2 | 1.1/5406 |
| 2.70.2, CF=0.620.04 | |||||||
| 4 Dra(4050) (catalog ) . | Tbabspcfabsmkcflow | 0.470.15 | 141 | 1302 | 61 (d/190 pc)2 | 1.1/5406 | |
| 0.7, CF=0.45 | |||||||
| 4 Dra(4060) (catalog ) . | Tbabspcfabsmkcflow | 1.320.04 | 141 | 6403 | 271 (d/190 pc)2 | 1.1/5406 | |
| 2.6, CF=0.510.02 | |||||||
| 2nd scenario | |||||||
| (see Sect. 3.1.5) | |||||||
| 4 Dra(4050) (catalog ) . | Tbabspcfabsvapec | 0.47 | 4.90.3 | 1241 | 51 (d/190 pc)2 | 1.01/1794 | |
| 2.6, CF=0.290.05 | |||||||
| 4 Dra(4060) (catalog ) . | Tbabspcfabsvapec | 0.910.07 | 6.40.2 | 5472 | 241 (d/190 pc)2 | 1.05/3601 | |
| 2.88, CF=0.610.04 | |||||||
| 4 Dra(4050) (catalog ) . | Tbabspcfabsmkcflow | 0.65 | 7.3 | 1692 | 71 (d/190 pc)2 | 1.01/1794 | |
| 31, CF=0.400.05 | |||||||
| 4 Dra(4060) (catalog ) . | Tbabspcfabsmkcflow | 1.160.08 | 11.50.7 | 6832 | 301 (d/190 pc)2 | 1.05/3610 | |
| 3.10.4, CF=0.600.03 |
3.1.4 EG And
Our Suzaku observation took place at orbital phase =0.93 (using the ephemeris from Kolb et al., 2004), with the WD moving behind the red giant wind (or =0.17 if we use the orbital period of 481 days and the ephemeris from Vogel (1991), i.e. the WD coming out of partial eclipse). After visual inspection of the Suzaku spectrum, we verified that no obvious features were present and grouped the channels to have a minimum of 20 counts per bin, which allowed us to use statistics to assess the quality of the fit. Several pieces of evidence suggest that the accreting compact object is a non-magnetic WD and thus that the X-ray spectrum could be modeled as due to optically thin thermal emission. To our knowledge, periodic modulations at the WD spin have not been detected either in optical or X-ray wavelengths, suggesting that synchrotron emission from a strong magnetic field is not present. In addition, (Kolb et al., 2004) successfully model the UV emission with NLTE atmospheric models for a low-mass WD. We thus consider the best-fit model the one that consists of an absorbed, optically thin thermal plasma. The parameters are listed in Table 2.
3.1.5 4 Dra
We analyzed the two Suzaku observations, ObsID 405035010 and 406041010 (hereafter 4050 and 4060, respectively; see Table 1). Although in terms of , an absorbed, non-thermal plasma plus a gaussian emission line model (Tbabs(power+gauss)) fits the observed spectrum, the line centroid is at 6.67 keV with an equivalent width 0.17 keV, consistent with Fe XXV transitions from a thermal plasma. We thus prefer a thermal origin for the observed X-ray emission.
We obtained acceptable fits with spectral models of optically thin thermal plasma emission in two different scenarios. In the first scenario, we simultaneously fit both observations linking the temperature of the optically thin thermal emission for both observations while allowing the absorption column to vary independently. This is a valid assumption if the X-ray emitting plasma arises in the post-shock region of the accretion disk boundary layer, and its temperature is set by the WD mass, which does not change between observations. In the second scenario, we modeled both observations independently.
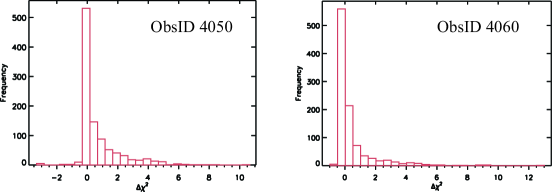
The first spectral model consists of an absorbed, single temperature plasma with a reduced Fe abundance (vapec444https://heasarc.gsfc.nasa.gov/xanadu/xspec/manual/XSmodelApec.html). This model is formally acceptable for the two observations (see Table 2). However, in the case of 4060 there are significant residuals at energies below 1 keV, suggesting that a simple absorption model is not completely appropriate. The fact that some flux is detected at energies below 1 keV might be the footprint of an absorber that partially covers the X-ray source. We thus added such an absorber to our spectral model, significantly improving the fit for both observations. To quantify the fit improvement by the addition of a partial absorber, we performed 1,000 simulations of both models following the LRT test shows that for 89% of the simulations, the fit improves with the extra, partial covering absorber (see Fig. 3).
As an alternative, the second model consists of a multi-temperature cooling flow, again observed through both simple and partial covering absorbers. The X-ray spectrum was harder and the flux was higher for 4060 than for 4050. This is reflected in the higher NH,22 (absorbing column in units of 1022 cm-2) and covering fraction obtained using the first scenario, and the higher temperature obtained for the second scenario.
3.2 Timing analysis
Significant stochastic variability of the the X-ray flux on short (minutes to hours) time scales is a hallmark of accretion disks in binary systems. Periodic modulation, on the other hand, indicates that the accretion is channeled by an strong magnetic field (e.g. Z And Sokoloski et al., 2006). We searched for periodic variations in the X-ray flux from our 5 targets, using light curves binned at 16 s and the Lomb-Scargle algorithm. No periods with a p-value0.3 were found for the sources in our sample. We used the ratio between the observed and expected rms variabilities ( and , respectively) to quantify stochastic variations in the light curves. We binned the light curves at integer multiples of the XIS readout time: 16, 160, 1600, and 3680 seconds, and calculated the ratio (see Table 3). Only 4 Dra showed significant variability, with amplitudes as high as 40%; the strongest flickering was present on time scales of hours, but there was also intense flickering on time scales of minutes, consistent with previous determinations (Wheatley et al., 2003).
| Object | Bin size [s] | sexp | s | Ratio | |
|---|---|---|---|---|---|
| Hen 3-1591. | 160 | 0.05 | 0.05 | 1.02 | |
| 4 Dra(4050). | 160 | 0.05 | 0.17 | 3.32 | |
| 4 Dra(4060). | 160 | 0.08 | 0.39 | 4.72 | |
| CD-28 3719. | 1600 | 0.01 | 0.01 | 1.08 | |
| Hen 3-1591. | 1600 | 0.02 | 0.03 | 1.30 | |
| 4 Dra(4050). | 1600 | 0.02 | 0.14 | 7.27 | |
| 4 Dra(4060). | 1600 | 0.03 | 0.33 | 10.26 | |
| CD-28 3719. | 3680 | 0.01 | 0.01 | 1.24 | |
| EG And. | 3680 | 0.01 | 0.01 | 1.18 | |
| 4 Dra(4050). | 3680 | 0.01 | 0.14 | 9.05 | |
| 4 Dra(4060). | 3680 | 0.02 | 0.32 | 13.71 |
4 Discussion
The X-ray emission in all five symbiotic stars observed with Suzaku is consistent with a thermal origin, indicating the presence of shocked gas. We can use the derived temperature of this gas to infer the physical mechanism responsible for its production. In the case of X-rays from colliding winds (-type emission), the post-shock temperature is related to the velocity difference between the two winds fast and slow () by the Rankine-Hugoniot strong shock conditions:
| (1) |
where is the post-shock temperature, the mean molecular weight, and is the mass of a hydrogen atom.
Temperatures higher than kT 1–2 keV are difficult to explain with this mechanism, since there is little evidence of outflows with velocities 1000 km s-1 in symbiotic stars. If the emission instead originates in the accretion disk boundary layer (the assumed origin of -type emission), then the temperature of the shocked gas is set by the gravitational potential of the WD, and can be used to infer the mass of this. Assuming accretion through a disk, then the velocity at the boundary layer is set by the inner Keplerian condition, and a lower limit on the mass can be calculated as follows:
| (2) |
where is the gravitational constant and is the radius of the WD, calculated using the mass-radius relation of Pringle & Webbink (1975). The mass derived in this way should be considered only a lower limit because additional cooling mechanisms could be at play in the boundary-layer region. One source of cooling that could be relevant for these systems is Compton cooling via UV photons from any optically thick portion of the boundary layer. This mechanism has been invoked in dwarf novae in outburst (Fertig et al., 2011) and in the recurrent nova RS Oph after its 2006 outburst (Nelson et al., 2011).
4.1 CD-28 3719
CD-28 3719 was detected in the X-rays for the first time in a short pointing observation with Swift, and in Paper I we classified its spectrum as -type. The Suzaku spectrum also shows the presence of hard, optically thin thermal X-ray emission observed through strong absorption, still compatible with a -type symbiotic. Using the plasma temperature from the cooling flow model to constrain the WD mass, we obtain . CD-28 3719 seems to be the most stable source in our sample.
4.2 Hen 3-1591
Only two objects were classified by Mürset et al. (1997) as -type symbiotics based on their emission detected with ROSAT: GX 1+4 and Hen 3-1591. These observations had a limited signal-to-noise ratio, but Mürset et al. (1997) speculated that these sources harbored neutron stars as accretors. Lately, this type of symbiotic was named “symbiotic X-ray binaries” by Masetti et al. (2007).
Our best-fit model for Hen 3-1591 (catalog ), which consists of a thermal plasma rather than a power-law, points to the presence of a WD as the accreting compact object instead of a neutron star, i.e. Hen 3-1591 (catalog ) is a WD symbiotic instead of a symbiotic X-ray binary as previously thought. Evidence supporting this scenario also comes from the optical spectrum, which shows many emission lines of a variety of ions, similar to that of a planetary nebula, where the strong UV radiation field from the WD photoionizes the surrounding nebula. Hedrick & Sokoloski (2004) detected flickering behavior in the B band emission from this object, which suggests that the blue light is from an accretion disk. Hen 3-1591 belongs to a rare subclass of -type yellow symbiotics, with a dusty IR continuum and located in the Galactic disk, so low metallicity is not implicated. They are interpreted as systems in which the hot component has recently evolved from the AGB to the WD stage. In this interpretation, the dust is from the mass lost by the AGB star, and the nebulosity is in fact the planetary nebula (PN), and neither is due to the present-day giant (see Jorissen et al. 2005 and references therein). This symbiotic system could therefore be in some ways comparable to the well-known classical novae GK Per (Bode et al., 1987) and V458 Vul (Wesson et al., 2008), both of which have been claimed to be classical novae inside PNe. These systems are all quite special if the PNe phase is as short as thought (10-20 kyr; Badenes et al., 2015).
Hen 3-1591 also shows the barium syndrome, i.e. overabundances of -process elements and the presence of singly-ionized barium, which cannot be explained unless the red giant is part of a binary system (Jorissen & Mayor, 1992; Jorissen et al., 2005). The now-observed red giant had its photosphere polluted by -processed elements by the previously-AGB companion, which now should be a WD. Thus, our high signal-to-noise, broadband Suzaku spectrum adds more support to the presence of a WD or hot subdwarf in Hen 3-1591 (catalog ). If we use the maximum plasma temperature from the cooling flow model to constrain the WD mass, we obtain M0.45 M⊙.
The high temperature of the plasma strongly suggests that in Hen 3-1591 the X-ray emission arises in an accretion disk boundary layer instead of a colliding wind region. The strong-shock condition implies wind speeds of around 3,000 km s-1 for the observed temperatures, and such high-speed outflows or winds have not been detected in Hen 3-1591 or almost any other symbiotic. The lack of UV data does not allow us to use the ratio of UV and X-ray fluxes as a proxy for the optical depth of the boundary layer. The decrease in temperature and luminosity between the ASCA and Suzaku observations, however, suggests that the optical depth of the X-ray emitting plasma changed, being higher during the Suzaku observation. Suzaku might thus have observed a smaller optically thin portion of the boundary layer.
4.3 Hen 3-461
Hen 3-461 was discovered in X-rays with Swift during a short pointing observation (Paper I). The high temperature and absorption obtained from modeling those data, the hardness ratio (defined as the ratio of count rates in the 2.4-10/0.3-10 keV ranges) and the presence of significant flickering in the UV, all suggested that the X-ray emission originated in the boundary layer of the accretion disk and led us to classify it as a -type source.
Our Suzaku observation indicates two important changes since the Swift observation: increased absorption towards the hard X-rays from the boundary layer, and the appearance of a new, softer -type component below 2 keV. Thus, the source show us a type spectra.
The intrinsic X-ray luminosity decreased by about 30% between the Swift observation in 2010 and the Suzaku observation in 2012 December. Although no contemporaneous UV data are available, GALEX (NUV) observations taken one year before our Suzaku observation indicate that FUV=1.8610-12 erg cm-2 s-1, so that FUV/F 0.7 (we quote a lower limit as the reddening for this source is unknown). Thus the accretion disk boundary layer seems to be still in the optically thin regime. In Paper I we proposed a scenario in which the soft emission of -type objects could be related to a colliding wind region or jets. We could be witnessing the injection of new flows into a colliding wind region. The equivalent width of the (unresolved) Fe K region of around 400 eV resembles the values found by Mukai et al. (2007) on the well-known jet-source with a two component X-ray spectra, CH Cyg.
4.4 EG And
In the V band, EG And is one of the brightest symbiotic systems. Its distance is 512168 pc (van Leuween, 2007). The periodic photometric modulation indicates an orbital period of 470 days with an inclination of 82 degrees (Kolb et al., 2004), making EG And an eclipsing symbiotic binary.
Based on the high temperature ( keV) found for the X-ray emitting plasma (see Table 2), we can estimated a M0.4 M⊙ and rule out colliding winds as the source of X-rays in EG And. This source was identified as a -type symbiotic by Mürset et al. (1997). Those authors derived a temperature for the X-ray emitting plasma of 0.5 keV using ROSAT PSPC data — much lower than the temperature from our model of the Suzaku spectrum. The difference is most likely due to the lack of sensitivity above 2 keV of the ROSAT spectrum. The velocity implied by the best fit to the Suzaku spectrum is 1200km s-1 which is significantly faster than the highest velocity line features (700 km s-1, C IV 1548, 1550Å absorption features) found in UV spectra from FUSE and STIS by Crowley et al. (2008), and difficult to explain with outflows from a low mass WD like the one in EG And by Kolb et al. (M0.4 M; 2004).
If the hot-component luminosities reported in the literature (16-400 ; Vogel et al., 1992; Kolb et al., 2004) are due to an accretion-powered WD, then the implied accretion rates are in the range 10-8 to 10-7 M⊙ yr-1 for a 0.4 M⊙ WD. This is squarely in the regime where the boundary layer is expected to be optically thick according to models by Popham & Narayan (1995). The X-ray luminosity is orders of magnitude lower than , suggesting that the X-rays are produced in a region that remains optically thin at the outer surface of the mostly optically thick boundary layer. Although we expect X-ray emission due to accretion to be highly variable, EG And is very faint, and we do not detect enough photons to be sensitive to low-level variability ( 50%).
4.5 4 Dra
Although 4 Dra was classified as a triple system consisting of 4 Dra(A) + CQ Dra(Bab) by Reimers (1985), X-ray data obtained with ROSAT led Wheatley et al. (2003) to suggest that the X-ray emission is consistent with the presence of a WD accreting from the wind of a red giant. IUE data led Skopal (2005) to the same conclusion after fitting the SED. More evidence against the triple-system nature of 4 Dra comes from the analysis of the broad wings superimposed upon narrow emission lines in FUSE spectra by Froning et al. (2012), who found the FUSE spectra to be similar to other FUSE spectra of confirmed symbiotic stars. Based on the previous studies and current results, when modeling the Suzaku spectra, we considered this source to be a symbiotic system with an accreting WD.
This source is one of the two systems with Hipparcos distances in our sample, having =19017 pc (van Leuween, 2007). Its optical brightness presents irregular variations of about 0.1 mag in V (Eggen, 1967), and radio flux variations also occur on time scales of weeks to months and maybe shorter than hours to days (Brown, 1987).
Our Suzaku observations of 4 Dra shows strong variability, a high , and X-ray luminosities in the range of 0.01 L⊙. If considered along with previous UV luminosity estimates of L10 by Skopal (2005), our findings suggest that 4 Dra is an accretion-powered symbiotic (i.e., no quasi-steady shell burning on the surface of the WD) in which mass is transferred at 10-8 M⊙ yr-1.
In such a case, the bulk of the boundary layer luminosity is emitted in the soft X-rays or EUV and is unobservable at Earth, while the remaining optically thin part of the boundary layer emits faint hard X-rays (Patterson & Raymond, 1985). Our inference that the boundary layer is optically thick enables us to estimate the mass of the WD. Popham & Narayan (1995) suggest that the accretion rates needed to produce a predominantly optically thick boundary layer around WDs of masses 1.0, 0.8, and 0.6 M⊙ are greater than 10-7, a few times 10-8, and 10-8 M⊙ yr-1, respectively. Taking the UV flux at the time of the Suzaku observation to be comparable to the 10 L⊙ detected by IUE, the BL being optically thick suggests that the WD mass is less than about 0.6 M⊙ (the IUE luminosity corresponds to an accretion rate of 10-8 M⊙ yr-1).
We emphasize that our conclusions about the optical depth of the accretion disk boundary layer and its implications for the WD mass depend on the assumed viscosity parameter, , and other assumptions used in the models described by Popham & Narayan (1995). As noted in Paper I, a 30% change in leads to a factor of a few change in the threshold accretion rate above which the boundary layer is expected to become optically thick. Allowing for this, the WD in 4 Dra probably has a mass less than about 0.7 M⊙, still a low-mass WD.
Both fitting approaches discussed in Section 3.1.5 yield equally possible scenarios for 4 Dra. In the case that both spectra are modeled independently, the measured temperatures could be different because the optical depth of the emitting region changed, i.e. during the earliest observation the boundary layer was more optically thick, and the measured temperature and fluxes of the X-ray emitting plasma were lower. On the other hand, if we assume that during both observations the plasma temperature was the same (the optical depth of the boundary layer did not change between observations), we still obtain acceptable fits with an increase in the amount of absorbing material and intrinsic X-ray luminosity between the two observations, perhaps due to an increase in the accretion rate.
From the values of absorbing column listed in Table 2, we conclude that the absorbing material is located relatively near the WD. The orbital solution for 4 Dra was studied by Famaey et al. (2009), who used the radial velocities of the M giant to find a 17033 day period, an eccentric orbit (=0.3), and T0[MJD]= 5320419. The ROSAT observations thus occurred at orbital phases =0.33, 0.15 and 0.61, while Suzaku observed at =0.23 and =0.57. If the X-ray absorbing material is tied to the orbital motion of the WD, the absorbing columns obtained from the fits of the Suzaku observations should not be very different, given that during ObsID 4050 the system was near quadrature, while during ObsID 4060 the WD was in inferior conjunction. In that picture, the second observation (4060) taken during the inferior conjunction should even be somewhat less absorbed, which is not the case. It is therefore probably intimately connected with the physics of accretion rather than to the orbit and the red giant companion.
5 Conclusions
We analyzed the deep, broad-band Suzaku observations of five symbiotic stars previously known to be X-ray sources. In contrast to observations obtained with ROSAT, which had limited energy coverage, or those obtained with Swift, which had limited continuous observing time, the spectra obtained with Suzaku allowed us to better unveil the origin of the X-ray emission in symbiotics. The high temperatures of the plasma of a few keV (see Table 2) imply shock speeds of more than a thousand km s-1 (assuming strong shock conditions). Given that such high-speed outflows are not typically observed in symbiotic stars, this finding strongly suggest that the emission originates in an accretion disk boundary layer rather than a colliding-wind region.
The high temperatures are roughly consistent with shock-heated gas at the virial temperature in the deepest portion of the WD potential well, suggesting that Compton cooling of the plasma in the boundary layer is not an important source of cooling.
As discussed in Paper I, Compton cooling of the post-shock region could be important if there is a source of abundant UV photons, high local accretion rate, and a relatively massive WD. The low UV luminosities from the sources presented here indicate that shell-burning on the WD surface is not important, and thus the conditions for prevalent Compton cooling are not satisfied.
In Paper I, we proposed a new classification system for the X-ray emission from symbiotic stars, in which the category was assigned to those sources with a high absorbing column ( a few 1022 cm-2) and thermal X-ray emission with energies above 2.4 keV. The fraction of X-ray emission radiated in this hard regime (see Fig. 4 in Paper I) may vary between different observations of the same source.
We calculated the hardness ratios (HR) as defined in Paper 1 using the Suzaku data or folding our best-fit models through the Swift/XRT responses. In both cases, we found that except for CD -28 3719, all sources observed with Suzaku have HR 1. In fact, for Hen 3-461 and CD -28 3719, the HRs changed dramatically between the first observations with Swift and the observations with Suzaku. Figure 4 in Paper 1 showed that during the Swift observations, all -type sources had HR 1. The fact that we observed most sources to have HR 1 indicates that while the components in the Luna et al. sample were all heavily absorbed, this is not universally true of all components; in this study, Hen 3-1591, EG And, and 4 Dra were all lightly absorbed and detected below 1 keV.
When compared with earlier data, all sources show changes in their intrinsic X-ray flux and NH. Taking -type X-ray emission to originate in the accretion disk boundary layer, long term changes in the X-ray flux are mostly related to changes in the accretion rate onto the WD, while changes in the soft X-rays can also be caused by variations in the amount of absorbing material.
The days-to-week time scale changes in NH observed in the -type prototype RT Cru (Luna & Sokoloski, 2007; Luna et al., 2010) suggest that the absorber in that system is located close to the WD. However, it is unclear if these changes are related to the amount of material flowing through the accretion disk, and if so, how. In this study, we witness that although high flux states have high NH in the cases of CD -28-3719 and 4 Dra, in the case of Hen 3-461, NH is higher now while FX is lower than when it was observed with Swift (see Table 2 in Paper I).
Of the five sources observed with Suzaku, CD -28 3719 retains its previous classification as a -type source (see Paper I), as derived from Swift observations. The proposed WD nature of the compact object in Hen 3-1591 and the temperature of the X-ray emitting plasma suggest that it should now be considered a -type source instead of -type source (those symbiotics with neutron stars as compact objects; see Mürset et al., 1997). The likely presence of a new soft component in the X-ray spectrum of Hen 3-461 encourages us to propose a -type classification for that object. No X-ray spectral type has previously been proposed for 4 Dra, and given the results obtained from our spectral fit, we advocate for a -type categorization. Finally, the low X-ray temperature derived for EG And which is consistent with the low mass estimate based on spectroscopy by Kolb et al. (2004) within the uncertainties on kT and the broadband energy coverage now shows that EG And should be considered a -type instead of -type source as originally proposed by Mürset et al. (1997).
References
- Abdo et al. (2010) Abdo, A. A., Ackermann, M., Ajello, M., Atwood, W. B. et al., 2010, Science, 329, 817
- Ackermann et al. (2014) Ackermann, M., Ajello, M., Albert, A.,et al., 2014, Science, 345, 554
- Badenes et al. (2015) Badenes, C., Maoz, D., Ciardullo, R. 2015, 2015arXiv150201015B
- Belczyński et al. (2000) Belczyński, K., Mikołajewska, J., Munari, U., Ivison, R. J., Friedjung, M. 2000, A&AS, 146, 407
- Bode et al. (1987) Bode, M. F., Roberts, J. A., Whittet, D. C. B., Seaquist, E. R., Frail, D. A., 1987, Nature, 329, 519
- Brocksopp et al. (2004) Brocksopp C., Sokoloski, J. L., Kaiser, C., et al. 2004, MNRAS, 347, 430
- Brown (1987) Brown, A. 1987, ApJ312, L51
- Cash (1979) Cash, W. 1979, ApJ, 228, 939
- Crocker et al. (2001) Crocker, M. M., Davis, R. J., Eyres, S. P. S., et al. 2001, MNRAS, 326, 781
- Crowley et al. (2008) Crowley, C., Espey, B. R., McCandliss, S. R. 2008, ApJ, 675, 711
- Eggen (1967) Eggen, O. J. 1967, Astrophysical Supplement Series, 14, 307
- Famaey et al. (2009) Famaey, B., 2009, A&A, 498, 627
- Fertig et al. (2011) Fertig, D., Mukai, K., Nelson, T. & Cannizzo, J. K. 2011, PASP, 123, 1054
- Froning et al. (2012) Froning, C. S. et al., 2012, ApJS, 199, 7
- Hedrick & Sokoloski (2004) Hedrick, C., Sokoloski, J. 2004, BAAS, 36, 1525
- Kellogg et al. (2007) Kellogg, E., Anderson, C., Korreck, K., et al., ApJ, 664, 1079
- Jorissen & Mayor (1992) Jorissen, A., Mayor, M., International Astronomical Union Supplement, 151, 407
- Jorissen et al. (2005) Jorissen, A., Zacs, L., Udry, S., Lindgren, H. & Musaev, F.A. 2005, A&A, 441, 1135
- Kennea et al. (2009) Kennea, J.,Mukai, K., Sokoloski, et al., 2009, ApJ, 701, 1992
- Kenyon (1986) Kenyon, S. J. 2009, The Symbiotic Stars, 1st edition, Cambridge University Press
- Kolb et al. (2004) Kolb, K. M., J. Sion, E. M., Mikołajewska, J. 2004, AJ, 128, 1790
- Koyama (2007) Koyama, K., Tsunemi, H., Dotani, T., et al. 2007, PASJ, 59, 23
- Luna & Sokoloski (2007) Luna, G. J. M. & Sokoloski, J. L. 2007, ApJ, 671, 741
- Luna et al. (2008) Luna, G. J. M., Sokoloski, J., Mukai, K., 2008, Astronomical Society of the Pacific, 401, 342
- Luna et al. (2010) Luna, G.J.M., Sokoloski, J., Mukai, K. & Nelson, T. 2010, Astronomer’s Telegram #3053, http://www.astronomerstelegram.org/?read=3053
- Luna et al. (2013) Luna, G. J. M., Sokoloski, J. L., Mukai, K. & Nelson, T., 2013, A&A, 559, 6
- Masetti et al. (2007) Masetti, N.; Rigon, E.; Maiorano, E. et al., 2007a, A&A, 464, 277
- Mürset et al. (1997) Mürset, U., Wolf, B. & Jordan, S. 1997, A&A, 319, 201
- Mukai et al. (2007) Mukai, K., Ishida, M.; Kilbourne, C., et al., 2007, PASJ, 59, 177
- Nelson et al. (2011) Nelson, T., Mukai, K., Orio, M., Luna, G. J. M. & Sokoloski, J. L, 2011, ApJ, 737, 7
- Nuñez at al. (2014) Nuñez, N. E., Luna, G. J. M., Pillitteri, I., Mukai, K., 2014, A&A, 565, A82
- Ochsenbein, Bauer & Marcout (2000) Ochsenbein, F.; Bauer, P. & Marcout, J. 2000, A&ASS,143, 23
- Patterson & Raymond (1985) Patterson, J.; Raymond, J. C. 1985, ApJ, 292, 550
- Popham & Narayan (1995) Pophan, R. & Narayan, R. 1995, ApJ, 442, 337
- Pringle & Webbink (1975) Pringle, J. E. & Webbink, R.F. 1975, MNRAS, 172, 493
- Protassov et al. (2002) Protassov, R., van Dyk, D. A., Connors, A. et al., 2002, ApJ,571,545
- Reimers (1985) Reimers, D. 1985, A&A, 142L, 16
- Seaquist & Taylor (1990) Seaquist, E. R., Taylor, A. R, 1990, ApJ, 349, 313
- Seaquist et al. (1993) Seaquist E. R., Krogulec, M., Taylor, A. R, 1993, ApJ, 410, 260
- Skopal (2005) Skopal A., 2005, A&A, 440, 995
- Sokoloski et al. (2006) Sokoloski, J. L., Kenyon, S. J., Espey, B. R., et al., ApJ, 636, 1002
- Tanaka et al. (1994) Tanaka, Y., Inoue, H. & Holt, S.S. 1994, PASJ, 46, L37
- van Leuween (2007) van Leuween, F. 2007, A&A, 474, 653
- Verner & Yakovlev (1996) Verner, D. A. & Yakovlev, D. G. 1995, A&AS, 109, 125
- Vogel (1991) Vogel, M., 1991, A&A, 249, 173
- Vogel et al. (1992) Vogel, M., Nussbaumer, H., Monier, R. 1992, A&A, 260, 156
- Wesson et al. (2008) Wesson, R., Barlow, M. J., Corradi, et al. 2008, ApJ, 688, L21
- Wheatley et al. (2003) Wheatley, P. J., Mukai, K., de Martino, D. 2003, MNRAS, 346, 855
- Wilms et al. (2000) Wilms, J., Allen, A. & McCray, R. 2000, ApJ, 542, 914