Imprints of a high velocity wind on the soft x-ray spectrum of PG1211+143
Abstract
An extended XMM-Newton observation of the luminous narrow line Seyfert galaxy PG1211+143 in 2014 has revealed a more complex high velocity wind, with components distinguished in velocity, ionization level, and column density. Here we report soft x-ray emission and absorption features from the ionized outflow, finding counterparts of both high velocity components, v0.129c and v0.066c, recently identified in the highly ionized Fe K absorption spectrum. The lower ionization of the co-moving soft x-ray absorbers imply a distribution of higher density clouds embedded in the main outflow, while much higher column densities for the same flow component in the hard x-ray spectra suggest differing sight lines to the continuum x-ray source.
keywords:
galaxies: active – galaxies: Seyfert: quasars: general – galaxies: individual: PG1211+143 – X-ray: galaxies1 Introduction
The narrow-line Seyfert galaxy PG1211+143 is widely associated with ultra-fast, highly ionized outflows (UFOs), since the first detection in a non-BAL (broad absorption line) AGN (active galactic nucleus) of strongly blue-shifted absorption lines of highly ionized gas, corresponding to a sub-relativistic outflow velocity of 0.150.01c (Pounds et al. 2003, Pounds and Page 2006). Archival data from XMM-Newton and Suzaku have since shown similar UFOs are relatively common in nearby, luminous AGN (Tombesi et al. 2010, 2011; Gofford et al. 2013).
The frequency of these detections confirms a substantial covering factor - and hence significant mass and momentum in such winds,with the potential to disrupt star formation in the host galaxy. That realisation has led to the view (e.g. King 2003, 2010) that powerful AGN winds could explain the remarkable correlation of the supermassive black hole mass and the velocity dispersion of the host galaxy’s stellar bulge in a wide range of galaxies, the so-called M– relation (Ferrarese and Merritt 2000, Gebhardt et al. 2000).
It is noteworthy that the great majority of UFO detections (defined in Tombesi et al. 2010 with an outflow velocity v 10000 km s-1; 0.03c) are based on blue-shifted absorption lines being identified with resonance transitions in Fe XXV and XXVI ions. The high ionization state has made absorption features difficult to detect in the soft x-ray region covered by higher resolution grating spectrometers on XMM-Newton and Chandra. A recent exception came from a re-analysis of the 2001 Reflection Grating Spectrometer (RGS: den Herder 2001) data of PG1211+143, where a wavelength-to-velocity transformation was used to combine Lyman- absorption lines of several lower mass ions, finding compelling evidence for a soft x-ray UFO, with a Doppler-corrected velocity v0.076c, a factor 2 less than that for the highly ionized flow (Pounds 2014). That lower velocity was confirmation of a second ionized absorption component required in a partial covering analysis of the combined 2001, 2004 and 2007 XMM-Newton broad band spectra of PG1211+143 (Pounds and Reeves 2009), where modelling of continuum curvature made the outflow velocity poorly constrained.
To further explore the velocity and ionization structure of the fast wind in PG1211+143, an extended XMM-Newton observation was carried out during 7 spacecraft orbits between 2014 June 2 and July 9. On-target exposures for individual orbits ranged from 50 to 100 ks, with a total duration of 630 ks. Full details of the XMM-Newton observing log and data processing are given in Lobban et al.(2016), reporting the results of a detailed timing analysis.
Pounds et al. 2016 (hereafter Paper 1) present an analysis of the hard x-ray spectrum, based on data from the pn camera (Strueder 2001), revealing new spectral structure in Fe K absorption lines, and dual velocities (v0.066c and v0.129c) in the highly ionized wind. The present paper reports a corresponding analysis of the 2014 soft x-ray spectrum of PG1211+143 using data from the RGS.
We assume an AGN redshift of (Marziani et al. 1996). Spectral fitting is based on the XSPEC package (Arnaud 1996) and includes absorption due to the line-of-sight Galactic column of =3 (Murphy et al. 1996, Willingale et al.2013). 90 % confidence intervals on model parameters are based on . Estimates for the black hole mass in PG1211+143 range from (Kaspi et al. 2000) to (Bentz et al. 2009), with the lower value making the historical mean luminosity close to Eddington. All quoted velocities are corrected for the relativistic Doppler effect.
2 Soft X-ray absorption and emission from circumnuclear photoionized gas
The composite 2014 RGS spectrum was produced by summing both RGS 1 and RGS 2 data over all 7 XMM-Newton orbits with the SAS tool RGScombine, for a combined exposure of 1.27 Ms. For spectral modelling, the data were binned to a minimum of 25 counts per bin compatible with use of the statistic, with the additional constraint that no bin be narrower than 1/3 of the mid-band FWHM resolution (Kaastra and Bleeker 2016).
Before attempting to model soft x-ray absorption and emission spectra we first fit the underlying soft X-ray continuum by extending the continuum model found in Paper 1, consisting of a hard and a soft power law, with the addition of a blackbody to match the soft excess. The soft power law component was required in Paper 1 by inter-orbit difference spectra, represented over the 2–10 keV spectral band by an unabsorbed power law of photon index 2.9, and that continuum component was affirmed in the soft x-ray spectrum, finding inter-orbit difference spectra described by a power law of index 2.80.1. Such a steep continuum component has the potential to substantialy dilute the imprint of photoionized gas on the overall soft x-ray spectrum and is included here in modelling spectral features in the 2014 RGS data.
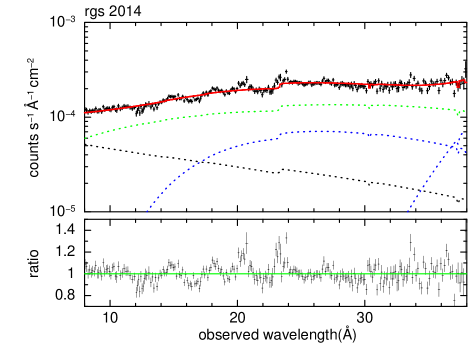
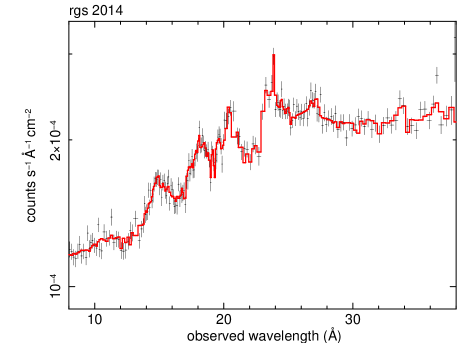
Figure 1 illustrates the resulting continuum model for the stacked RGS data over the full 8–38 Å waveband, with the corresponding data-model ratio indicating positive and negative residuals suggestive of significant absorption and emission from circumnuclear ionized gas. A measure of that spectral structure is given by the fit statistic of 1251/721.
2.1 Spectral modelling from 12–30 Å with photoionized absorption and emission spectra
We begin spectral modelling over the 12–30 Å waveband where the data are of the highest statistical quality and the continuum fit gives a measure of spectral structure with of 834/452. Publicly available photoionized grids computed for a power law = 2 ionizing continuum 111ftp://legacy.gsfc.nasa.gov/software/plasma_codes/xstar.xspectables failed to fit strong Fe UTA absorption at 16–17 Å without an unrealistically high Fe abundance. Since absorption modelling can be highly sensitive to the form of the photoionizing continuum (e.g. see Reeves et al. 2013), we therefore generated a self-consistent set of multiplicative absorption and additive emission grids using the XSTAR v2.2 code (Kallman et al. 1996), with the spectral energy distribution (SED) of PG1211+143 based on concurrent data from the Optical Monitor (Mason et al.2001) and EPIC-pn cameras, extrapolated from 1-1000 Rydberg. The SED, described in more detail in Lobban et al.(2016), is represented by a double-broken power-law, where the OM data have been corrected for reddening (E(B-V) = 0.035).
The new XSTAR grids were computed in 10000 spectral bins between 0.1-20 keV, with an ionizing luminosity (1–1000 Ryd) of 3.8 erg s-1 based on the SED fit, and over a range in ionization log = 0-4 (where = Lion/n r2) and column density = cm-2. Solar abundances were adopted for abundant elements (Grevesse & Sauval 1998), with additional grids computed for 3- and 5-fold over abundances of Fe. In each case grids were generated with turbulence velocities of = 300, 1000 and 3000 km s-1, and for each multiplicative absorption grid (mtable) we generated a corresponding emission grid (atable).
Absorption grids with a modest over-abundance of Fe were found to give the best fit to the mean 2014 RGS spectrum, and the present analysis is based on a 3-times-solar Fe abundance, with a turbulent velocity of 300 km s-1 for the absorber and 1000 and 3000 km s-1 for low- and high-ionization photoionized emission, respectively, to encompass velocity broadening. Free parameters in the absorption spectra are column density, ionization parameter, and outflow (or inflow) velocity in the AGN rest frame. For the emission spectra the column density is fixed at a suitably low value ( = 1020 cm-2)to avoid significant opacity effects, with the ionization, flux level and velocity as free parameters.
The full xspec model is TBabs*((po1 + bbody)*mt + at + po2), where components ’mt’ and ’at’ represent the mtable and atable grids of pre-computed photoionized absorption and emission spectra. Po2 represents the unabsorbed power law and TBabs the Galactic absorption. The absorbed power law has photon index (=1.67) tied to the value found in the pn analysis, with a single blackbody of kT0.1 keV completing the soft excess at 12–30 Å.
The addition of a single photoionized absorber greatly improved the 12-30 Å spectral fit ( of 681/451), for an ionization parameter log =1.640.06, absorption column density = 5.00.6 cm-2 and outflow velocity 0.0610.001c, close to the lower of the dual velocities reported in Paper 1. Adding a photoionized emission spectrum, with tied ionization parameter, produced a further substantial improvement to the fit ( of 601/449), with the linked ionization parameter increasing to log =1.77 0.05, and the absorber column falling slightly to = 4.30.6 cm-2. The absorber outflow velocity was unchanged, while the integrated emission spectrum had a much lower outflow velocity in the AGN rest frame.
The interaction of emission and absorption grids can be partly understood by the effects of self absorption in resonance lines, while correctly modelling emission spectra also ensures a more accurate fit to the intrinsic continuum. Joint emission and absorption modelling also played a key role in analysis of the complex Fe K absorption spectrum reported in Paper 1, and underlines the importance of including both emission and absorption spectra in outflow studies of high quality data.
The addition of a second ionized absorber gave a further substantial improvement to the 12–30 Å spectral fit ( of 569/446), with an ionization parameter log =1.80.1, absorption column density ( = 2.10.5 cm-2) and a significantly higher outflow velocity of 0.0770.001c. A second emission spectrum with tied ionization parameter yielded only a small further improvement in the spectral fit ( of 561/444).
Addition of the second absorber had the ancillary effect of reducing the ionization parameter of the first - lower velocity - absorber to log =1.330.08, with a further decrease in column density to = 3.90.6 cm-2. While a second tied emission component had little effect, de-coupling the ionization parameters of both emission and absorption spectra did yield a further significant improvement in the fit ( of 534/442), with the emission components now covering a wider range of ionization. Table 1 summarises the parameters of this best-fit 12–30 Å model, including the luminosities added/extracted by the respective ionized emission/absorption spectra.
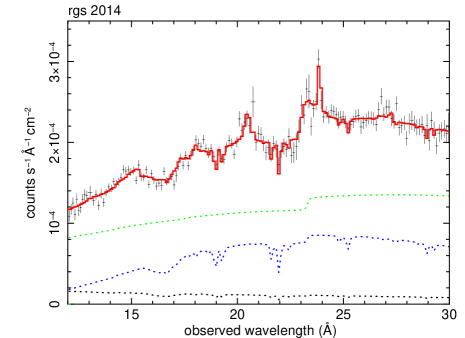
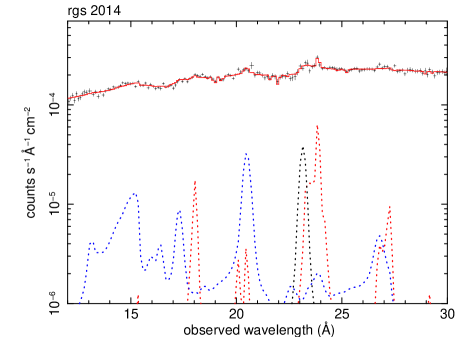
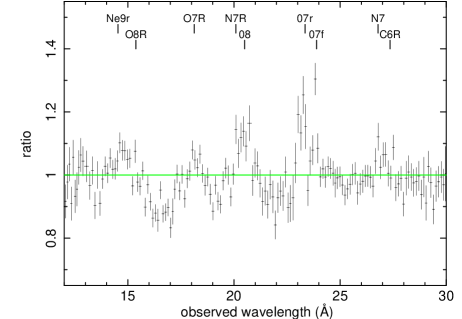
Figure 2 illustrates different aspects of the 12–30 Å spectral fit. The top panel compares the data and final model, together with the three continuum components, unabsorbed power law (green), hard power law (dark blue) and black body (light blue). Absorption over most of the RGS waveband is seen to predominently affect the black body emission component, representing the ’soft excess’, a point which may be important in comparing the column density of similar flows measured in soft and hard x-ray spctra (see Section 6).
Strong absorption features include the Fe-M UTA at 16–17 Å (Behar et al. 2001), and resonance absorption in OVIII Lyman- and the OVII triplet observed at 19 Å and 22 Å, respectively. We find in Section 4 that the twin lines apparent in each resonance transition correspond to the distinct velocities found in the xstar modelling (Table 1). In turn, both low velocity outflow components contribute to the strong Fe UTA, with a fit limited to the 14–18 Å waveband confirming both velocities are required (see also Appendix). We note this finding differs from that in the deep Chandra observation of NGC 3783, where Holczer et al.(2005) found the Fe M-shell absorber to be separated from the main outflow and essentially stationary.
| component | log | () | v | Labs/em | |
|---|---|---|---|---|---|
| absorber 1 | 1.350.09 | 3.60.7 | 0.0610.001 | 1.5 | 60/3 |
| absorber 2 | 1.80.1 | 1.90.5 | 0.0770.001 | 6 | 23/3 |
| emitter 1 | 1.10.3 | 10 | 0.00160.0005 | 6 | 59/3 |
| emitter 2 | 3.10.3 | 10 | 0.0010.002 | 1.0 | 33/3 |
The modelled photoionized emission spectra are highlighted in the mid panel of Figure 2, and directly compared with the stacked data in the lower panel, where the principal emission features are identified with resonance emission lines and radiative recombination continua (RRC) of the abundant H- and He-like ions of Ne, O, N and C. A more detailed comparison of data and model identifies a relative weakness of the modelled resonance emission in the triplet of OVII, suggesting a missing contribution from photoexcitation (Kinkhabwala et al. 2002) not included in the xstar grids. Adding a Gaussian emission line to the model described above finds a (blue-shifted) line energy of 0.5360.002 keV (23.13 Å) and equivalent width 1.60.4 eV, yielding an improvement in of 22/3.
In summary of Section 2, modelling of spectral structure in the 12–30 Å waveband finds strong evidence for absorption in a photoionized outflow, with velocity components 0.061c and 0.077c, which we assume are blended to match the lower of the dual velocities (v0.066c) identified in the primary highly ionized outflow in the (lower resolution) hard x-ray data (Paper 1).
From the model spectral fit we obtain an overall spectral luminosity in the 12-30 Å waveband of 5.73 erg s-1, with the low ionization absorbers together removing 2.1 erg s-1. The low ionization emission spectrum contributes a luminosity over the same waveband of 6 erg s-1, suggesting a covering factor of that flow component of 30 %. We return to considerations of the energy budget in Section 5.
3 Extending the RGS spectral fit from 8-38 Å waveband
While the lower of the two outflow velocities (v0.066c) reported in Paper 1 may be clearly identified, the higher velocity (v0.129c) seen in the pn data is not detected. Since that difference might be due the faster flow being more highly ionized (as was found in the pn data of Paper 1), and the soft x-ray spectral model developed in Section 2 includes emission but not absorption from highly ionised outflow components,we now extend spectral modelling over the full 8–38 Å waveband shown in Figure 1.
The more extended spectral fit confirms the two absorption components (absorber 1 and absorber 2) listed in Table 1, which are now included with only minor changes in the relevant parameters (abs1 and abs2) in Table 2. Significantly, the increased high energy coverage now also finds highly ionized counterparts of both high velocity outflow components reported in Paper 1. Visual examination of the new spectral model confirms these new detections (abs3 and abs4 in Table 2) are largely due to several strong absorption lines of Fe XVIII – XX and resonance lines of Ne X and Mg XI observed in the 8–14 Å spectral region. The lower panels of Fig.3 illustrate this point.
The extended model of the RGS soft x-ray spectrum now includes both low and highly ionized absorbers with velocities close to those identified in the hard x-ray spectrum reported in Paper 1. In addition to offering compelling support for both those primary (high column) outflow components, the higher resolution grating spectra provide an indication of additional fine structure in the lower velocity flow. Modelling the ionized emission with components of widely differing ionization parameter is a further measure of a complex flow.
A final search for additional absorption components to those noted above, provides evidence for a still higher velocity outflow of 0.1880.001c (abs5 in Table), given added weight as that velocity coincides closely with a marginal detection of a third highly ionized outflow component in the hard x-ray spectrum reported in Paper 1 (see also Appendix).
| comp | log | () | vout/c | Labs/em | |
|---|---|---|---|---|---|
| abs 1 | 1.50.1 | 2.30.4 | 0.0610.001 | 1.6 | 60/3 |
| abs 2 | 1.90.2 | 1.50.5 | 0.0770.001 | 7 | 36/3 |
| abs 3 | 3.00.2 | 136 | 0.1310.001 | 6 | 15/3 |
| abs 4 | 3.20.1 | 2815 | 0.0610.001 | 8 | 18/3 |
| abs 5 | 2.50.1 | 125 | 0.1880.002 | 9 | 18/3 |
| emit 1 | 1.70.3 | 10 | 0.00120.0006 | 9 | 73/3 |
| emit 2 | 2.80.6 | 10 | 0.0020.002 | 3 | 13/3 |
Based on the extended spectral fit, the observed spectral luminosity from 8-38 Å is 9.2 erg s-1, with absorption components 1 and 2, corresponding to the lower of the two velocities found in Paper 1, having removed 2.3 erg s-1, with components 3 an 4, associated with the more highly ionized outflow, removing 2.4 erg s-1. A lower ratio of emission-to-absorption for the highly ionized components may indicate a lower covering factor, or that much of the re-emission lies outside the RGS spectral band. We return to that question in Section 5.
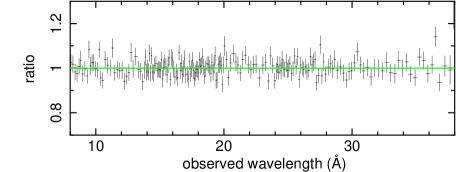
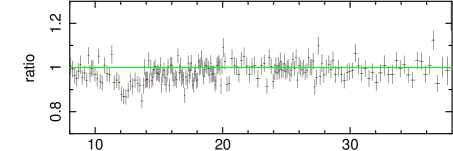
Figure 3 overlays the 2014 RGS data with the final spectral model. Comparison of the data-model residuals with those of Fig. 1 illustrates how the addition of the photoionized absorption and emission spectra detailed in Table 2 greatly improve the overall spectral fit.
4 Identifying individual resonance lines
As noted earlier, the high ionization characteristic of powerful AGN winds renders much of that outflow transparent at soft x-ray energies, while the presence of an unabsorbed continuum component has a further diluting effect on observed soft x-ray absorption features. An added complexity in the soft x-ray spectrum of PG1211+143 is the dominance across parts of the RGS waveband of multiple transitions in Fe-L, including those partially screened by M-shell electrons (the Fe-M UTA, Behar et al. 2001). While the complexity of the Fe-L absorption can be accounted for reasonably well in spectral modelling, it is difficult to reliably identify individual transitions for use in measuring a blue-shift.
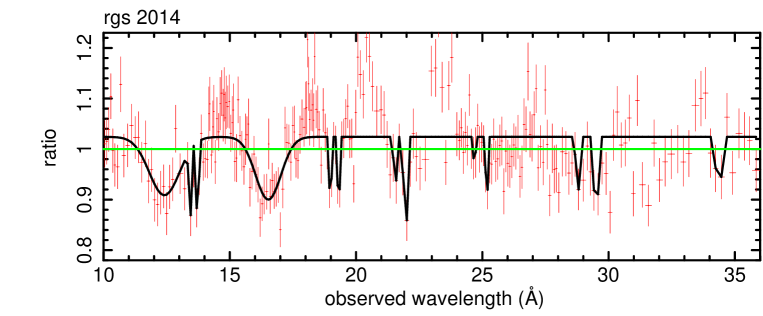
Fortunately, the unusually deep XMM-Newton observation in 2014 has allowed the detection and identification of several absorption lines with physically resonance transitions in Ne, O, N and C (Figure 4). Sequentially stepping through the stacked data with narrow Gaussians of width tied to the mid-band RGS resolution (30 mÅ) yields the observed absorption line wavelengths listed in Table 3, where each line identification provides a corresponding blue-shift and outflow velocity. The 90% confidence error on each wavelength was obtained using the uncertainty command for the relevant Gaussian parameter, which was then carried over to give the listed velocity uncertainty.
| line | lab (Å) | obs (Å) | rest (Å) | vout/c | |
|---|---|---|---|---|---|
| Ne9 He- | 13.447 | 13.410.03 | 12.410.03 | 0.0800.002 | 10/2 |
| Ne9 He- | 13.447 | 13.730.02 | 12.700.02 | 0.0570.002 | 15/2 |
| O8 L- | 18.968 | 18.990.02 | 17.570.03 | 0.0770.002 | 12/2 |
| O8 L- | 18.968 | 19.310.02 | 17.860.03 | 0.0600.002 | 16/2 |
| O7 He- | 21.602 | 21.540.04 | 19.930.03 | 0.0800.003 | 4/2 |
| O7 He- | 21.602 | 21.940.03 | 20.290.03 | 0.0620.002 | 20/2 |
| N7 L- | 24.781 | 24.690.05 | 22.840.03 | 0.0800.003 | 4/2 |
| N7 L- | 24.781 | 25.170.02 | 23.280.03 | 0.0620.002 | 11/2 |
| N6 He- | 28.787 | 28.750.04 | 26.600.03 | 0.0780.003 | 7/2 |
| N6 He- | 28.787 | 29.500.05 | 27.290.03 | 0.0540.003 | 14/2 |
| C6 L- | 33.736 | 34.350.15 | 31.780.03 | 0.0600.004 | 5/2 |
For the 9 lines with of 5 or greater, two distinct velocity groups are found, with weighted mean outflows of v0.0600.002c and v0.0780.002c, in close agreement with the velocities of the two soft x-ray absorbers found in the XSTAR modelling. That agreement provides strong, independent support for those modelled outflow velocities, and correspondingly for the similar low velocity component found in the primary, highly ionized outflow of PG1211+143 reported in Paper 1. The absence of identified absorption lines from the higher velocity outflow (v0.13c) may be understood from the relatively high ionization parameter of that component (abs3 in Table 2), with the strongest absorption falling in the 12–14 Å waveband dominated by Fe-L transitions. This absorption complex is represented by a broad Gaussian in Figure 4, where only two narrow lines are identified, both with NeIX He-. Interestingly, one narrow absorption line at 17 Å does stand out from the broad Gaussian fit to the Fe UTA and we see in the Appendix that this very likely corresponds to OVIII Ly- outflowing at the highest velocity component (abs5) in Table 3.
5 Comparing the soft and hard x-ray spectral models
The above analysis has shown that the dual outflow velocities, of 0.129c and 0.066c, identified in highly ionized absorbing matter in the 2014 pn data (Paper 1) have co-moving counterparts in the soft x-ray RGS spectra, with the higher spectral resolution of the grating spectra suggesting the lower velocity is actually a blend of two components.
As in Paper 1, simultaneous modelling of photoionized emission spectra is found to be important, both in determining the correct absorption parameters of the flow and in showing that a substantial fraction of the absorbed energy is returned via recombination and scattering from an extended outflow. To evaluate the energy budget of this re-processing requires extending the spectral bandwidth beyond that covered by the RGS, not least as the major part of the flow is absorbed only in the higher energy band covered by the EPIC cameras.
A direct comparison with the spectral model obtained from analysis of the simultaneous pn data in Paper 1 shows a good measure of agreement - and some important differences. To that end, the 2–10 keV spectral fit from Paper 1 was extended down to 0.4 keV to overlap the RGS spectrum. In making that extension the soft x-ray continuum was modelled by the addition of a black body component (kT0.1 keV), with soft x-ray absorption and emission requiring additional emission and absorption grids compared with Paper 1.
The extended 0.4–10 keV pn spectral fit remained remarkably good ( of 1783/1676), with the emission and absorption parameters listed in Table 4.
Comparison of the low ionization absorbers in Tables 2 and 4 tests the conjecture that abs3 in Table 4 encompasses both abs1 and abs2 absorbers in the RGS spectra, with the velocity of v0.066c being a blend of two outflow components unresolved in the CCD data. Similar absorbed luminosities and column densities of the low ionization absorbers in the RGS and extended pn spectral models are now seen to support that view.
More surprising is the large difference in the column densities of highly ionized absorbers with the same velocity, but measured against the soft x-ray continuum (Table 2, abs3 and abs4) as compared with the hard x-rey spectrum (Table 4, abs1 and abs2). In Section 6 we suggest an explanation in terms of different sight lines through the same outflow component, with potential to explore the x-ray source geometry.
| comp | log | () | vout/c | Labs/em | |
|---|---|---|---|---|---|
| abs 1 | 3.950.25 | 3624 | 0.1290.002 | 6 | 19/3 |
| abs 2 | 3.500.07 | 209 | 0.0660.002 | 1.2 | 41/3 |
| abs 3 | 1.70.2 | 0.050.02 | 0.066 (t) | 1.4 | 24/3 |
| emit 1 | 3.470.05 | 1 | 0.0070.004 | 1 | 22/2 |
| emit 2 | 1.460.07 | 0.1 | 0.0020.002 | 1.3 | 15/2 |
An indication of the large covering factor of the outflow in PG1211+143 is now best measured from the broad band 0.4-10 keV fit, where we find a total luminosity of 1.47 erg s-1, with the high and low ionization photoionized absorbers removing 1.8 erg s-1 and 1.4 erg s-1, respectively, or 2.2% of the spectral luminosity. In comparison, the high and low ionization emission spectra contribute luminosities over the same spectral band of 1 erg s-1 and 1.3 erg s-1, respectively, with the total ionized emission indicating a time-averaged covering factor of 60%.
6 Discussion
An analysis of the soft x-ray spectrum of PG1211+143, produced by stacking RGS spectral data from all seven orbits of the 2014 XMM-Newton observation, has revealed both low and highly ionization outflow components co-moving with each of the two primary high velocity outflows detected in the hard x-ray spectrum (Paper 1). The higher resolution of the grating spectrometers reveals additional velocity structure, with outflow velocities of 0.0610.002c and 0.0770.002c, apparently blended in the 0.066c component detected in the CCD spectra.
As in Paper 1 we find photoionized emission spectra are of similar significance to photoionized absorption in modifying the observed soft x-ray spectrum, with xstar modelling successfully reproducing most of the observed features, dominated by resonance emission lines and radiative recombination continua (RRC) of the abundant lighter metals (C, N, O, Ne) having K-shell energies covered by the RGS.
Extending the 2-10 keV spectral fit of Paper 1 down to 0.4 keV provides a direct comparison of the hard and soft x-ray analyses, allowing a quantitative measure of the impact of the photoionized outflow on the observed x-ray spectrum. From that assessment we find the outflow removes 2.3% of the 0.4–10 keV spectral luminosity, with the ionized emission returning 80% of that luminosity from scattering and recombination in an apparently extended outflow.
The relative column densities of co-moving low and high ionization absorption components in Table 2 suggest an outflow in line of sight to the soft x-ray continuum source with a small filling factor of embedded higher density matter. Adopting that explanation, comparison of abs1 and abs4 (Table 2) shows a factor 12 in column density and 50 in particle density, indicating a linear filling factor of 0.16%. It appears that while such co-moving absorbers may be readily understood in terms of higher density ’clouds’ embedded in the main flow, perhaps caused by instabilities in the flow, the small filling factor implies a negligible contribution to the outflow mass rate and momentum.
Explaining the large difference in column density for flow components detected in the RGS and pn data and having the same velocity and ionization parameter is less straightforward. The highly ionized outflow components detected in the hard x-ray data (abs 1 and abs 2 in Table 4) have column densities 300 and 70 times larger than their soft x-ray counterparts (abs3 and abs4, respectively, in Table 2). We suggest an explanation might involve different lines-of-sight to the dominant hard and soft x-ray continuum sources (power law and blackbody in the model; Figure 1).
For a conventional disc-corona geometry the intrinsic hard x-ray source would probably be confined to a smaller radius, closer to the black hole and - importantly - to the likely wind launch site (King and Pounds 2003), compared with the more extended thermal soft x-ray source in the inner accretion disc. For a sufficiently small launch radius, a diverging wind (King and Pounds 2015) might then explain the large difference in column density of the same flow component, observed in different sight lines to the hard and soft x-ray continuum sources. If confirmed, that possibility would offer the intriguing potential of using future observations of outflow spectra to explore the geometry of the x-ray continuum source in an AGN.
Finding multiple UFO velocities represents a new challenge to models of powerful AGN winds, not least to continuum-driving (King and Pounds 2003) which provides a natural mechanism for the highly ionized matter characteristic of UFOs, and has been found to provide a good match to their generic properties (King and Pounds 2015). We noted in Paper 1 that chaotic accretion (King and Pringle 2006), consisting of random prograde and retrograde events, could offer an explanation of a dual velocity wind, the two distinct outflow velocities relating to different orientations of the current inner accretion flow. With both flows close to Eddington, the prograde and retrograde discs would have different limiting values of the accretion efficiency and hence of velocity (King and Pounds 2003). Confirmation here of a third outflow velocity, marginally detected in Paper 1, may indicate further complexity in the inner accretion flow, which remains the natural site for the launch of a high speed,large column wind. A further constraint is the relative variability in the primary (high colunn) flow components over the XMM-Newton observations of 2001, 2007 and 2014 which will be reported in a future paper.
Meanwhile, in summary, the deep RGS exposure of PG1211+143 has provided an impressive demonstration of the application of high resolution spectra in studying the properties of a classical UFO. However, while the imprint of overlying ionized gas on the soft x-ray spectrum provides detailed information on the dynamics of that outflow, with the soft x-ray absorption and emission being a high resolution tracer of lower ionization matter entrained in the more massive highly ionized flows, it is important to note that the mass, momentum and mechanical energy rates of the UFO in PG1211+143 remain dominated by the much high column densities detected in the highly ionized (primary) flow components.
7 Appendix
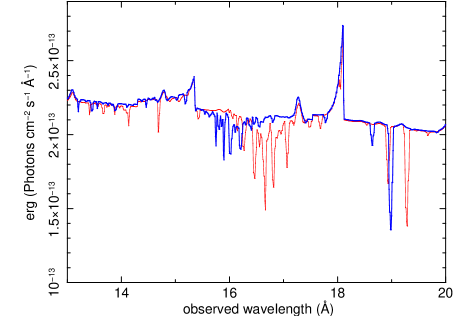
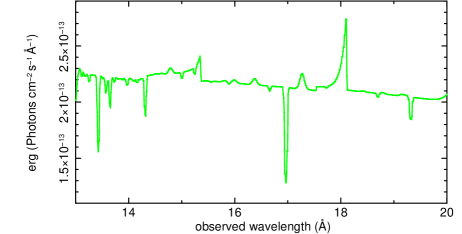
We noted in Section 4 that it was difficult to identify the complex of Fe-L absorption lines at 11–14 Å and in the strong Fe-M UTA at 15.5–17 Å sufficiently reliably to allow a blue shift (and velocity) determination. That issue is made still more difficult when multiple velocities are involved, as illustrated in Figure 5. There, the contributions of the v0.061c and v0.077c low ionization absorbers are shown separately, with the velocity difference resulting in a broader UTA than for a single velocity.
The upper panel of Fig.5 also provides a direct confimation of several individual line identifications, for example those at 19 Å and 19.3 Å identified with OVIII Ly- and associated with the above outflow velocities in Table 3. The lower panel of Fig. 5 shows the absorption profile for the highly ionized outflow component with v0.188c (Table 2, abs 5), where the same OVIII Ly- line is observed at 17 Å. While not fitted by a narrow Gaussian in Fig.4, for the reasons noted above, a strong absorption line is clearly visible at that wavelength.
The important point to note is that while individual blue-shifted line identifications are an important means of identifying an outflow - and a co-moving line-set is better still - the most secure way to determine the parameters of any UFO is by spectral modelling, as described in Sections 2 and 3 for the present case of PG1211+143.
8 Acknowledgements
XMM-Newton is a space science mission developed and operated by the European Space Agency. We acknowledge in particular the excellent work of ESA staff at the European Space Astronomy Center in Madrid in successfully planning and conducting the relevant XMM-Newton observations. The UK Science and Technology Facilities Council funded the posts of AL and MC.
References
- [1] Arnaud K.A. 1996, ASP Conf. Series, 101, 17
- [2] Behar E., Sako M., Kahn S.M. 2001, ApJ, 563, 497
- [3] Bentz M.C., Peterson B.M., Pogge R.W., Vestergaard M. 2009, ApJL, 694, 166
- [4] den Herder J.W. et al. 2001, A&A, 365, L7
- [5] Ferrarese L., Merritt D. 2000, ApJL, 539, L9
- [6] Gebhardt K. et al. 2000, ApJ, 539, L13
- [7] Gofford J. et al. 2013, MNRAS, 430, 60
- [8] Grevesse N., Sauval A.J. 1998, SSRv, 85, 161
- [9] Kaastra J.and Bleeker J. 2016, A&A, 587, 151
- [10] Kallman T., Liedahl D., Osterheld A., Goldstein W., Kahn S. 1996, ApJ, 465, 994
- [11] Kaspi S. Smith P.S., Netzer H., Maoz D., Jannuzi B.T., Giveon U. et al. 2000, ApJ, 533, 631
- [12] Kinkhabwala A., et al. 2002, ApJ, 575, 746
- [13] King A.R. 2003, ApJ, 596, L27
- [14] King A.R. and Pounds K.A. 2003, MNRAS, 345, 657
- [15] King A.R. 2010, MNRAS, 402, 1516
- [16] Lobban A.P., Vaughan S., Pounds K.A., Reeves J.N. 2016, MNRAS, 457, 38L
- [17] Marziani P., Sulentic J.W., Dultzin-Hacyan D., Clavani M., Moles M. 1996, ApJS, 104, 37
- [18] Mason K.O., et al. 2001, A&A, 365, L36
- [19] Murphy E.M., Lockman F.J., Laor A., Elvis M. 1996, ApJS, 105, 369
- [20] Pounds K.A., Reeves J.N., King A.R., Page K.L., O’Brien P.T., Turner M.J.L. 2003, MNRAS, 345, 705
- [21] Pounds K.A., Page K.L. 2006, MNRAS, 360, 1123
- [22] Pounds K.A. and Reeves J.N. 2009, MNRAS, 397, 249
- [23] Pounds K.A. and Vaughan S. 2011, MNRAS, 415, 2379
- [24] Pounds K.A. 2014, MNRAS, 437, 3221
- [25] Pounds K.A., Lobban A, Reeves J.N., Vaughan S. 2016, MNRAS, 457, 2951 (Paper 1)
- [26] Reeves J.N, et al. 2013, ApJ, 776, 99
- [27] Strueder L. et al. 2001, A&A, 365, L18
- [28] Tombesi F., Cappi M., Reeves J.N., Palumbo G.C., Yaqoob T., Braito V., Dadina M. 2010, ApJ, 742, 44
- [29] Tombesi F., Cappi M., Reeves J.N., Palumbo G.C., Braito V., Dadina M. 2011, A&A, 521, A57
- [30] Willingale R., Starling R.L.C., Beardmore A.P., Tanvir N.R., O’Brien P.T. 2013, MNRAS, 431,394