Annual Journal citation indices: a comparative study
Abstract
We study the statistics of citations made to the indexed Science journals in the Journal Citation Reports during the period 2004-2013 using different measures. We consider different measures which quantify the impact of the journals. To our surprise, we find that the apparently uncorrelated measures, even when defined in an arbitrary manner, show strong correlations. This is checked over all the years considered. Impact factor being one of these measures, the present work raises the question whether it is actually a nearly perfect index as claimed often. In addition we study the distributions of the different indices which also behave similarly.
I Introduction
Extensive studies have been made to analyze quantitatively the popularity of commodities (e.g., books, DVDs), movies, academic publications, webpages etc. over the last two decades or so, thanks to the availability of such data. Remarkably, identical behavior of the relevant distributions have been observed in many cases suggesting a common dynamical scheme responsible for the universality. To study the popularity of a research publication or paper, usually one calculates the citations made to that paper. The citation probability over time as well as citation distributions have been studied in great detail in recent years Sen:2013 ; Shockley:1957 ; Laherrere:1998 ; Redner:1998 ; Radicchi:2008 ; newman2005power ; Rousseau:1994 ; Egghe:2000 ; Burrell:2001 ; Burrell:2002 ; Petersen:2011 ; katz2000scale ; Eom:2011 . The popularity of an academic journal may also be similarly quantified using the citation data made to the papers published therein. The total citations received in a year, the impact factor Garfield:1964 ; Garfield:2006 , and the eigenfactor Bergstrom:2008 are well-known popular measures. The impact factor (IF) Garfield:1964 ; Garfield:2006 of an academic journal is a measure which reflects the average number of citations to recent articles published in the same journal. It is frequently used as a proxy for the relative importance of a journal within its field, with journals with higher IFs deemed to be more important compared to those with lower ones. However, according to leydesdorff2011integrated , IF may not be the perfect measure to compare the quality of two journals. The eigenfactor measure in addition takes into account the quality of the journals in which the citing articles appear, arguing that a journal is considered to be more influential if it is cited often by other influential journals. It was shown Fersht:2009 however that the eigenfactor measurement is more or less correlated with the annual citation measure.
Apart from studying the properties/statistics of the standard measures of annual citation and impact factor, we also introduce and analyze a new measure called the citation rate, defined in the next section.
In the present paper, we analyze the inter-dependence of the three indices, correlations of the same measures over time (auto-correlations), as well as their distributions. In section 2, we define the quantities considered: the details of the data and results are presented in section 3 and in the last section summary and discussions are made.
II Definition of citation indices
Impact factors are calculated yearly for journals that are indexed in the Journal Citation Reports JCR . The precise definition of IF is the following: if papers published in a journal in years and are cited times by indexed journals in the year , and be the number of citable articles published in those years, then the impact factor in year is given by
| (1) |
One can also measure , the number of annual citations (AC) to a journal in a given year. This is given by
| (2) |
where is the citations received in the year by the th paper published in the year .
We calculate another index, , the annual citation rate (CR) at a particular year that is defined as the number of citations received in a year (annual citations) divided by the number of articles published in the same year. Formally,
| (3) |
Note that this is clearly different from the average citation rate defined in ESI which denotes average number of citations received in a particular time interval by all previously published papers. However it is rather arbitrary as the numerator and the denominator are uncorrelated. We introduce this measure with the purpose to see how important is this arbitrariness.
These three measures are available from a single year’s report citation data. Combining data of different years, we consider another index which may be less arbitrary than but still quite different from . We define as , where is the average of over a extended time interval (10 years in our case).
The number of annual citations might depend on the age of the journal as well as on the number of papers published in it. Detailed studies on citation data have shown that a paper’s citation probability decays with time as a power law roughly up to 20 years after its publication after which it falls drastically Redner:2005 . So, one can assume that the total citation consists of citation to papers not more than years old practically. Hence, if the ages of the journals considered are greater than mostly, approximately covers the same time period for all journals and age of a journal will not be an important factor. However, may be biased by the number of publications and thus it is meaningful to scale it by a typical number of publications (as done for and ).
III Data and Results
We collected data for all Science journals indexed in ISI Web of Knowledge for the Science database, containing the following information: (i) the number of citations received by the journal in a year (ii) IF in that year , (iii) number of papers published in that particular year . The data is for years () taken from Journal Citation Reports (JCR) JCR .
III.1 Correlations
| Year | ||
|---|---|---|
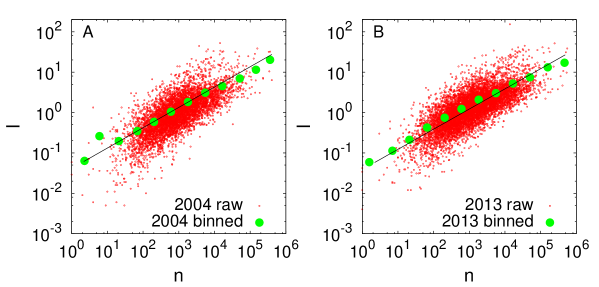
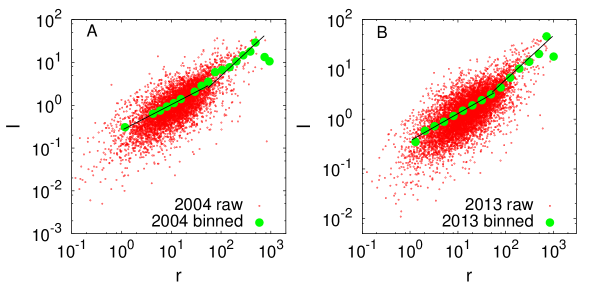
We first report the correlation between the different measures for different years. Figs. 1 and 2 shows the behavior of versus and respectively. The impact factor shows remarkable correlation with the number of citations for each year. In fact, the data binned for number of citations shows a very good agreement with a power law: , with considering all the years. The values of the exponents and for different years are given in Table 1. The binned data in Fig. 2 indicate that and are also related by a power law but there are apparently two distinct scaling regimes, roughly below and above . Fitting the data piecewise by power laws, we get with for and otherwise for and for and otherwise for . The power law exponent for the low region is less than that in the high – a trend that is consistent for all years, except that the exponents are slightly different (see Table 2 for all years). Fig. 3 shows the variation of with , from where it is quite interesting to note that the annual citations and citation rates have a different functional dependence. Here, the variation of with fitted well with the form and the estimated exponents are tabulated in Table. 3. The most relevant exponent has a value roughly around with some variation for different years. It is interesting to find that annual citation rate which is an implicit function of the annual citations has a nontrivial dependence.

| Year | for low | for low | for high | for high |
|---|---|---|---|---|
| Year | |||
|---|---|---|---|
Auto-correlation: We have also calculated the dynamic correlation of each of the indices (, , ) with itself over consecutive years. Plotting the values for two different years for the same journal, the auto-correlation is estimated by calculating the correlation coefficient. The linear correlation coefficient is a measure of the strength of linear relation between two quantitative variables, say and . We use to denote the sample correlation coefficient:
| (4) |
Where is the number of individuals in the sample.
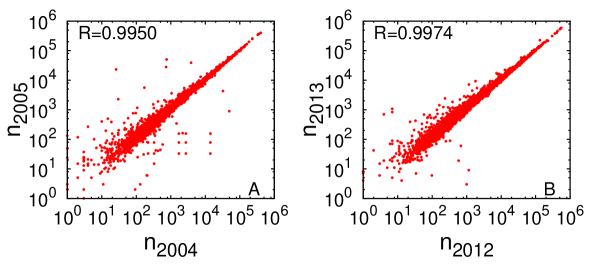
In Fig. 4, the correlations for and are presented. We choose two consecutive years from the extreme ends, i.e., - and -. It is observed that these are highly correlated as is close to in all the cases. Such high correlations are apparently not present for for all pairs of consecutive years. In fact, for shows considerable fluctuation as shown in Table 4. There may be an upward trend although from the last few data points there seems to be a tendency to stabilize at values which are still not very close to unity (compared to the correlation coefficient for and ). The lack of strong correlation in signifies the fluctuation in the number of publications even for consecutive years.
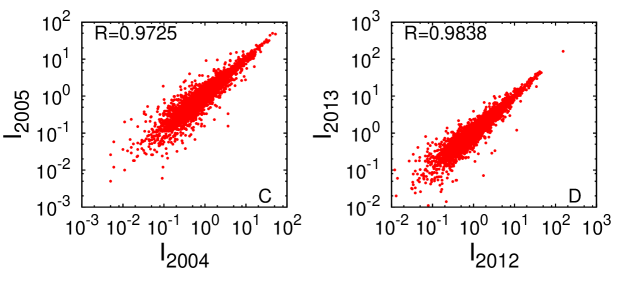
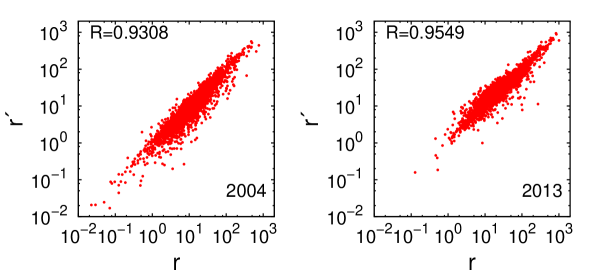
Apart from estimating the data for consecutive years, we have also calculated the correlation for the two extreme years for which data is available. The correlations for , and of two extreme years and are shown in Fig. 5. The value of in this case is still close to unity for while for and it is much less. That is close to for over a comparatively long time interval (9 years) is not surprising as for citations to all previously published papers are counted. On the other hand, for , the correlation drops since citations made for papers published two years prior to and that to are completely uncorrelated. The data for is not at all surprising as we already observed that even for consecutive years, correlation is not large.
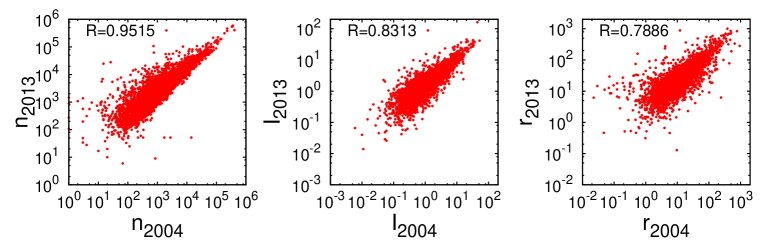
The correlation between and is found to be quite high. In Fig. 6, we show the correlation between and for two years, for 2004 and for 2013.
| Pairs of year | |
|---|---|
III.2 Distribution of annual citations, IF and annual citation rate: nature of their tails
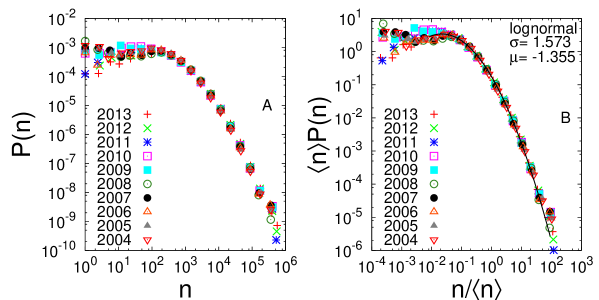
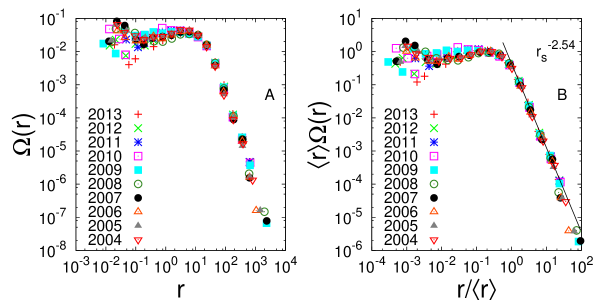
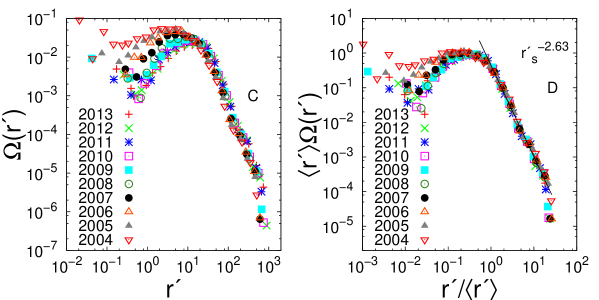
First we investigate the nature of the tail of the distribution of annual citations (Fig. 7(A),(B)) and impact factors (Fig. 7(C),(D)). The plots showed excellent scaling collapse over years when in general for any probability distribution , is plotted against . The distribution of annual citations and impact factors show non-monotonic behavior, with a peak occurring approximately at half the average values. The tail of the annual citations distributions (Fig. 7(B)) fit well to a lognormal form () with and . However, the tail of the impact factor distribution fits to a power law, with a decay exponent about .
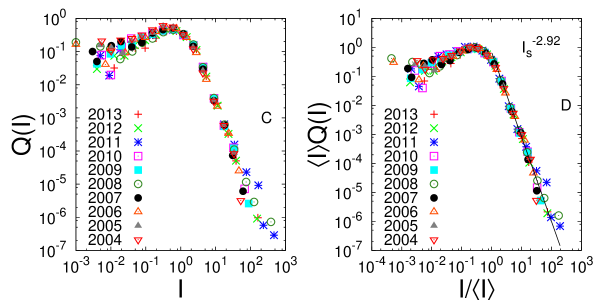
The probability distributions of the newly proposed quantity, the annual citation rate also shows a power law tail with a decay exponent (Fig 8(B)); although it is almost a flat distribution for . The probability distribution shows similar features as and its tail resembles roughly a power law with decay exponent (Fig 8(D)). In fact, we checked the correlation between and for each year, and found them to be very strongly correlated ().
If and are related by a power law, one can in principle derive the exponent of the distribution of from that of . Assuming in general the scaled distribution of has a power law tail with exponent and , the tail of the distribution for the scaled should follow the behaviour . However, we have noted earlier that is not unique. Putting the value of and the observed value , we obtain . It is interesting to note that this value does not correspond to either of the two values of (see Table. 2) estimated from the curves but rather is very close to the average of the two values in general.
IV Summary and discussions
We analyzed the citation data to Science journals for the period 2004-13 considering the entire data set available in the Journal Citation Reports JCR . The analysis is based on four different measures or indices. While the impact factor and annual citation () are readily available, we also introduced a third index, the citation rate , which can be easily estimated from the database. Closely related to is another measure which is calculated combining different years.
We have primarily studied the correlation between different measures in the same year, correlation between the same measures in two different years and probability distribution functions for different years. In this paper, we reported the explicit functional forms by which any pair of the three – , and are related to each other. Also correlation between and has been studied. The most surprising result is perhaps the fairly strong dependence of on . This dependence is not accidental as the corresponding exponent does not show appreciable change over time. It is to be remembered that depends on the citations to recent publications only while considers citations to all published papers in a journal. One might expect that old journals will have larger value of as a result. Impact factor on the other hand will not depend on the age of the journal, in principle. Thus it is quite surprising to see that and show a strong functional dependence. The measure is also expected to be dependent on the age. However, in contrast to it is a scaled data as , albeit in a different way, and it is not surprising that depends on in a stronger manner. However being quite arbitrarily defined, the correlation between and is not apparent. In fact, the numerator and denominator of are completely independent variables unless the number of publications is same for all years which is not the case. For on the other hand, the quantities appearing in the numerator and denominator are directly correlated. This work therefore opens up the question whether the impact factor is the most reliable measure or not. If so, then the present work indicates that and might as well qualify as such measures, which is less than obvious.
The probability distributions of the three measures are found to show conventional behavior, i.e., either log-normal type or they occur with power law tails. Like many other real systems, the exponents for power law variation lie between and which is sensible so as to have a finite average value. The scaled distribution of different years show universal behavior in time, as has been observed in many other systems in which the dynamics of popularity has been studied chatterjee2013universality . The preference of lognormals and power laws are decided from eye estimates of best fits. However, the reason why annual citations may follow a lognormal distribution can be justified by the fact that annual citations are very highly correlated, and one can imagine an underlying multiplicative process.
Acknowledgements.
The authors thank A. Ghosh for assisting in data acquisition. AK acknowledges financial support from UGC sanction No. F.7-48/2007 (BSR). PS acknowledges financial support from CSIR project.References
- (1) P. Sen and B. K. Chakrabarti, Sociophysics: An Introduction. Oxford University Press, Oxford (2013).
- (2) W. Shockley, Proc. IRE, 45 279 (1957).
- (3) J. Laherrere and D. Sornette, Eur. Phys. J. B, 2 525 (1998).
- (4) S. Redner, Eur. Phys. J. B, 4 131 (1998).
- (5) F. Radicchi, S. Fortunato and C. Castellano, Proc. Nat. Acad. Sci., 105 17268 (2008).
- (6) M. E. J. Newman, Contemporary physics, 46 323 (2005).
- (7) R. Rousseau, Scientometrics, 30 213 (1994).
- (8) L. Egghe, Scientometrics, 48 345 (2000).
- (9) Q. L. Burrell, Scientometrics, 52 3 (2001).
- (10) Q. L. Burrell, Scientometrics, 53 309 (2002).
- (11) A. M. Petersen, H. E. Stanley and S. Succi, Scientific Reports, 1 181 (2011).
- (12) J. S. Katz, Science and Public Policy, 27 23 (2000).
- (13) Y.-H. Eom and S. Fortunato, PloS one, 6 e24926 (2011).
- (14) E. Garfield, Science, 144 649 (1964).
- (15) E. Garfield, Int. J. Epidemiology, 35 1123 (2006).
- (16) C. T. Bergstrom, J. D. West and M. A. Wiseman, J. Neuroscience, 28 11433 (2008).
- (17) L. Leydesdorff and L. Bornmann, Journal of the American Society for Information Science and Technology, 62 2133 (2011).
- (18) A. Fersht, Proc. Nat. Acad. Sci., 106 6883 (2009).
- (19) Thomson reuters, journal citation reports. http://admin-apps.webofknowledge.com/JCR/JCR?RQ=HOME, retreived December, 2014.
- (20) Thompson reuters, essential science indicators. http://ip-science.thomsonreuters.com/m/pdfs/mgr/qrc esi mar09.pdf.
- (21) S. Redner, Phys. Today, 58 49 (2005).
- (22) A. Chatterjee, M. Mitrović and S. Fortunato, Scientific reports, 3 1049 (2013).