Primary authors: aspopov1@inp.nsk.su
To be submitted to PLB.
STUDY OF THE PROCESS IN THE C.M. ENERGY RANGE FROM THRESHOLD TO 2 GEV WITH THE CMD-3 DETECTOR
Abstract
Using a data sample of 7.7 pb-1 collected with the CMD-3 detector at the VEPP-2000 collider we select about 2900 events of the process and measure its cross section at 12 energy points with about 6% systematic uncertainty. From the angular distribution of produced nucleons we obtain the ratio .
I INTRODUCTION
The Born cross section of the process shown in Fig. 1 is given by
| (1) |
where is the center-of-mass energy, is the proton mass, and . The Sommerfeld-Gamov-Sakharov factor Coulomb , , takes into account the Coulomb final state interaction. The cross section depends on the electric () and magnetic () form factors, which are equal at the threshold. To compare different experiments, the effective form factor
| (2) |
is usually defined.
In early experiments at the electron-positron colliders DM1 ; DM2 ; fenice ; bes in the energy range between the proton-antiproton threshold and = 2 GeV, the cross section of the process has been measured at six energy points only. The accuracy of these measurements is about 25-30% and the assumption is made. In the PS170 experiment at LEAR lear the measurement of the effective proton form factor and the first measurement of the ratio have been performed in the process with 30% accuracy. The most accurate measurements of the cross section, the effective form factor, and the ratio have been performed with the BaBar babar detector using the initial-state radiation (ISR) method. However, PS170 and BaBar results contradict to each other, and new experiments are obviously required.
Additional interest to this energy range is related to an unusual behavior of the cross section Solodov near the proton-antiproton threshold.
II THE CMD-3 DETECTOR
The CMD-3 detector cite_cmd3_1 ; cite_cmd3_2 is installed in one of the two interaction regions at the electron-positron collider VEPP-2000 cite_vepp_2 . The design luminosity of the VEPP-2000 is cm-2s-1 at the maximum center-of-mass energy = 2 GeV. The detector tracking system consists of the cylindrical drift chamber (DC) and double-layer cylindrical multiwire proportional Z-chamber, both used for a trigger, and both installed inside a thin (0.2 ) superconducting solenoid with 1.3 T field. The beam pipe inside the DC is made of 0.5 mm aluminum with 17 mm inner radius. An inner shell of DC is made of a carbon-fiber-reinforced polymer (CFRP) and has 20 mm radius. The DC contains 1218 hexagonal cells and allows to measure charged particle momentum with 1.5-4.5 accuracy in the 100-1000 MeV/c range, and provides the measurement of the polar () and azimuthal () angles with 20 mrad and 3.5-8.0 mrad accuracy, respectively. An amplitude information from the DC wires is used to measure ionization losses of charged particles with 11-14% accuracy. Two electromagnetic calorimeters (a liquid xenon (LXe) one with 5.4 and CsI crystals with 8.1 ) are placed in the barrel outside the solenoid. BGO crystals with 13.4 are used as the end-cap calorimeter. The return yoke of the detector is surrounded by scintillation counters, which are used to veto cosmic events.
We use the data samples of 2011 (1.0 T field) and 2012 (1.3 T field) runs, collected at twelve beam energy points with an integrated luminosity of 7.7 pb-1. To study the detector response to a proton-antiproton pair and determine the detection efficiency, we have developed a Monte Carlo (MC) simulation of our detector based on the GEANT4 GEANT4 package, and all simulated events pass the reconstruction and selection procedures. The MC simulation includes soft photon radiation by initial electron or positron, calculated according to Ref. Sibid .
III EVENT SELECTION
In the studied energy range nucleons have low velocity and high ionization losses. According to MC simulation, when the beam energy is less than 950 MeV, all protons and antiprotons stop in the beam pipe or in the inner DC shell, and antiprotons annihilate producing several secondary particles. An example of such an event is shown in Fig. 3. When is above 952 MeV, almost all nucleons reach the DC sensitive volume, and stop in the DC outer shell or in the Z-chamber. Figure 3 shows an example of an event, when both proton and antiproton are detected in the DC. For beam energies between 950 and 952 MeV, only part of nucleons penetrate into the DC volume. According to these differences in the nucleon path to annihilation, we use two different approaches for the signal selection.
III.1 Nucleons reach the DC sensitive volume
The selection criteria for this class of events are the following:
a) there are two opposite-charge tracks with the number of DC hits 4. They are collinear (( 0.25 rad & 0.15 rad) or ( 0.4 rad & 0.5 rad) for 955 MeV); at 955 MeV particles have very small momentum and experience high multiple scattering;
b) the tracks are originating from the beam interaction region within 10 cm along the beam axis and within 1 cm in the transverse direction;
c) Momenta of both tracks are close to each other 0.15 ( 0.5 for 955 MeV);
d) The total energy deposition in the calorimeters is larger than 200 MeV.
Figure 4 shows a scatter plot of the ionization losses () in DC vs momentum for a selected pair of tracks. A signal from events is clearly seen. We require both tracks to have ionization losses above a value, which is calculated by taking into account the average value and resolution at the measured momentum. The line in Fig. 4 shows the applied selection.
The distribution of the average absolute value of the nucleon momentum for selected events at = 970 MeV is shown in Fig. 6. The number of background events in the signal range is expected to be negligible. The left tail of the distribution is mainly due to the initial state radiation resulting in nucleons with a smaller momentum and higher value.
The “declared” collider beam energy was not very precise, and at a few energy points the energy was continuously monitored during data taking, using the Back-Scattering-Laser-Light system laser . Based on these measurements and comparing the average nucleon momentum value for data and simulation, we can determine the c.m. energy with better accuracy.
We simulate the process at the “declared” collider beam energies, apply the above selections, and fit the average momentum distribution of the proton-antiproton pairs with a sum of two Gaussian functions. The experimental distribution at each energy point is fitted with the corresponding MC-simulated function, convolved with an additional normal distribution, which takes into account a data-MC difference in the detector resolution. The number of events, variance of the additional normal distribution, and the momentum difference between simulation and experiment are floating. The fit curve is demonstrated in Fig. 6 by the line. Using the obtained momentum difference and proton mass value we calculate a beam energy shift , listed in Table 1 for each energy point.
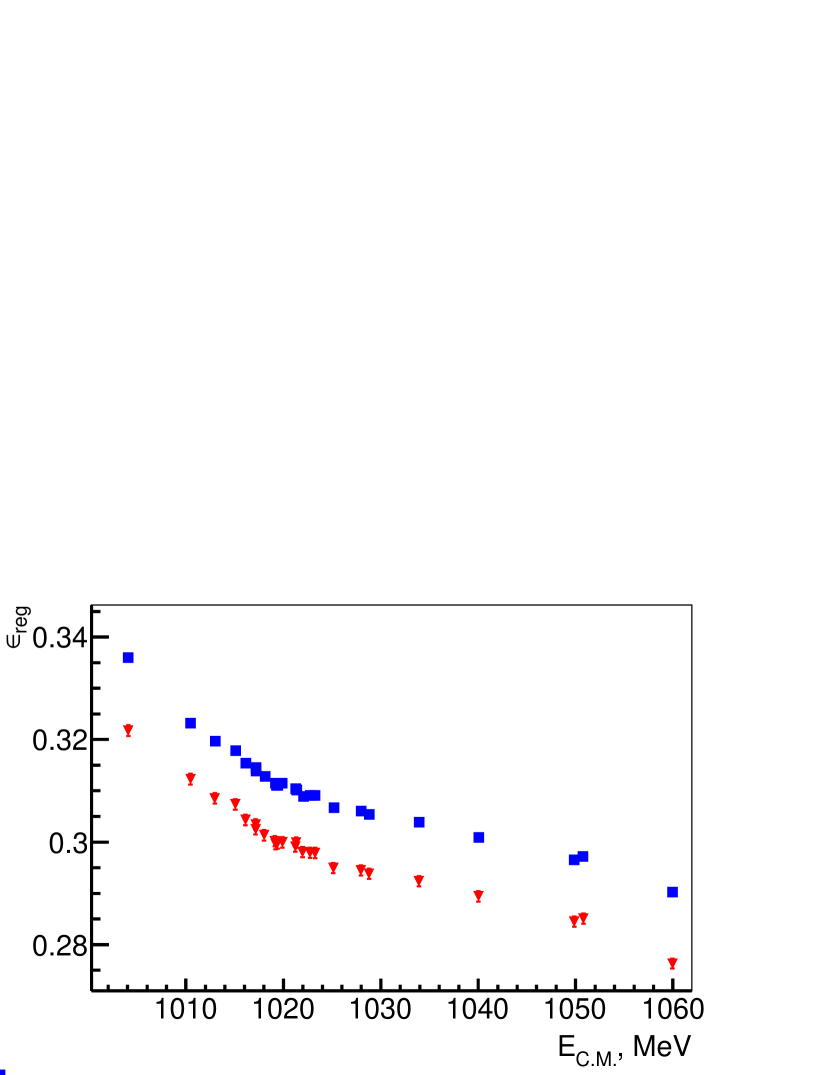
The detection efficiency for this class of events is calculated as the ratio of the number of selected pairs to that of all MC-simulated events. The energy dependence of is shown in Fig. 6 for two experimental runs.
To estimate a data-MC difference in the detection efficiency, we select a pure class of events with a detected antiproton and check how often we reconstruct the opposite proton. We use the following selection criteria:
- one or two tracks coming from the beam interaction region within 10 cm along the beam axis and within 1 cm in the transverse direction;
- one of these tracks has negative charge, has the number of hits 9 with high ionization losses in DC (), and associated energy deposition in the calorimeters is larger than 100 MeV;
- the total energy deposition in the calorimeters is from 300 to 1100 MeV.
Using these selections we obtain the proton detection efficiency for data and MC-simulation , which are calculated as a ratio of the number of events with found protons to that of all events with antiprotons. Because of the large proton background from beam-gas interactions we cannot select a pure sample of detected protons, and assume equal detection efficiencies for protons and antiprotons. The squared ratio of efficiencies found for data and MC-simulation is shown in Fig. 8 vs c.m. energy, and gives an estimate of data-MC difference. We fit these points with a constant and obtain the value close to unity, which is used as an estimate of the systematic error on the detection efficiency. At the point MeV we use the correction as determined above, because the effect of material and thickness uncertainties of the beam pipe is too big.
At each energy point the cross section for this class of events is calculated from
| (3) |
where is the integrated luminosity, and is the detection efficiency. Figure 8 shows energy dependence of the radiative correction (1-) calculated according to Ref. Sibid .
The c.m. energy, beam energy shift, luminosity, number of selected events, detection efficiency, radiative correction, and cross section are listed in Table 1.
III.2 Nucleons are absorbed in the beam pipe or the DC inner shell
When an antiproton stops in the material of the beam pipe or in the DC inner shell, it annihilates with production of several secondary particles, which are mostly pions. Part of the produced negative pions are captured by nuclei and induce nucleus fragmentation and production of protons and neutrons as well as deuterons and tritons.
Candidates to this class of events are selected with the following criteria:
a) an event has a vertex with 4 or more tracks located in front of the beam pipe or the DC inner shell;
b) an event has no tracks with energy deposition in calorimeters higher than 400 MeV.
We verify these criteria in a special run without beams, and conclude that cosmic events are completely rejected by these criteria.
The main remaining background is due to the interactions of the particles lost from the beams with the detector material. Several pions, protons and heavier particles are produced in such interactions. We study this background in a special run with one electron or positron beam only, and using data from c.m. energy points below the threshold.
To obtain the number of events we use additional information from the calorimeters. The distribution of the energy deposition from the background events, shown in Fig. 9(left) with a fit function, is obtained from the runs where the c.m. energy was below the production threshold. Figure 9(right) shows the combined distribution of the total energy deposition for three c.m. energies above threshold; 945, 950 MeV(run 2011) and 950 MeV(run 2012). A signal from the antiproton annihilation is clearly seen. We describe this signal with an additional Gaussian function and use its parameters to obtain the number of events at each c.m. energy point. The obtained numbers of signal events vs c.m. energy are shown in Fig. 11.
To obtain the cross section we need to determine the detection efficiency for this class of events.
To calculate the efficiency for stopped nucleons we use our data at the energy point 950 MeV (run 2012), where part of antiprotons stop in the beam pipe and in the DC inner shell, and annihilate, , while part of pairs pass the DC sensitive volume, and are identified as collinear events, , allowing to calculate the cross section. A fraction of stopped and annihilated antiprotons vs beam energy was obtained from simulation and is shown in Fig. 11 by circles. Using the measured beam energy ( MeV, see above), we obtain with the corresponding for the detected collinear events (Fig. 6). (The uncertainties of were obtained from simulation with different thickness of the beam pipe, the thickness is mm.) At this energy point we calculate a “visible” cross section for the collinear events, , and assuming the same production cross section, we determine a detection efficiency for the annihilated antiprotons, :
| (4) | |||
The detection efficiency for annihilated antiprotons is found to be , and because antiprotons annihilate at rest, it does not depend on the beam energy. In the 2011 run the real beam energy at 950 MeV is slightly below the threshold of DC penetration, and we can not use the procedure. At other energy points the cross section can be calculated as:
The obtained values are listed in Table 2.
IV The ratio
The cross section depends on the proton/antiproton polar angle as:
| (5) | |||
and the ratio can be extracted from the experimental polar angle distribution. The ratio depends on energy, also is not equal to 1, but in spite of this fact we combine the angular distributions from all c.m. energy points in the 1920-2000 MeV interval, because of insufficient statistics. We use the procedure described in Sec. III.1 to obtain the data-MC correction for the angular dependence of the detection efficiency.
These corrections are shown in Fig. 13 for the two experimental runs. We fit the corrected experimental polar angle distribution shown in Fig. 13 by points with a sum of two functions
| (6) |
where and are contributions to the angular distribution obtained from simulation with and with , respectively. The numbers of simulated events for and are normalized to the integral of the and functions, respectively. The fit yields .
We estimate a systematic error on this value as 20%, mostly coming from the large statistical errors of the angular correction to the efficiency of Fig.13, and also strong dependence of the corrections on .
A comparison of the measured value with other experiments is shown in Fig. 15.
V Systematic errors
V.1 Systematic errors; are detected
The main sources of the systematic errors in this energy range are:
- accuracy of the ratio - 5%;
- variation of the ratio within error bars leads to 3% changes in the detection efficiency;
- selection criteria - 2%;
- luminosity determination - 1% lumin ;
- radiative corrections - 1% Sibid ;
- beam energy determination accuracy - less than 0.5% above 955 MeV and 2% at the energy point 950 MeV (run 2012);
- uncertainty of the beam pipe thickness - 2% above 955 MeV and 10% at 950 MeV (run 2012);
Combining above numbers, we estimate a total systematic error as 6% at beam energies above 955 MeV and 12% at the energy point 950 MeV(run 2012).
V.2 Systematic errors; annihilates
Main sources of systematic errors in this energy range are:
- accuracy of antiproton detection efficiency - 36%, including uncertainty on the beam energy determination and uncertainty in the beam pipe thickness ;
- accuracy gives 8% errors in the number of antiprotons stopped in the beam pipe and the DC inner shell. This contribution is considered in antiproton detection efficiency;
- luminosity determination - 1%;
- radiative correction - 1%;
- selection criteria - 2%;
The total systematic errors are 37%.
Calculated effective form factor and measured cross section are shown in Fig. 15 and Fig. 16, respectively. The cross sections are listed in Table 1 and Table 2.
| ,MeV | ,MeV | L, nb-1 | (1-) | , nb | ||
| 1900 (2012) | 0.80.1 | 900.0 | 16413 | 0.75 | 1.200.260.14 | |
| 1920 | 3.30.2 | 566.9 | 25116 | 0.631 | 0.81 | 0.870.050.05 |
| 1925 | 0.50.3 | 590.8 | 28017 | 0.638 | 0.82 | 0.900.050.05 |
| 1940 | 2.40.4 | 993.8 | 48822 | 0.669 | 0.85 | 0.870.050.05 |
| 1950 | 1.20.3 | 451.0 | 23816 | 0.692 | 0.86 | 0.890.060.05 |
| 1960 | 3.00.3 | 692.2 | 39720 | 0.685 | 0.87 | 0.960.060.06 |
| 1975 | 1.30.3 | 506.6 | 28317 | 0.708 | 0.88 | 0.900.050.05 |
| 1980 | 3.60.5 | 600.6 | 35619 | 0.693 | 0.88 | 0.980.050.06 |
| 2000 | 2.30.4 | 478.0 | 28417 | 0.708 | 0.88 | 0.950.060.06 |
| Total | 5780 | 274152 | — | — | — |
| ,MeV | L, nb-1 | (1-) | , nb | |||
|---|---|---|---|---|---|---|
| 1890 | 527.1 | 79.411.0 | 0.69 | 0.110 | 1.980.270.73 | |
| 1900 (2011) | 498.5 | 41.38.5 | 0.75 | 0.067 | 1.650.340.61 | |
| 1900 (2012) | 900.0 | 44.89.2 | 0.75 | 0.055 | 1.210.250.45 |
VI CONCLUSION
The cross section has been measured using a data sample of 7.7 pb-1 collected in the center-of-mass energy range from threshold to 2 GeV. Results agree with the previous BaBar experiment and have comparable or better statistical and systematic errors. The value of the ratio has been found in the energy range from 1.92 to 2 GeV, and is in agreement with BaBar data. The expected tenfold increase in the luminosity of VEPP-2000 will allow the proton form factor and ratio to be measured with much better accuracy.
ACKNOWLEDGEMENTS
This work is supported in part by the Russian Education and Science Ministry, by the Russian Foundation for Basic Research grants
RFBR 14-02-31478, RFBR 14-02-00580-a, RFBR 14-02-00047-a, RFBR 14-02-31275-mol-a RFBR 13-02-00215-a, RFBR 13-02-01134-a.
References
- (1) A. Sommerfeld, Atombau und Spektrallinien, F. Vieweg & Sohn, 1921; G. Gamov, Zeit. Phys. 51 (1928) 204; A.D.Sakharov, Sov. Phys. JETP 18 (1948) 631.
- (2) B. Delcourt et al. (DM1 Collaboration), Phys. Lett. B 86 (1979) 395 .
- (3) D. Bisello et al. (DM2 Collaboration), Nucl. Phys. B 224 (1983) 379; Z. Phys. C 48 (1990) 23.
- (4) A. Antonelli et al. (FENICE Collaboration), Nucl. Phys. B 517 (1998) 3.
- (5) M. Ablikim et al. (BES Collaboration), Phys. Lett. B 630 (2005) 14.
- (6) G. Bardin et al. (PS170 Collaboration), Nucl. Phys. B 411 (1994) 3.
- (7) J.P. Lees et al. (BaBar Collaboration), Phys. Rev. D 87 (2013) 092005.
- (8) R.R.Akhmetshin et al., Phys. Lett. B 723 (2013) 82.
- (9) V. M. Aulchenko et al., BUDKER-INP-2001-45.
- (10) G. V. Fedotovich et al., Nucl. Phys. Proc. Suppl. 162 (2006) 332.
- (11) D. E. Berkaev et al., JETP 113 (2011) 213.
- (12) S. Agostinelli et al. (GEANT4 Collaboration), Nucl. Instr. Meth. A506 (2003) 250.
- (13) A. B. Arbuzov, G. V. Fedotovich, F. V. Ignatov, E. A. Kuraev and A. L. Sibidanov, Eur. Phys. J. C 46 (2006) 689 [hep-ph/0504233].
- (14) V. Abakumova et al., Phys. Rev. Lett. 110 (2013) 140402.
- (15) R.R. Akhmetshin et al., Nucl. Phys. B (Proc. Suppl.) 225-227 (2012) 69.