Magnetic structure, magnetoelastic coupling, and thermal properties of EuCrO3 nano-powders
Abstract
We carried out detailed studies of the magnetic structure, magnetoelastic coupling, and thermal properties of EuCrO3 nano-powders from room temperature to liquid helium temperature. Our neutron powder diffraction and X-ray powder diffraction measurements provide precise atomic positions of all atoms in the cell, especially for the light oxygen atoms. The low-temperature neutron powder diffraction data revealed extra Bragg peaks of magnetic origin which can be attributed to a antiferromagnetic structure with an ordered moment of 2.4 consistent with the electronic configuration of the Cr3+ cations. Apart from previously reported antiferromagnetic and ferromagnetic transitions in EuCrO3 at low temperatures, we also observed an anomaly at about 100 K. This anomaly was observed in temperature dependence of sample’s, lattice parameters, thermal expansion, Raman spectroscopy, permittivity and conductance measurements. This anomaly is attributed to the magnetoelastic distortion in the EuCrO3 crystal.
pacs:
75.25.-j, 75.47.Lx, 65.40.Ba, 65.40.De, 75.50.EeI Introduction
Since the early investigation of the antiferromagnetic structure of LaCrO3 ( 320 K) by Koehler and WollanKoehler1957 rare earth orthochromites with the chemical composition RCrO3, (R = rare earth element) have experienced particular attention. Interest was especially triggered by their complex magnetic ordering often with spin canting resulting from the interaction of the magnetic moments of the Cr3+ and the R3+ cations which can be tuned by external parameters like temperature, magnetic field or pressure.Hornreich1978 As such the rare earth orthochromites were perceived as systems with great potential as magnetoelectric multiferroics (ME/MF) materials. In fact, the rare earth orthochromites have been demonstrated to exhibit ferroelectric polarization either induced by an external magnetic field (ME) or a spontaneous polarization as a consequence of internal magnetic fields induced by long-range magnetic ordering (MF). Sahu2007 ; Rajeswaran2012 ; Raveau2014 ; Saha2014 ; Meher2014 ; McDannald2015
The potential of the RCrO3 was especially seen in their high magnetic ordering temperatures compared to what was observed in the orthomanganites series, RMnO3, (e.g. 27 K in TbMnO3) which brought about some of the most prominent MF systems. In comparison to the rare earth orthoferrites, RFeO3, which exhibit even higher magnetic ordering temperatures, the orthochromites, however, are potentially more interesting since the coupling between the rare earth and the transition metal subsystem is larger in magnitude allowing to take advantage of the partially sizeable magnetic moments of the R3+ cations. Due to the interaction of the rare earth and 3 moments, RCrO3 systems exhibit a variety of complex magnetic structures, often with the presence of a weak ferromagnetic component and several spontaneous spin reorientations.Rajeswaran2012 These were ascribed to the absence of fourth-order crystal field splitting terms of the =3/2 spin multiplet of the Cr3+ cations with an 3 electronic configuration.Hornreich1978
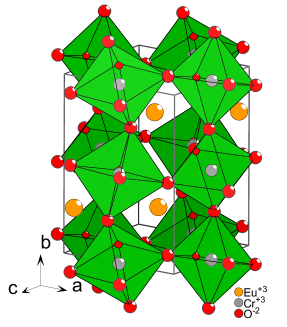
The RCrO3 compounds crystallize with the orthorhombic GdFeO3 structure-type (centrosymmetric spacegroup ) which is highlighted in Fig. 1. Bertaut and collaborators analyzed the possible symmetry-compatible ordered magnetic structures of the orthorhombic ABO3 compounds.Bertaut1967 ; Smart3B With respect to the possible symmetry adapted modes for the Cr atoms, four representations of the base vectors are possible, three of them allow a weak ferromagnetic component in the presence of anisotropic exchange forces.
Magnetoelectric effects as well as magnetic and electric field induced switching of the dielectric polarization have been detected in SmCrO3, GdCrO3, and ErCrO3.Rajeswaran2012 Polarization in ErCrO3 disappears below the spin orientation transition of 22 K which was ascribed to the crucial connection of the magnetoelectric behavior to the weak ferromagnetism.Rajeswaran2012 ; Holmes1970 This conclusion was subsequently questioned by Preethi Meher et al. who observed qualitatively similar results but weaker in magnitude effects in LuCrO3 with a diamagnetic R constituent.Meher2014 At present, there are also diverging opinions about whether the ferroelectric state as evidence by polarization as well as pyroelectric currents occur at the Néel temperature as concluded by Rajeswaran et al. or whether a ferroelectric state is formed already at higher temperatures as proposed earlier by Lal et al. or Sahu et al..Lal1989 ; Sahu2007 For example, Prado Gonjal et al. could not identify a strong correlation between the magnetic and dielectric properties of RCrO3 which were prepared by a microwave assisted sintering.Gonjal2013
The properties of rare earth orthochromites with most of the rare earth elements have been extensively investigated. It appears that the knowledge of the magnetic properties of the system EuCrO3 is limited to magnetization studies and a first Raman scattering investigation carried out down to 90 K.Tsushima1969 ; Venkata2013 Preliminary measurements of the pyroelectric and dielectric properties of EuCrO3 have been carried out for 300 K.Lal1989 The magnetization studies found antiferromagnetic ordering below 175 K and weak ferromagnetism with a small ferromagnetic moment of 0.1 along the -axis.Tsushima1969 ; Gonjal2013 . The Raman data evidenced anomalies in the shift of some Raman modes near the Néel temperature.Venkata2013 Neither the magnetic structure nor a detailed investigation of the magnetoelastic coupling or the thermal properties of EuCrO3 have been carried out, so far. In a preceding publication, we described the preparation, characterization and magnetization of EuCrO3 and CeCrO3 prepared by a solution combustion method and found magnetization irreversibility and exchange bias effects on such samples.Maryam In the present paper, we report on the results of a comprehensive investigation of the magnetic and thermal properties of EuCrO3 from room temperature down to liquid helium temperatures. Especially, we performed detailed neutron diffraction experiments using neutrons of different wavelengths and solved the magnetic structure of EuCrO3 conclusively. We confirm weak ferromagnetism due to weak canting of the Cr moments. Magnetoelastic effects are investigated by low-temperature thermal expansion and x-ray powder diffraction and detailed Raman scattering experiments. Finally, we report on a first characterization of the dielectric properties of EuCrO3 by frequency dependent permittivity measurements.
II Experiment
High-purity powder samples of EuCrO3 were synthesized by the solution combustion method starting from equimolar solutions of high purity europium nitrate, chromium nitrate and glycine. The ground powder was first calcinated at 500 ∘C for 5 h and reground and sintered at 950 ∘C for 12 h. process.The products were characterized with respect to the composition, particle size and phase purity by x-ray diffraction as described in detail elsewhere.Maryam
All neutron powder diffraction (NPD) patterns were collected on 12 g sample powder packed in an Al container using the DUALSPEC C2 powder neutron diffractometer, equipped with a curved 800-wire BF3 detector at the NRC Canadian Neutron Beam Center CNBC, Canada. Two different wavelengths of 2.37 Å and 1.3282 Å wavelengths from the silicon 311 and the 531 reflection, respectively, were used. A graphite filter was placed in the incident beam in front of the sample to eliminate higher order contributions. Diffraction patterns collected with the short-wavelength neutrons were employed to obtain Bragg reflections at high values to enable reliable refinements of nuclear structure whereas the longer wavelength was used to explore the small regime and to search for magnetic scattering. Additional neutron scattering was carried out at the N5 triple axis spectrometer at the NRC Canadian Neutron Beam Center to trace the temperature dependence of the order paramater in detail. The initial and final neutron energies both were chosen by the pyrolytic graphite PG002 reflections. In order to reduce the very high absorption cross section for thermal neutrons from the 151Eu isotope in the natural isotope composition of Eu, we utilized a flat geometry thin-walled aluminum sample holder which was long enough to cover the full beam height but reduced the thickness of the sample to 1 mm.Ryan To trace magnetoelastic coupling effects low-temperature x-ray powder diffraction (XRPD) patterns were collected with a Bruker D8 Discovery System equipped with an Oxford Instruments closed cycle cooler flat-plate stage. All profile refinements of the NPD and XRPD patterns were performed with the software.FullProf DC magnetization measurements were performed using a Magnetic Properties Measurement System (Quantum Design, MPMS). Heat capacity measurements were done in a Physical Properties Measurement System (Quantum Design, PPMS). Dielectric properties of rectangular shaped samples (6.4 1.6 mm2; thickness 0.88 mm) were measured versus temperature at discrete frequencies with an AH2700A capacitance bridge (Andeen-Hagerling, Inc.). The complex permittivity was analyzed assuming a parallel circuit of a lossless capacitor and a resistor. The linear thermal expansion of a sample of 0.801(1) mm length was measured using a high-resolution miniature dilatometer.Rotter1998 ; Reuvekamp2014a ; Reuvekamp2014b ; Reuvekamp2015 The Raman spectra were collected on a Jobin Yvon Typ V 010 LabRAM single grating spectrometer with 1 cm-1 spectral resolution. The spectrometer setup included a double super razor edge filter, Peltier cooled CCD camera and a Mikrocryo cryostat with a copper cold finger. Measurements were performed with linearly polarized He/Ne gas laser light of 632.817 nm with 1mW of power. The light beam was focused to a 10 m spot on the top surface of the sample using a microscope. Measurements were taken in temperatures ranging between 10 K and 325 K.
III Results and Discussion
III.1 Chemical and Structural Characterization
Chemical and structural properties and the morphology of the samples used for the subsequent investigation have been described in detail elsewhere.Maryam Phase purity of the samples was confirmed using room temperature XRPD. Transmission electron microscopy images revealed a uniform size distribution of the particles ranging between 50 - 70 nm. A random particle size distribution ranging between 60 and 80 nm also allowed to model the observed broadening of the Bragg reflections in the XRPD patterns.
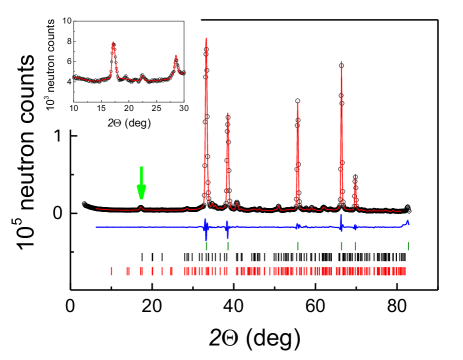
Fig. 2 displays an NPD pattern of EuCrO3 collected with a neutron wavelength of 1.3282 Å at 3.5 K. An analogous pattern was collected at 280 K (not shown). Both patterns contain dominant reflections from the Al sample container which was used to shape a thin sample in order to reduce neutron absorption of the Eu isotope 151Eu. In addition to the nuclear scattering of EuCrO3, the 3.5 K NPD pattern reveals magnetic scattering with a dominant magnetic Bragg reflection at = 4.41(2) Å. For the profile refinement of the NPD patterns, we first refined the Bragg reflections of the Al container by partially treating them as special reflections allowing individual shifts and widths. Subsequently, the EuCrO3 nuclear pattern was refined by varying the lattice parameters, atom positions, and the thermal displacement parameters. The background was modeled by a Tschebyscheff polynomial of higher degree. The zero-point of the pattern was also refined but it remained below 0.1o. The nuclear structural parameters of the refined NPD patterns at 280 and 3.5 K as well as structural parameters obtained from room temperature XRPD patterns, are compiled in Table 1.
The positional parameters of all atoms generally agree well with those obtained from the XRPD patterns Maryam , with a slight discrepancy seen for the Eu atom positions resulting from the 280 K pattern. Especially, the NPD data confirm the atom positional parameters of the oxygen atoms O1 and O2 derived from the XRPD data. All cell parameters exhibit a decrease by lowering the temperature. The relative decrease is most pronounced in the lattice parameter. A shift of the oxygen atoms could not be detected upon lowering the temperature to 3.5 K. Furthermore, indication for a structural phase transition between 280 and 3.5 K was not found from the NPD patterns.
| T (K) | 295 (XRPD) | 280 K (NPD) | 3.5 (NPD) |
|---|---|---|---|
| a (Å) | 5.34622(9) | 5.3364(9) | 5.3197(8) |
| b (Å) | 5.51116(8) | 5.4988(9) | 5.4927(7) |
| c (Å) | 7.62931(13) | 7.6122(13) | 7.5936(11) |
| V (Å)3 | 224.79(1) | 223.37(7) | 221.85(6) |
| Eu (4c) | |||
| x | -0.01313(17) | -0.0094(39) | -0.0062(39) |
| y | 0.05413(9) | 0.0400(26) | 0.0537(26) |
| z | 1/4 | 1/4 | 1/4 |
| (Å2) | 0.140(11) | 0.54(27) | 0.48(28) |
| Cr (4b) | |||
| x | 1/2 | 1/2 | 1/2 |
| y | 0 | 0 | 0 |
| z | 0 | 0 | 0 |
| (Å2) | 0.18(3) | 0.63(37) | 0.55(38) |
| O1 (4c) | |||
| x | 0.094(2) | 0.1053(37) | 0.0999(36) |
| y | 0.460(1) | 0.4746(38) | 0.4785(32) |
| z | 1/4 | 1/4 | 1/4 |
| (Å2) | 0.7 | 1.0(3) | 1.0(3) |
| O2 (8d) | |||
| x | -0.2886(13) | -0.2884(28) | -0.2953(25) |
| y | 0.2987(12) | 0.2863(26) | 0.2863(23) |
| z | 0.0483(10) | 0.0448(16) | 0.0500(17) |
| (Å2) | 0.74(25) | 0.74(25) | 1.0(3) |
| Bragg R-factor (%) | 1.72 | 7.9 | 6.4 |
| -factor (%) | 1.09 | 4.4 | 4.0 |
III.2 Magnetic Properties
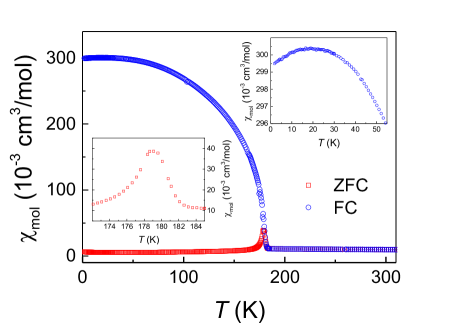
Our magnetic susceptibility data of EuCrO3 show magnetic ordering at about 178(1) K, as had already been described by Tsushima et al.Tsushima1969 and recently by Prado-Gonjal et al.Gonjal2013
The temperature dependence of the magnetization for EuCrO3 shown in Fig. 3 exhibits a pronounced thermal hysteresis with a splitting of field cooled (FC) and zero-field cooled (ZFC) susceptibility starting at 178 K, indicating a weak ferromagnetic component with a saturation of the FC component at low temperatures. This weak ferromagnetic component Tsushima1969 has been attributed to a slight spin canting of the Cr3+ moments.
At sufficiently high temperatures above long-range ordering, the magnetic susceptibility follows a Curie-Weiss law according to
| (1) |
The Curie constant, = which depends on the Avogadro number , the Boltzmann constant , the -factor , the Bohr magneton and the spin values of the respective magnetic entities is given by
| (2) |
The term, = + in Eq. (1), was added to take care of the temperature independent diamagnetic () and Van Vleck contributions (). From the tabulated diamagnetic increments for the individual ions, was estimated to contribute -6810-6 cm3/mol to the temperature independent part of the magnetic susceptibility.Selwood1956 Van Vleck contributions which become especially important for the magnetism of Eu3+ are weakly temperature dependent and will be discussed below.
For convenience sake, one defines the effective magnetic moment as
| (3) |
For Cr3+ with three electrons occupying the orbitals, in a first approximation, it is justified to assume spin-only magnetism with 2 and a spin value of = 3/2.Abragam1970 Accordingly, one expects an effective magnetic moment for Cr3+close to .
Fig. 4 displays the inverse magnetic susceptibilities of EuCrO3 at high temperatures. The data reveal a magnetic field dependence for small magnetic fields which we attribute to a slight trace of ferromagnetic impurities, possibly EuO or CrO2, which saturates at higher fields. The data collected at 1 T and 3 T fall on top of each other and these are used for further analysis.
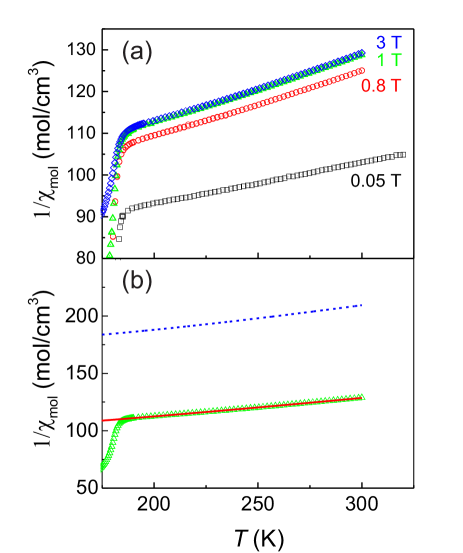
A first analysis of the high temperature susceptibility data in terms of the Curie-Weiss law (Eq. (1)) points to a negative Curie-Weiss temperature about three times larger in magnitude than the long-range ordering temperature. The negative Curie-Weiss temperature indicates sizable predominant antiferromagnetic spin exchange interaction. The derived Curie-Weiss Constant of 6.1 cm3K/mol gave an effective magnetic moment of 6.98 . If we attribute the difference to the Cr3+ moment simply to the magnetism of the Eu3+ ion by using = , we arrive at effective moments for Eu3+ of the order of 5.9 , which is by far too large compared to what is expected for Eu3+ systems at room temperature ( = 3.4 Earnshaw1968 ).
In order to clarify this discrepancy we followed an alternative approach: The magnetic moment of Eu3+ emerges due to the gradual thermal population of states with taking values of = 0, 1, …, 6. Accordingly, Eu3+ typically shows a weak temperature dependent van Vleck paramagnetism with a typical room temperature value of about 410-3 cm3/mol.Lueken1999 The effective magnetic moment derived using Eq. (3) exhibits a strong temperature dependence approaching zero at low temperatures. Using the energy separation of the states which is determined by the spin orbit coupling parameter and calculating their thermal population, the effective moment and the susceptibility of Eu3+ have been derived e. g. by Lueken.Lueken1999 (Eu3+) shows a weak temperature dependence and typically increases from liquid He temperatures to room temperature by about 15%.Tanner1994
In order to fit the magnetic susceptibility of EuCrO3 we included the Cr part according to (Cr3+) and allowed in Eq. (1) in addition to the temperature independent diamagnetic contributions a temperature dependent Van Vleck susceptibility of Eu3+, . Fig. 4(b) shows the fit of Eq. (1) to the experimental data including diamagnetic, Van Vleck contribution from Eu3+ ions and a Curie-Weiss contribution from the Cr3+ ions applying a Curie constant = 1.873 cm3K/mol corresponding to an effective moment of . In order to fit the data, it was found necessary to multiply the Eu contribution by a factor of 1.26 to enhance the Van Vleck susceptibility. This enhancement can either be due to the magnetic polarization of the Eu moments by the Cr moments or it may be ascribed to a slight change of the susceptibility due to crystal field splitting effects of the excited levels which has not taken into consideration in the calculation of the susceptibility of the free Eu3+ moments.Lueken1999 As a consequence of the proposed fitting procedure employed to fit the high-temperature magnetic susceptibility of EuCrO3, the Curie-Weiss temperature is reduced by about 35% but it is found still a factor of two larger than the Néel temperature.
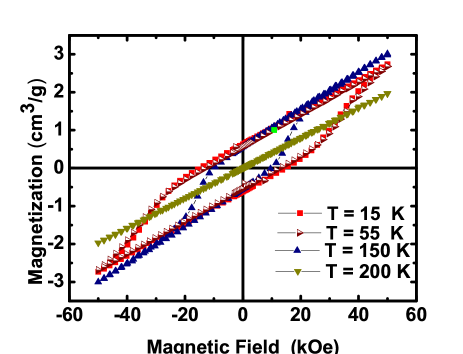
Fig. 5 shows the magnetization versus magnetic field for temperatures above and below the Néel temperature of 178 K of a polycrystalline sample of EuCrO3. Below the Néel temperature, a remanent moment is striking which amounts to 0.75 cm3/g or about 0.033 per Cr atom. If we take a random orientation of the crystallites into consideration, this finding implies a weak ferromagnetic moment per Cr atom of 0.1 , in agreement with previous findings.Tsushima1969
III.3 Heat Capacity
The heat capacities of most rare earth orthochromites, RCrO3 (R = La. Pr, Nd, Sm. Gd, Dy, Ho, Er and Y) have been measured by Satoh et al. down to liquid nitrogen temperature and the anomalies associated with the long-range magnetic ordering of Cr3+ have been well documented.Satoh1997 Recently, Bartolomé et al. and Su et al. have extended the heat capacity measurements on the systems NdCrO3, YbCrO3, and HoCrO3 down to liquid helium temperatures.Bartolome2000 ; Su2010 ; Su2011 It appears that only Bartolomé et al. have ventured to compare the heat capacity with a lattice reference (LaGaO3) in order to extract the magnetic contributions to the heat capacity of NdCrO3. They were especially interested in the crystal field splitting of the Nd3+ ions but also worked out the magnetic entropy associated to the long-range ordering of the Cr moments. To the best of our knowledge, the heat capacity of EuCrO3 has not been determined yet. Fig. 6(a) shows the heat capacity of EuCrO3 and that of LaCrO3 and the non-magnetic reference material LaGaO3 for comparison. The latter was taken from the work of Bartomolomé et al.. Bartolome2000 The magnetic contribution to the heat capacity of EuCrO3, , (see inset Fig. 6(a)) was obtained by subtracting a lattice reference which was calculated by down-scaling the temperatures of the heat capacity of LaGaO3 by a Lindemann factor.Lindemann1910 ; Tari2003 The Lindemann factor which takes into account the atom mass differences of the constituents of EuCrO3 and LaGaO3 was estimated from the atomic weights and the volumes of the nuclear unit cells to 0.95.Kim2007 The magnetic contribution to the heat capacity is characterized by a -shaped peak at 176(1) K. The anomaly is somewhat narrower than the analogous anomaly found for NdCrO3.Bartolome2000 The latter also does not exhibit the shoulder seen in the of EuCrO3 at 130 K.
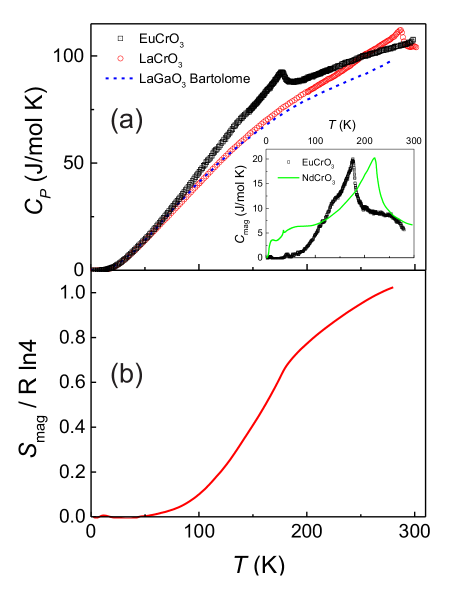
The magnetic entropy, , removed by the long-range ordering of the Cr moments in EuCrO3 was calculated by integrating , according to
| (4) |
At 275 K, the magnetic entropy amounts to
in agreement with the entropy
| (5) |
expected for a = 3/2 system.
The detailed temperature dependence of the magnetic entropy displayed in Fig. 6(b) reveals that about 70% of the total magnetic entropy are removed below the Néel temperature. Only 30% are acquired in the regime of critical fluctuations above .
Our heat capacity results confirm long-range magnetic ordering below a Néel temperature of 176 K, in agreement with the magnetization data. The entropy data pinpoint a = 3/2 magnetic system ordering consistent with the configuration of the Cr3 cations while contributions to the magnetic heat capacity arising from the Eu3+ cations are not apparent. Bartolomé et al. found a similar result for Cr ordering in NdCrO3, but also detected an additional contribution from Nd crystal electric field excitations below 100 K.Bartolome2000
III.4 Magnetic Structure
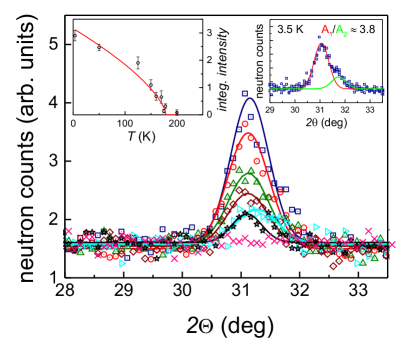
First evidence for magnetic scattering was gained by comparing the diffraction patterns collected at = 280 and 3.5 K on the Dualspec diffractometer with neutrons of a wavelength of 1.3282 Å (cf. Fig. 2). Apart from the dominating Bragg reflections arising from the Al container, weaker nuclear Bragg reflections are seen. In addition to the nuclear Bragg peaks, a magnetic Bragg reflection was identified at 17.15o( = 4.41(2) Å). The 280 K pattern is featureless in this part of the diffraction pattern. Measurements at the larger wavelength (see below) reveal that this reflection consists of two reflections which can be indexed as (011)/(101), the latter one shifted to higher angles, allowing for an understanding of the asymmetric peak shape noticeable in the 1.3282 Å pattern. The refinement of the magnetic structure will be described in more detail below.
Firstly, we will discuss the dependence of the intensity and the splitting of these reflections on the temperature. Fig. 7 displays in an overview the temperature dependence of the magnetic reflection observed at = 4.41(2) Å, highlighting its disappearance between 170 and 200 K. A closer inspection of the shape of this reflection reveals a shoulder on the high angle side, indicating that it is composed of two overlapping reflections. We successfully de-convoluted it by fitting two Gaussian functions, with the Gaussian at the high angle shoulder having an intensity of about of the main line (see top right inset in Fig. 7). The splitting of two reflections which amounts to 0.7o is approximately independent of the temperature, indicating temperature stability of the magnetic structure. The two reflections can be indexed as (011) and (101). They are only slightly separated as a consequence of the similar and lattice parameters.
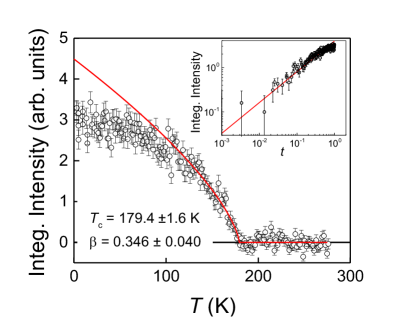
A more complete temperature dependence of the (011)/(101) magnetic reflection was collected on NRC’s triple-axis spectrometer N5, using an elastic configuration by adjusting to 30 meV (1.6513 Å) and the momentum transfer to 1.4164 Å-1. Fig. 8 displays the integrated intensity versus temperature in a linear and log-log scale versus reduced temperature.
A power law according to
| (6) |
where the integrated intensity , was fitted to the background-corrected intensities by using data within the reduced temperature range = ( - )/) 0.25. The fits resulted in a critical temperature
| (7) |
which is good in agreement with the susceptibility and heat capacity data. The critical exponent derived from the fit amounts to
| (8) |
consistent with the critical exponents of standard universality classes.LeGuillou1977 The inset in Fig. 8 shows the data in a log-log scale highlighting the good agreement of the critical power law down to reduced temperatures of 310-3 with a critical exponent given in Eq. (8).
Finally, we describe the magnetic structure of EuCrO3. The symmetry analysis for orthorhombic ABO3 compounds has been carried out and described in detail by Bertaut.Smart3B According to the symmetry analysis, four representations of the base vectors are possible for the Cr atom, occupying the sites (,0,0), (,0,) (0,,), and (0,,0). Three of these representations, (, , and ), are compatible with a weak ferromagnetic component. A good fit of magnetic refinement of our NPD pattern collected at 3.5 K is achieved based on the representation, i.e. a magnetic structure (see Fig. 9) with a negligible component along the direction. The small but finite ferromagnetic component () which was already indicated by a spontaneous magnetization component in the susceptibility data, is discussed below.
The refined magnetic moment of the Cr atoms at 3.5 K amounts to
| (9) |
consistent with the expected value of 3 for a = 3/2 system with a -factor 2.
Fig. 9 displays the magnetic structure of EuCrO3 as refined assuming a dominant spin configuration and a slight canting leading to a weak ferromagnetic moment along of 0.1 .
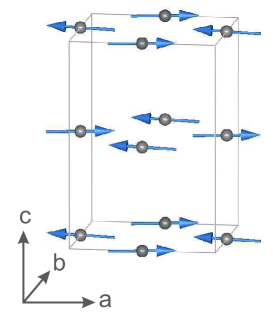
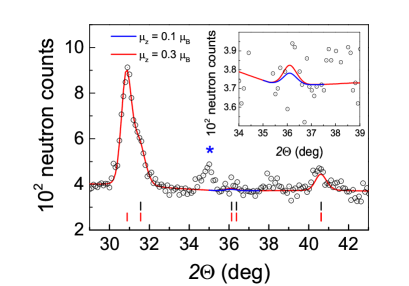
In the diffraction pattern collected with = 1.3282 Å, the (011)/(101) magnetic reflections are overlapping. Choosing a wavelength of 2.37Å allows us to resolve them and to compare their intensities with the expected intensities of the magnetic structure. Fig. 10 displays the profile refinement as well as a very weak peak at 36.2o. This peak results from the nuclear and magnetic diffraction, the latter is due to the small ferromagnetic component along the -axis. Model calculations (see Fig. 10) indicate the ferromagnetic component to lie between 0.1 and 0.3 , consistent with the magnetization measurements (see above). This finding implies a canting angle of the Cr moment out of the - plane between 2.4 and 7o.
III.5 Structural Properties at Low Temperatures
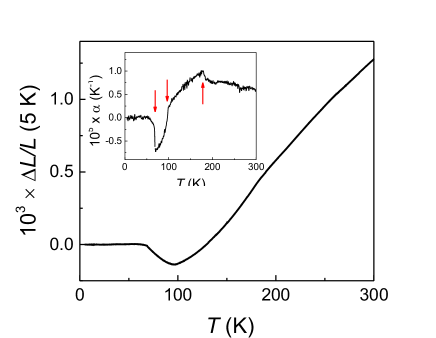
In order to investigate the crystal structure and structural changes below room temperature and to search for magnetoelastic distortions, we have carried out linear thermal expansion, powder XRPD and Raman scattering measurements down to liquid helium temperature. A first overview of thermal and magnetoelastic effects on the lattice properties becomes available from the measurement of the dilatometric length change of a polycrystalline pellet (Fig. 11). Starting from lowest temperatures and slowly (0.5K/min) raising the temperature, the length change is characterized by an extended plateau whereas the sample starts to contract above 70 K, i.e. EuCrO3 shows negative thermal expansion between 70 and 100 K. Above 100K the sample length grows monotonically with a slight change of the slope at 175 K, i.e. in the range of the Néel temperature. The anomalous behavior below 100 K is clearly revealed in the coefficient of linear thermal expansion, = () (see inset Fig. 11) which is negative between 70 and 100 K.
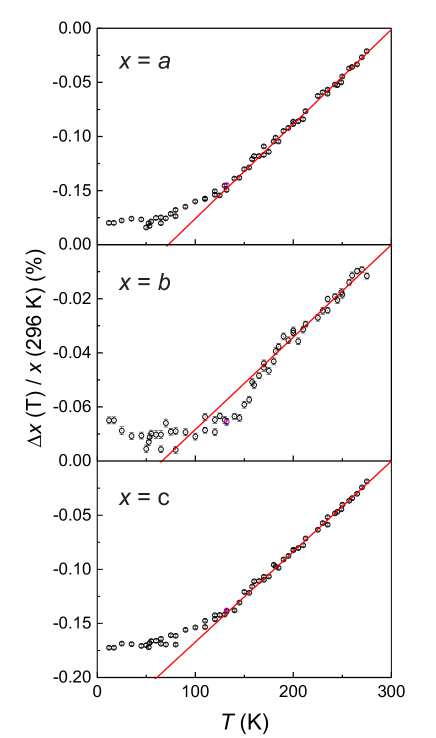
The thermal expansion measurements have been carried out on a randomly oriented polycrystalline pellet. Detailed directional information of the thermal and magnetic effects on the lattice properties was obtained from a series of powder XRPD measurements over the temperature range from 10 K to room temperature. Fig. 12 displays the orthorhombic lattice parameters versus temperature. While and show about the same temperature behavior, the temperature variation of is by a factor of 2.5 smaller than the contraction of and . A noticeable anomaly associated with long-range antiferromagnetic ordering below 178 K, clearly seen in the thermal expansion measurements is only visible in the lattice parameter. Below 175 K, exhibits a slight anomalous decrease below the linear part found for all lattice parameters above 200 K. also exhibits a slight increase towards lowest temperatures, i.e. a slightly negative thermal expansion whereas and have a positive thermal expansion throughout the whole temperature range. The cell volume shows positive thermal expansion in the whole temperature range indicating that the small magnetoelastic distortion in is compensated by the temperature behavior of and . Subtle anomalies in all XRPD derived lattice parameters between 50 and 70 K may be associated to the negative thermal expansion anomaly seen in the capacitance dilatometer measurements (cf. Fig. 11).
Raman scattering investigations on the series of orthochromites RCrO3 ( = Y, La, Nd, Pr, Sm, Gd, Dy, Ho, Er, Yb, Lu) have been rather extensively carried out at room temperature as well as 100 K in order to assign the phonon modes and to study the lattice response to magnetic ordering either of the Cr or of the rare earth moments.Iliev2006 ; Weber2012 ; ElAmrani2014 Our dilatometer measurements and the low-temperature XPD data indicated magnetoelastic distortions of the lattice. Raman spectroscopy of the phonon modes allows to trace very sensitively subtle changes of the lattice and to identify possible structural and magnetic phase transitions.
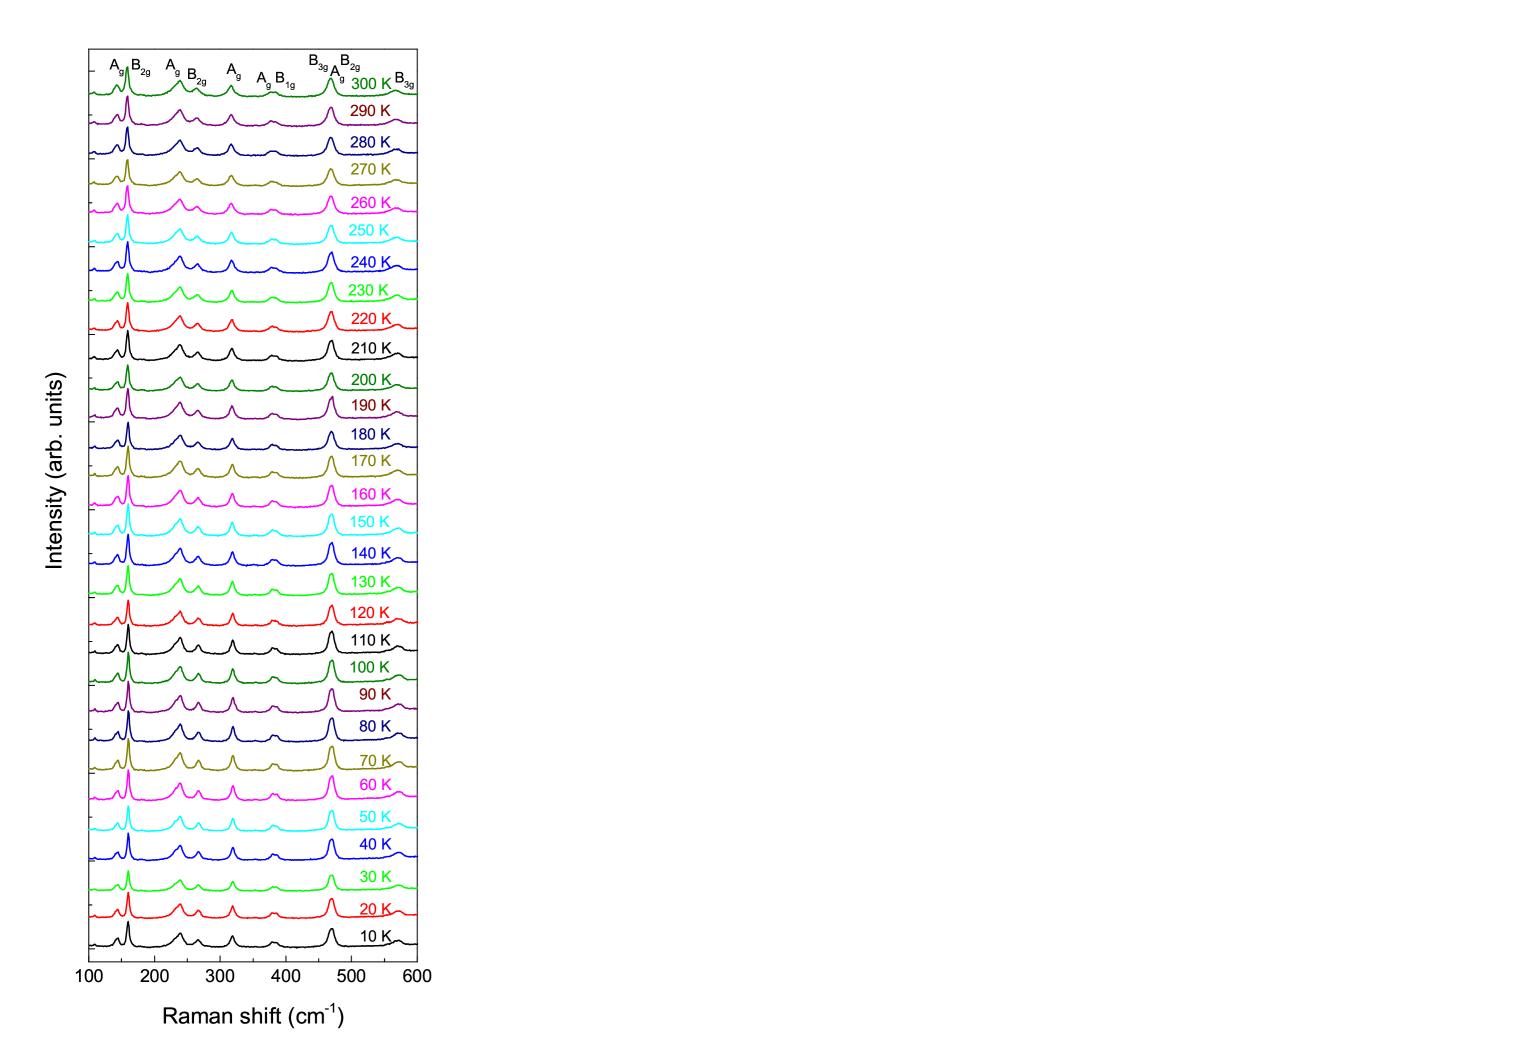
At present, only one Raman study on EuCrO3 down to 90 K is available reporting some anomalies near the Néel temperature in the shift of some modes as well as in their linewidth.Venkata2013 Here, we have extended these investigation and examined the Raman spectra down to 10 K and studied in detail the shift of the modes and their linewidth versus temperature. According to group theory one expects 24 Raman active modes for EuCrO3: 7 + 5 + 7 + 5 , involving vibrations of Eu and the oxygen atoms.Bilbao Fig. 13 shows the Raman spectra between 10 K and room temperature with the assignments according to Weber et al..Weber2012 The spectra contain only 11 Raman modes, thus the other predicted modes have either too low an intensity to be observed or they are located below our experimental region. The spectra are similar to what has been observed for other rare earth orthochromites and from the dependence of the mode energies on the ionic radii of the rare earth atoms fall between the spectra of GdCrO3 and SmCrO3. The - doublet near 375 cm-1 is split whereas the mode at 470 cm-1 is still degenerate but clearly broadened as compared to other modes in its neighborhood. Above 600 cm-1 a broad band is seen which is centered at 650 cm-1. It corresponds to the analogous broad band at 720 cm-1 in LaCrO3 which has been assigned to lattice imperfections possibly involving Cr4+ centers.Iliev2006 At first glance, all Raman mode frequencies appear to not be affected by lowering the temperature. A closer inspection of the shift and the linewidth of the Raman modes was carried out by fitting Lorentzian lines to the modes. This procedure discloses especially weak but noticeable softening for all analyzed modes below 75 K. Some modes show additional magnetic anomalies below 175 K. Generally, the linewidths decrease and pass through a minimum at 75 K and grow again towards lowest temperatures. Noticeable magnetic anomalies could not be detected in the mode linewidths at the Néel temperature around 175 K.
The temperature dependent change of the frequency of a phonon mode of an insulator with frequency , comprises contributions from the change of the lattice volume, due to thermal expansion or contraction (including lattice anomalies) and also magnetostrictive induced changes of the unit cell volume, intrinsic multi-phonon anharmonic contributions, , and contributions from spin-phonon coupling effects, . These superimpose according toGranado1999A
| (10) |
The lattice contributions are proportional to the volume change, and connected via the mode Grüneisen parameter, via
| (11) |
Assuming mode Grüneisen parameters 1 our XPD results indicate mode shifts of the order of 0.4% over the whole temperature range. Especially the magnetoelastic effct seen in the lattice parameter is very weak and cannot explain magnetic contributions.
Anharmonic decay processes add an additional contribution to the phonon linewidths and lineshifts. Based on the work of Klemens assuming three and fourfold phonon-decay processes, Balkanski has derived the following relationship for the temperature dependence of the anharmonic line shift and linewidthKlemens1966 ; Balkanski1983
| (12) |
where and are Bose-Einstein statistical factors, and , respectively, with = and = appropriate for the decay of an optical phonon into two and three acoustic phonons of identical energy.Klemens1966 An analogous relationship holds for the phonon linewidth.Balkanski1983
Spin-phonon coupling caused by the modulation of the spin exchange interaction by lattice vibrations adds another channel for magnetic renormalization of the phonon frequencies.Baltensperger1968 It is proportional to the spin-spin correlation function and the second derivative of the spin exchange integral with respect to the coordinate connection the spin and .Granado1999A ; Sharma2014 Using the molecular field approximation of the spin-spin correlation function, , is proportional to the square of the sublattice magnetization according to
| (13) |
Spin-phonon coupling renormalization of the mode lineshift is subject to the modulation of the spin exchange and generally effects modes at different frequencies differently, depending on the manner of how the spin exchange is affected by the relevant lattice vibrations modifying the bonding distances and angles especially to the oxygen cations mediating the superexchange.
Fig. 14 displays the Raman shift, the linewidth and the residual - of the at 160 cm-1. The mode assignment has been adopted from the Refs. Iliev2006, ; Weber2012, .
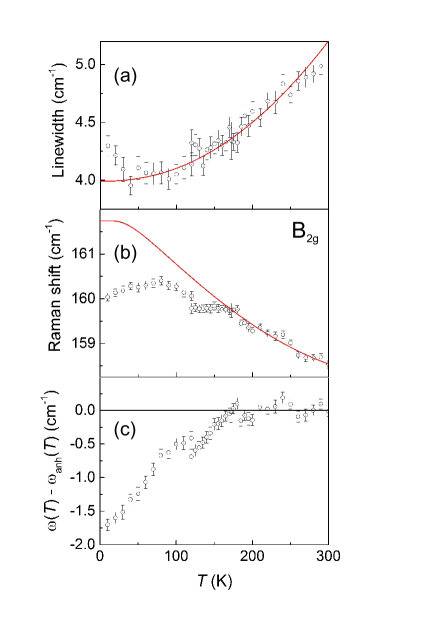
Raman shift and linewidth above 175 K follow well a temperature dependence expected for anharmonic phonon decay processes according to Eq. (14). Anomalies in the Raman shift of the 160 cm-1 mode at 175 K and near correspond well to antiferromagnetic ordering and to the anomaly seen in the thermal expansion (see Fig. 11. Between 175 and 125 K, the Raman shift levels off apparently due to magnetic effects. After a step-like increase below 125 K, the Raman shift passes through a maximum centered at 75 K and decreases again to lowest temperatures. In contrast to the Raman shift, the linewidth shows no apparent magnetic anomalies in this temperature regime. Though, analogous to the shift, the linewidth attains a minimum at 75 K and grows again by about 10% to the lowest temperatures.
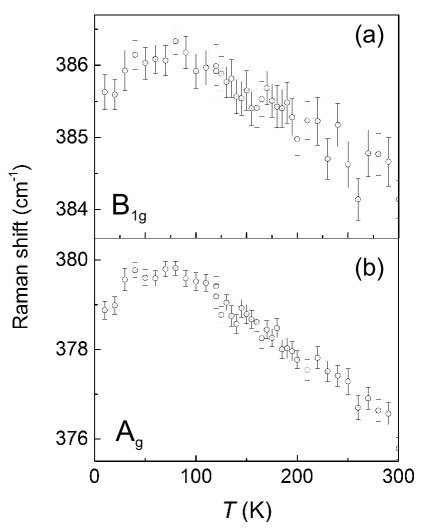
Fig. 15 displays the Raman shift of the - doublet near 380 cm-1. In contrast to the 160 cm-1 mode, magnetic effects in Raman modes at higher frequencies are either weaker or cannot be verified due to an increased linewidth of theses modes. Fig. 16 shows the Lorentzian FWHM of these two modes. However, the Raman shifts as well as the linewidth show a maximum and a minimum centered at 75 K similar to the behavior of the 160 cm-1 mode.

Similarly, the increase/decrease of the shift/linewidth towards very low temperatures correspond to the negative thermal expansion indicated by the temperature dependence of the lattice parameter and the anomalous length change at these temperatures. At these temperatures, magnetic effects of the Cr ordering can safely be ruled out since the Cr moments have reached saturation at these temperatures (see Figure 8). To what extend, the Eu3+ magnetism and especially the temperature dependent of thermal population of the 7FJ ( 0) levels may be responsible for the observed effect remains elusive at present.
III.6 Dielectric Properties
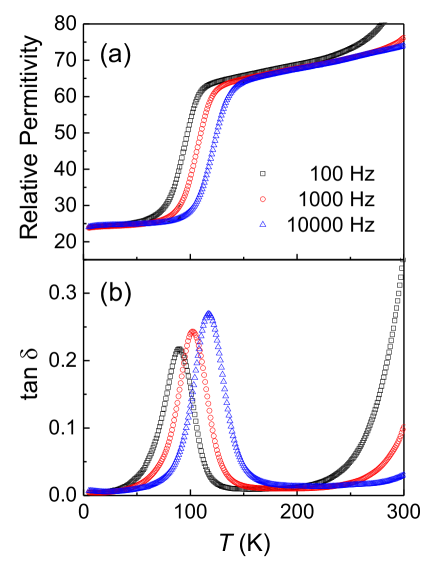
The structural anomaly detected by the thermal expansion at 100 K has a corresponding anomaly in the dielectric properties. Fig. 17(a) and (b) show the relative permittivity and the dielectric loss of EuCrO3, measured at frequencies of 100, 1000 and 10000 Hz. On cooling, the relative permittivity (Fig. 17(a)) exhibits a step-like feature which for 100 Hz starts at 100 K and leads to a decrease of the permittivity by a factor of 2.5. By increasing the frequency, the step-like feature moves to higher temperatures. The permittivity step and its frequency dependence are accompanied by a broad resonance-like feature in dielectric loss in Fig. 17(b). The peak temperature of the frequency dependent dielectric loss maximum at range between 80 and 125 K. This temperature interval coincides with the position of the highest slope in the capacitance and the observed anomaly in thermal expansion Fig. 11. Measurements in magnetic fields up to 5.5 T did not alter the observed anomalies in dielectric properties.
The frequency shift of exhibits an activated behavior (Fig. 18) according to
| (14) |
with an activation energy, , of
and an attempt frequency of
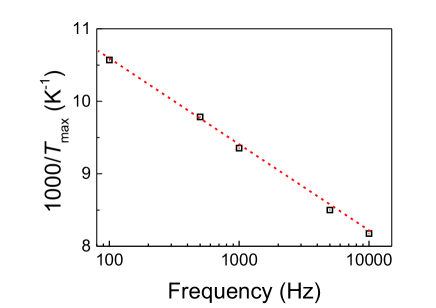
IV Discussion and Conclusion
EuCrO3 which crystallizes with the GdFeO3 structure-type orders antiferromagnetically below 178 K as we could show using a combination of magnetic susceptibility, heat capacity and NPD measurements. The magnetic susceptibility data reveal weak ferromagnetism below the Néel temperature, in agreement with earlier studies.Tsushima1969 ; Gonjal2013 The magnetic contribution to the heat capacity is characterized by a -type anomaly at the Néel temperature containing a magnetic entropy in agreement with the entropy expected for a spin = 3/2 magnetic system consistent with the electronic configuration of the Cr3+ cations. Our XRPD and NPD measurements provide precise atomic positions of all atoms in the cell, especially for the light oxygen atoms. The low-temperature NPD data revealed extra Bragg peaks of magnetic origin which can be attributed to a antiferromagnetic structure with an ordered moment of 2.4 consistent with an =3/2 spin-only groundstate. The weak ferromagnetic moment points along the -axis and it amounts to 0.1, consistent with magnetization data. Evidence for an ordering of the Eu moments is neither found in the NPD data nor in the heat capacity data or magnetization data.
The contribution of the Eu3+ cations to the magnetism is rather characterized by a weakly temperature dependent Van Vleck-type paramagnetism arising from the successive population of 0 excited magnetic states. Indication of a polarization of the Eu moments by the ordered Cr moments can be derived by the fits of the high-temperature () magnetic susceptibility data. Effects of the Eu magnetism could be the origin of the slight decrease of the saturation magnetization below 20 K (see inset Fig. 3) and the decrease of the Raman lineshifts and the linewidth (see Figs. 14, 15 and 16) and also the slight negative thermal expansion along the axis at low temperatures. (see Fig. 12).
Structural anomalies detected in the dielectric Raman scattering and thermal expansion data indicate magnetoelastic distortion. These are clearly visible in the shift of some Raman modes at higher temperatures and also the dilatometer measurements of the lenght change carried out on a polycrystalline sample. Most striking is the anomalous contraction of the lattice parameter below . It can be understood on the basis of the -type antiferromagnetic structure with essentially antiparallel arrangement of the nearest neighbor Cr moments in the - plane and the tendency to strengthen the antiferromagnetic spin exchange coupling by decreasing the Cr - Cr distance. The decrease of the lattice parameter leads to a shortening of Cr - O2 distances, i.e. of the Cr to the oxygen atoms connecting the CrO6 octahedra in the - plane leading also to a decrease of the nearest neighbor Cr - Cr distance in the - plane (3.84 Å). Such a distance decrease leads to a strengthening of the superexchange interaction.deJongh1975; Shrivastava1976 ; Jansen1977 The effect of the bond-length decrease is partially compensated by a Cr - O2 - Cr bonding angle reduction. When decreasing , the bonding angle is slightly moving away from the favoring 180o Cr - O - Cr configuration. This effect is obviously less determining than that induced by the distance decrease. Along the -axis, the decrease of the parameter also leads to a slight decrease of the Cr - O1 bond distance, i.e. of the Cr atoms to the apical oxygen atoms in the CrO6 octahedra. The bonding angle Cr - O1 - Cr also slightly increases when shrinks. Both effects favor an growth of the antiferromagnetic spin exchange along . In total, the anomalous axis shortening starting below is a consequence of the -type antiferromagnetic ordering and the tendency to minimize the exchange energy and to strengthen the antiferromagnetic structure.
We finally discuss the anomalies seen in the dielectric permittivity and the conductance observed at temperatures around 100 K. The anomalies show activated behavior with an activation energy of 170 meV similar to the activation energy of a relaxor-like ferroelectric features detected in CeCrO3, however at significantly higher temperatures.Shukla2009 For CeCrO3 an activation energy of 130 meV was derived. Such energies correspond to typical optical phonon frequencies of oxygen related vibrations suggesting a vibrational origin of the dielectric anomalies. However, the calculated frequencies are largely different from Raman oxygen frequencies possibly indicating a different origin of the observed dielectric anomalies in both compounds. The dielectric anomalies in EuCrO3 are paralleled by anomalies in the thermal expansion indicating some origin in lattice anomalies which however could not be clearly detected by the less sensitive XRPD measurements. The absence of any magnetic field dependence also supports a lattice origin of the dielectric anomalies.
In summary, we have conclusively established the Cr antiferromagnetic ordering and investigated and discussed associated anomalies in various lattice, thermal and electric properties in EuCrO3. Our investigations add to complete the knowledge of the unusual physical and especially magnetic properties of the rare earth orthochromite series.
Acknowledgment
This work was financially supported by Brock University, the Natural Sciences and Engineering Research Council of Canada (NSERC), the Ministry of Research and Innovation (Ontario), and the Canada Foundation for Innovation, Canada. We thank E. Brücher and G. Siegle for expert experimental assistance and J. Rodríguez-Carvajal for advice with the size/shape refinement of the the particle size.
References
- (1) W. C. Koehler and E. O. Wollan, J. Phys. Chem. Solids, 2, 100 (1957).
- (2) R. M. Hornreich, J. Mag. Mag. Mater., 7, 280 (1978).
- (3) J. i. R. Sahu, C. R. Serrao, N. Ray, U. V. Waghmare, and C. N. R. Rao, J. Mater. Chem., 17, 42 (2007).
- (4) B. Rajeswaran, D. I. Khomskii, A. K. Zvezdin, C. N. R. Rao, and A. Sundaresan, Phys. Rev. B, 86, 214409 (2012).
- (5) B. Raveau and M. M. Seikh, Z. Anorg. Allg. Chem., 640, 2649 (2014).
- (6) R. Saha, A. Sundaresan, and C. N. R. Rao, Mater. Horiz., 1, 20 (2014).
- (7) K. R. S. P. Meher, A. Wahl, A. Maignan, C. Martin, and O. I. Lebedev, Phys. Rev. B, 89, 144401 (2014).
- (8) A. McDannald, L. Kuna, M. S. Seehra, and M. Jain, Phys. Rev. B 91, 224415 (2015).
- (9) E. F. Bertaut and J. Mareschal, Solid State Comm., 5, 93 (1967).
- (10) E. F. Bertaut in Magnetism, Volume III ed. by G. T. Smart and H. Suhl (Academic Press, 1963).
- (11) L. Holmes, M. Eibschütz, and Lg. Van Uitert, J. Appl. Phys., 41, 1184 (1970).
- (12) H. B. Lal, K. Gaur, R. D. Dwivedy, and N. Srivastava, J. Mat. Sci. Lett., 8, 1434 (1989).
- (13) J. Prado-Gonjal, R. Schmidt, J. J. Romero, D. Ávila, U. Amador, and E. Morán, Inorg. Chem., 52, 313 (2013).
- (14) K. Tsushima, I. Takemura, S. Osaka, Solid State Commun., 7, 71 (1969).
- (15) V. S. Bhadram, B. Rajeswaran, A. Sundaresan, and C. Narayana, Eur. Phys. Lett. 101, 17008 (2013).
- (16) M. Taheri, S. Trudel, R. K. Kremer, and F. S. Razavi, J. Appl. Phys., 118, 124306 (2015).
- (17) D. H. Ryan and L. M. D. Cranswick, J. Appl. Cryst., , 198 (2008)
- (18) J. Rodríguez-Carvajal, Physica (Amsterdam), 192B, 55 (1993).
- (19) M. Rotter, H. Müller, E. Gratz, M. Doerr, and M. Loewenhaupt, Rev. Sci. Instrum., 69, 2742 (1998).
- (20) P. G. Reuvekamp, R. K. Kremer, J. Köhler, and A. Bussmann-Holder, Phys. Rev. B 90, 094420 (2014).
- (21) P. G. Reuvekamp, R. K. Kremer, J. Köhler, and A. Bussmann-Holder, Phys. Rev. B 90, 104105 (2014).
- (22) P. Reuvekamp, K. Caslin, Z. Guguchia, H. Keller, R. K Kremer, A. Simon, J. Köhler and A. Bussmann-Holder, J. Phys.: Condens. Matter 27 262201 (2015).
- (23) P. W. Selwood, Magnetochemistry, (Interscience, New York, 2nd edn, 1956).
- (24) The x-ray absorption has been estimated using the software provided on the webpage: http://11bm.xray.aps.anl.gov/absorb/absorb.php.
- (25) A. Abragam and B. Bleaney, Electron Paramagnetic Resonance of Transition Ions, (Oxford University Press, 1970).
- (26) A. Earnshaw, Introduction to Magnetochemistry, (Academic Press. Inc. Ltd. 1968)
- (27) H. Lueken, Magnetochemie, (Teubner Verlag, Leipzig, 1999),
- (28) P. A. Tanner, V. V. R. K. Kumar, C. K. Jayasankar, and M. F. Reid, J. Alloys Comp., 215, 34 (1994).
- (29) H. Satoh, S. Koseki, M. Takagi, W. Y. Chung, and N. Kamegashira, J. Alloys Comp., 259, 176 ( 1997).
- (30) F. Bartolomé, J. Bartolomé, M. Castro, J. J. Melero, Phys. Rev. B, 62, 1058 (2000).
- (31) Y. Su, J. Zhang, Z. Feng, L. Li, B. Li, Y. Zhou, Z. Chen, and S. Cao, J. Appl. Phys., 108, 013905 (2010).
- (32) Y. Su, J. Zhang, Z. Feng, Z. Li, Y. Shen, and S. Cao, J. Rare Earths, 29, 1060 (2011).
- (33) F. A. Lindemann, Z. Physik 11, 609 (1910).
- (34) A. Tari, The Specific Heat of Matter at Low Temperatures, (Imperial College Press 2003).
- (35) J. W. Kim, Y. S. Oh, K. S. Suh, Y. D. Park, and K. H. Kim, Thermochimica Acta, 455, 2 (2007).
- (36) J. C. LeGuillou and J. Zinn-Justin, Phys. Rev. Lett 39, 95 (1977); Phys. Rev. B21, 3976 (1980).
- (37) M. N. Iliev, A. P. Litvinchuk, V. G. Hadjiev, Y. Q. Wang, J. Cmaidalka, R. L. Meng, Y. Y. Sun, N. Kolev, and M. V. Abrashev, Phys. Rev. B, 74, 214301 (2006).
- (38) M. C. Weber, J. Kreisel, P. A. Thomas, M. Newton, K. Sardar, and R. I. Walton, Phys. Rev. B, 85, 054303 (2012).
- (39) M. E. Amrani, M. Zaghrioui, V. TaPhuoc, F. Gervais, and N. E. Massa, J. Mag. Mag. Mater., 361, 1 (2014).
- (40) Calculated using the Bilbao Crystallography Server; www.cryst.ehu.es/rep/sam.html.
- (41) E. Granado, A. García, J. A. Sanjurjo, C. Rettori, and I. Torriani F. Prado, R. D. Sánchez, and A. Caneiro, and S. B. Oseroff, Phys. Rev. B 60, 11879 1999.
- (42) P. G. Klemens, Phys. Rev., 148, 845 (1966).
- (43) M. Balkanski, R. F. Wallis, and E. Haro, Phys. Rev., 28, 1928 (1983).
- (44) W. Baltensperger and J. S. Helman, Helv. Phys. Acta 41, 668 1968.
- (45) Y Sharma, S. Sahoo, W. Perez, S. Mukherjee, R. Gupta, A. Garg, R. Chatterjee, and R S. Katiyar, J. Appl. Phys. 115, 183907 (2014).
- (46) E. Granado, P. G. Pagliuso, J. A. Sanjurjo, and C. Rettori, M. A. Subramanian, S.-W Cheong, and S. B. Oseroff, Phys. Rev. B 60, 6531 1999.
- (47) K. N. Shrivastava and V. Jaccarino, Phys. Rev. B, 13, 299 (1976).
- (48) L. Jansen and R. Block, Physica 86B + C, 1012 (1977).
- (49) R. Shukla, A. K. Bera, S. M. Yusuf, S. K. Deshpande. A. K. Tyagi, W. Hermes, M. Eul, and R. Pöttgen, J. Phys. Chem. C, 113, 12663 (2009).