Ultraviolet Diversity of Type Ia Supernovae
Abstract
Ultraviolet (UV) observations of Type Ia supernovae (SNe Ia) probe the outermost layers of the explosion, and UV spectra of SNe Ia are expected to be extremely sensitive to differences in progenitor composition and the details of the explosion. Here we present the first study of a sample of high signal-to-noise ratio SN Ia spectra that extend blueward of 2900 Å. We focus on spectra taken within 5 days of maximum brightness. Our sample of ten SNe Ia spans the majority of the parameter space of SN Ia optical diversity. We find that SNe Ia have significantly more diversity in the UV than in the optical, with the spectral variance continuing to increase with decreasing wavelengths until at least 1800 Å (the limit of our data). The majority of the UV variance correlates with optical light-curve shape, while there are no obvious and unique correlations between spectral shape and either ejecta velocity or host-galaxy morphology. Using light-curve shape as the primary variable, we create a UV spectral model for SNe Ia at peak brightness. With the model, we can examine how individual SNe vary relative to expectations based on only their light-curve shape. Doing this, we confirm an excess of flux for SN 2011fe at short wavelengths, consistent with its progenitor having a subsolar metallicity. While most other SNe Ia do not show large deviations from the model, ASASSN-14lp has a deficit of flux at short wavelengths, suggesting that its progenitor was relatively metal rich.
keywords:
supernovae: general – supernovae: individual: SN 1992A, SN 2009ig, SN 2011by, SN 2011fe, SN 2011iv, SN 2012cg, SN 2013dy, SN 2014J, ASASSN-14lp, SN 2015F – ultraviolet: stars1 Introduction
Type Ia supernovae (SNe Ia) are thermonuclear explosions of C/O white dwarfs in binary systems (see Hillebrandt & Niemeyer, 2000, for a review). Variable amounts of 56Ni are produced in the explosion, which dictates the peak luminosity and photospheric temperature of the SN; this in turn determines the light-curve shape (Kasen & Woosley, 2007), which has been empirically measured (Phillips, 1993). These relatively simple physical connections make SNe Ia particularly good distance indicators, providing the first direct evidence for the currently accelerating expansion of the Universe (Riess et al., 1998; Perlmutter et al., 1999) and continuing to provide critical constraints on cosmological parameters (e.g., Betoule et al., 2014; Rest et al., 2014).
Despite our general physical understanding of SNe Ia, there remain significant questions about their progenitor systems (e.g., what is the nature of the companion star) and the explosion mechanism (e.g., how is the flame ignited and how does it propagate). Lacking this fundamental knowledge hinders future theoretical and observational investigations.
A unique way to probe the physics of SN Ia explosions and progenitors is through their ultraviolet (UV) spectra. While the main source of opacity for a SN atmosphere near peak brightness is electron scattering at most optical wavelengths, the UV opacity is dominated by a forest of overlapping lines from Fe-group elements (e.g., Baron et al., 1996; Pinto & Eastman, 2000). UV photons are repeatedly absorbed and re-emitted, and typically are scattered redward where they eventually escape the expanding SN ejecta. Therefore, the UV is essential for understanding the optical emission of a SN Ia (Sauer et al., 2008) as well as being extremely sensitive to both the progenitor composition and explosion mechanism. Because of the high opacities in the UV, we can use UV spectroscopy to directly probe the composition of the outermost layers of the SN which are transparent at optical wavelengths soon after explosion.
After correcting for light-curve shape, SN Ia luminosity still depends significantly on host-galaxy environment (Kelly et al. 2010; Lampeitl et al. 2010; Sullivan et al. 2010; however, for an alternative explanation, see Kim et al. 2014). This may indicate that environmental effects or progenitor properties affect our luminosity calibration. The UV can potentially improve our physical understanding of the relationship between host-galaxy mass and SN Ia luminosity.
In particular, progenitor metallicity should affect the amount of radioactive material generated in the explosion (Timmes et al., 2003) and the relationship between SN luminosity and light-curve shape (Mazzali et al., 2001; Mazzali & Podsiadlowski, 2006; Podsiadlowski et al., 2006), while also shaping the UV spectrum (e.g., Höflich et al., 1998; Lentz et al., 2001). Such a relation may significantly impact the overall SN calibration and increase the scatter in SN distance measurements (Foley & Kirshner, 2013). Additionally, if the mean SN progenitor metallicity has evolved with cosmic time, we would expect a systematic bias in cosmological distance estimates.
To address these questions, we have undertaken a major program to obtain UV spectra of SNe Ia with the Hubble Space Telescope (HST). Until now, we have focused on the detailed study of individual events (Kirshner et al., 1993; Foley et al., 2012c; Foley & Kirshner, 2013; Foley et al., 2014; Foley, 2013; Pan et al., 2015). And while other studies have examined samples of SNe Ia with UV spectra (Foley et al., 2008b; Cooke et al., 2011; Maguire et al., 2012; Wang et al., 2012), those data either did not extend blueward of 2900 Å or had low signal-to-noise ratio (S/N).
Here we present the first study of a sample of SNe Ia with near-maximum-light space-UV (extending to Å) spectra. With our sample, we are able to investigate how the spectra are influenced by other properties of the SN. With these initial results, we can account for correlations between spectral features and light-curve shape, which, in turn, can isolate effects related to other physical properties such as progenitor metallicity.
2 Data & Observations
ASASSN-14lp was discovered in NGC 4666 on 2014 December 9.6 (all dates herein are UT; Holoien et al., 2014). Spectroscopic observations on 2014 December 10.8 indicated that it was a young SN Ia (Thorstensen et al., 2014). SN 2015F in NGC 2442 was discovered on 2015 March 9.8 (Monard et al., 2015) and spectra taken on 2015 March 11.0 showed it was a young SN Ia (Fraser et al., 2015). As part of our ongoing program to obtain UV spectra of SNe Ia, we triggered HST to observe ASASSN-14lp and SN 2015F in Cycle 22 (Foley, 2014, 2015). ASASSN-14lp and SN 2015F peaked in on 2014 December 24.25 (Shappee et al., 2015) and 2015 March 24.98 (Im et al., 2015), respectively.
ASASSN-14lp and SN 2015F were observed by HST using the STIS spectrograph on 2014 December 19.81 and 2015 March 22.66, corresponding to and days relative to maximum, respectively. The observations were obtained over one orbit per SN with three different gratings, all with the slit. Exposures of 1393 s (for ASASSN-14lp; 1345 s for SN 2015F) utilized the near-UV MAMA detector and the G230L grating. For each SN, exposures of 100 s were taken with both the CCD/G430L and CCD/G750L setups. The three setups yield a combined wavelength range of 1615–10,230 Å.
The data were reduced using the standard HST Space Telescope Science Data Analysis System (STSDAS) routines to bias-subtract, flat-field, extract, wavelength-calibrate, and flux-calibrate each SN spectrum. Similar reductions were performed for the other spectra used in this study (Foley et al., 2012c; Foley & Kirshner, 2013; Foley et al., 2014; Foley, 2013; Pan et al., 2015).
In addition to the new data, we include near-maximum-light ( days) HST spectra of SNe 1992A (Kirshner et al., 1993), 2011by (Foley & Kirshner, 2013), 2011fe (Foley, 2013), 2011iv (Foley et al., 2012c), 2013dy (Pan et al., 2015), and 2014J (Foley et al., 2014). We present the maximum-light HST spectrum of SN 2012cg, originally published by Amanullah et al. (2015), but rereduced as described above (with the modest difference that the UV spectrum was obtained with the STIS CCD/G230LB setup and there was no CCD/G750L observation). To this, we also add the high-S/N near-maximum-light Swift UV spectrum of SN 2009ig (Foley et al., 2012b). While the quality of the SN 2009ig spectrum is not as high as that of the HST spectra and it does not probe shortward of 2500 Å, it still provides useful information in the near UV.
We correct all spectra for both Milky Way reddening (Schlegel et al., 1998; Schlafly & Finkbeiner, 2011) and host-galaxy reddening as derived from the SN light curves (Phillips et al., 1999; Foley et al., 2012b, c, 2014; Foley & Kirshner, 2013; Pereira et al., 2013; Silverman et al., 2013; Amanullah et al., 2014; Im et al., 2015; Pan et al., 2015; Shappee et al., 2015).
Our total sample contains 10 SNe. Of these, six (SNe 2011fe, 2011iv, 2013dy, 2014J, 2015F, and ASASSN-14lp) have HST UV spectral sequences consisting of two or more epochs of UV spectroscopy. While SN 2014J has an excellent spectral series, it also suffers from significant host-galaxy reddening (e.g., Foley et al., 2014; Goobar et al., 2014; Brown et al., 2015), reducing the S/N in the far-UV and making the intrinsic continuum difficult to infer.
3 Analysis
3.1 Sample Demographics
The diversity of peak-luminosity optical SN Ia spectra is primarily driven by the photospheric temperature, which changes the ionization state of elements, and the ejecta velocity, which shifts and broadens absorption features. This diversity can be parameterized by the pseudoequivalent widths (pEWs) of the Si ii and Si ii features (Branch et al., 2006). Alternatively, the diversity can be described by light-curve shape (e.g., ) and the maximum-light velocity of Si ii , (Wang et al., 2009). Photospheric temperature is highly correlated with both and the relative strengths of Si ii , 6355 (Nugent et al., 2002); also, the pEW of Si ii is correlated with (Foley & Kasen, 2011).
Figure 1 displays the Si ii parameter space for a sample of SNe Ia (Branch et al., 2006). Branch et al. (2006) subclassified SNe Ia by these measurements. There is a general trend from weak lines (small pEW values) to strong lines. The SNe with the weakest lines are called “Shallow Silicon” and have spectra (and light curves) similar to those of SN 1991T (Filippenko et al., 1992b; Phillips et al., 1992). The SNe with slightly stronger lines are called “Core Normal.” The SNe with the strongest Si ii lines share properties with SN 1991bg (Filippenko et al., 1992a; Leibundgut et al., 1993) and are called “Cool.” Finally, those SNe with particularly strong Si ii , which generally correlates with high ejecta velocities, are called “Broad Line.”
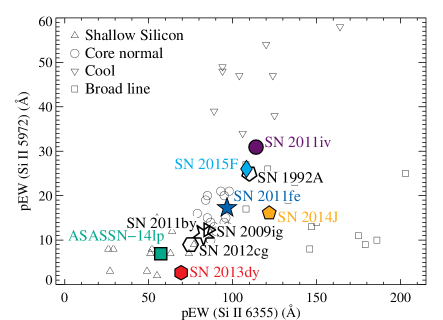
Figure 1 also displays where the SNe Ia with near-maximum-light UV spectra fall in this parameter space. For most of the sample, we were able to measure the pEWs directly from the HST spectra. However, we used other optical spectra to determine these values for SNe 1992A, 2009ig, 2011by, and 2012cg (Kirshner et al., 1993; Foley et al., 2012b; Silverman et al., 2012; Silverman et al., 2013).
The ten SNe Ia with high-S/N near-maximum-light spectra span most of the above parameter space. While the SNe generally include most of the Shallow Silicon and Core Normal region, they only barely reach the Cool and Broad-Line subclasses. Moreover, SN 2014J, which has very high and uncertain reddening, is the only true Broad-Line SN. Because of the uncertain reddening, we remove SN 2014J from our subsequent analysis, making our final sample primarily a continuum from SN 1991T-like SNe to cool, but not extremely cool SNe (i.e., similar to SN 1986G; Phillips et al. 1987), with no true Broad-Line SNe.
Optical spectral properties also correlate with light-curve shape (Nugent et al., 1995) and host-galaxy morphology (e.g., Hamuy et al., 2000; Howell, 2001). We present basic parameters, including light-curve shape, velocity, and host-galaxy morphology for the sample in Table 3.1. Light-curve shape measurements were taken from the literature (Phillips et al., 1999; Foley et al., 2012b, c, 2014; Foley & Kirshner, 2013; Pereira et al., 2013; Silverman et al., 2013; Amanullah et al., 2014; Im et al., 2015; Pan et al., 2015; Shappee et al., 2015). For the ejecta velocity, we measure the velocity of the Si ii absorption-line minimum in the optical spectra, and correct those data to their maximum-light values (Foley et al., 2011), . Host-galaxy morphology measurements were obtained from the NASA/IPAC Extragalactic Database (NED).
| SN | Host | ||
|---|---|---|---|
| (mag) | ( km s-1) | Morphology | |
| 1992A | 1.47 | ,000 | S0 |
| 2009ig | 0.89 | ,500 | Sa |
| 2011by | 1.14 | ,300 | Sbc |
| 2011fe | 1.10 | ,400 | Scd |
| 2011iv | 1.69 | ,400 | E1 |
| 2012cg | 0.86 | ,000 | Sa |
| 2013dy | 0.92 | ,400 | Sdm |
| 2014J | 0.95 | ,900 | Sm |
| ASASSN-14lp | 0.80 | ,100 | Sc |
| 2015F | 1.26 | ,300 | Sbc |
Note. — measurements have a typical uncertainty of 0.03 mag. measurements have a typical uncertainty of 250 km s-1.
3.2 Spectral Correlations
To directly compare the UV spectral properties of our sample, we generate a smoothed spectrum of each SN using an inverse-variance Gaussian filter (Blondin et al., 2006) and scale the spectra to have roughly the same flux at 4000 Å. The SNe all have relatively similar optical spectra, and therefore the exact choice of scaling (or wavelength region where the scaling occurs) does not significantly affect any results.
We present these UV through optical spectra in Figure 2, including a zoomed-in region near Si ii , 6355. The spectra are relatively similar over the range 4000–6000 Å, but vary significantly for Å. Increased diversity at shorter wavelengths has been shown for other SN Ia samples (Ellis et al., 2008; Foley et al., 2008a, 2012a; Maguire et al., 2012), but no previous study has examined the region below 2500 Å.
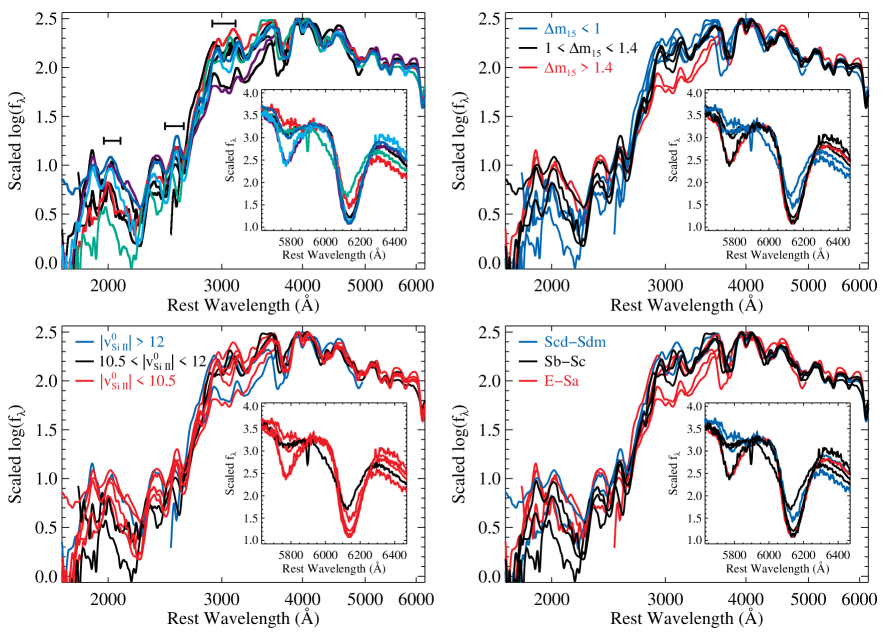
The subpanels of Figure 2 display the spectra coloured by their light-curve shape, ejecta velocity, and host-galaxy morphology. Examining the spectra, there is a trend between light-curve shape and the flux level at 3000 Å (relative to 4000 Å), with faster decliners having lower flux. This is similar to the trend seen between the UV ratio and light-curve shape (Foley et al., 2008b), but with a different normalization wavelength. The flux at other wavelengths is also correlated with light-curve shape, but not as strongly as at 3000 Å.
There are no clear trends between spectral flux levels and ejecta velocity or host-galaxy morphology. However, the velocity of UV features (unsurprisingly) correlates with .
We define three regions of interest, corresponding to wavelength ranges of 1970–2090, 2450–2620, and 2900–3150 Å. These represent the far-UV region that is theoretically affected most by progenitor metallicity (e.g., Lentz et al., 2000), a mid-UV region on top of a high-variation feature, and the near-UV feature that clearly and strongly correlates with light-curve shape. We label the median flux in these regions, relative to 10 times that of the peak flux near 4000 Å, as , , and , respectively. We display these flux values as a function of SN properties in Figure 3.
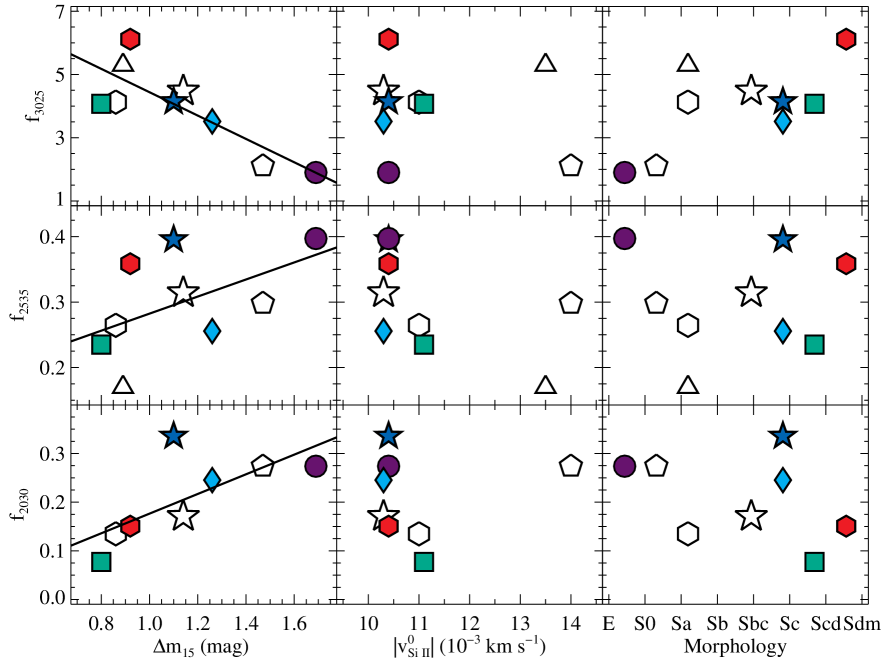
The flux in each of these regions is correlated with light-curve shape, although to varying degrees (Pearson correlation coefficient of , , and , respectively). With the exception of , none is highly correlated with ejecta velocity or host-galaxy morphology. For , it is correlated with host-galaxy morphology (), but this is likely because light-curve shape and host-galaxy morphology are highly correlated (e.g., Hamuy et al., 2000; Howell, 2001).
To determine if there were additional correlations beyond light-curve shape, we first fit linear trends between the various flux measurements and . Examining the residuals, we find that there is a somewhat strong correlation between ejecta velocity and (), but the lack of many high-velocity SNe prevents a robust conclusion about a physical connection.
3.3 Spectral Model
Despite the strong correlations between light-curve shape and flux, there is additional spectral diversity that is not described by this single parameter. This is obvious when comparing SNe 2011by and 2011fe, which have similar light-curve shapes but different UV continua (Foley & Kirshner, 2013; Graham et al., 2015). To assess how much an individual spectrum deviates from a single parameterization, we generated a data-driven model of the UV spectra. Here, we fit the smoothed flux for all spectra in our sample at each wavelength as a function of such that
| (1) |
where represents the spectrum of a nominal mag SN Ia and is the deviation from that spectrum for a hypothetical mag SN Ia. We present these parameters in Table 2.
| Wavelength | ||
|---|---|---|
| (Å) | ||
| 1700 | 0.0080 | 0.098 |
| 1705 | 0.090 | |
| 1710 | 0.0090 | 0.041 |
| 1715 | 0.0170 | 0.029 |
| 1720 | 0.0270 | 0.007 |
| 1725 | 0.0060 | 0.050 |
| 1730 | 0.0000 | 0.056 |
| 1735 | 0.0380 | 0.014 |
| 1740 | 0.0160 | 0.027 |
| 1745 | 0.0430 | 0.017 |
Note. — Table 2 is published in its entirety in the electronic edition of Monthly Notices of the Royal Astronomical Society. A portion is shown here for guidance regarding its form and content.
Figure 4 displays model spectra for several values of . The model spectra appear similar to the data. Additionally, the general trends observed in the data (e.g., the correlation between light-curve shape and the flux at 3000 Å) exist in the model. There are other obvious trends in the model that are harder to directly visualize in the spectra, such as increasing flux at 2000 Å with increasing — however, these trends are present in the data (see Figure 3).
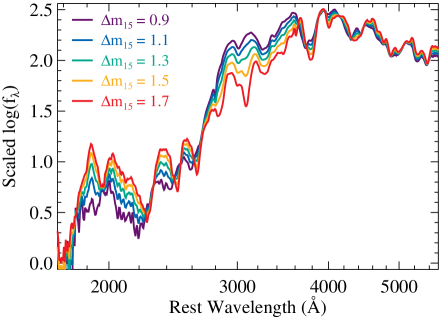
The models have a pivot point at 2700 Å. This implies that all SNe Ia should have the same flux at 2700 Å relative to their optical flux (and in particular the flux at 4000 Å). Blueward of 2700 Å, faster decliners have relatively higher flux, while slower decliners have relatively more flux in the region 2700–4000 Å.
The linear- flux model also provides a reasonable description of the individual spectra in our sample. For example, we show three models with , 1.12, and 1.58 mag, respectively, in Figure 5. We compare these models to SN 2012cg, SN 2013dy, and ASASSN-14lp (, 0.92, and 0.80 mag, respectively); SN 2011by and SN 2011fe ( and 1.10 mag, respectively); and SN 1992A and SN 2011iv ( and 1.69 mag, respectively). In general, the spectra from SNe with similar light-curve shapes have similar spectra, and the model is also similar. In particular, SNe 1992A and 2011iv are remarkably similar even though they have the largest difference of the comparison SNe in any particular group. Alternatively, SNe 2011by and 2011fe are the most different of any two SNe in a group despite having the smallest difference (and being consistent within the uncertainties).
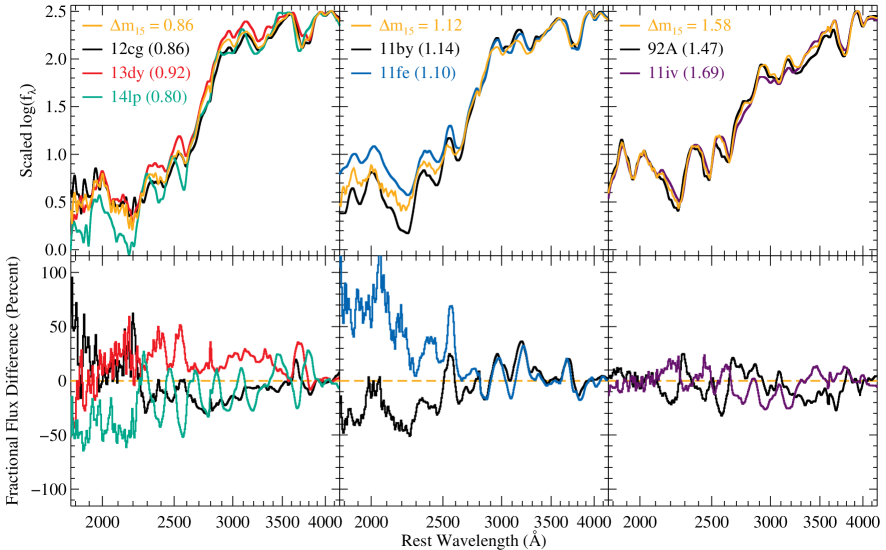
We can therefore use the model spectra to determine how similar a particular spectrum is to a typical SN with its light-curve shape. For instance, we can conclude that SN 2011fe has an excess of UV flux relative to the typical mag SN, similar to what one would expect from direct comparisons to SN 2011by (Foley & Kirshner, 2013; Graham et al., 2015). Perhaps more interesting in that particular case is that SN 2011by has a UV spectrum more similar to the typical SN Ia with its light-curve shape despite its possibly lower-than-typical luminosity (Foley & Kirshner, 2013).
Since the UV excess for SN 2011fe at Å has been interpreted as a difference in progenitor metallicity (Foley & Kirshner, 2013; Mazzali et al., 2014), comparing a given SN Ia near-maximum-light UV spectrum to the model spectrum could be a useful tool for determining the progenitor metallicity for SNe Ia that have no optical “twin” counterpart. While our current model will be biased by the progenitor metallicity distribution of the SN Ia UV sample, we can refit the model excluding any given SN, and then compare the excluded SN to the new model.
Removing a particular SN spectrum from the sample and producing a new model, we can examine the deviation of a particular spectrum from the expected spectrum given its light-curve shape. To find SNe with potentially abnormal progenitor metallicities, one can examine the deviation from the model spectra in the far-UV and the near-UV, where the Lentz et al. (2000) models suggest that spectra of SNe with only progenitor metallicity differences should and should not (respectively) differ from each other. Examining the regions Å and Å, we find two SNe that have a median absolute fractional difference of 35% for the former and 25% for the latter: SN 2011fe and ASASSN-14lp.
SN 2011fe has a spectrum consistent with that of the model in the near-UV (median absolute fractional deviation of 8%), but inconsistent in the far-UV (median absolute fractional deviation of 75%), with the far-UV flux being above the model (see Figure 5). ASASSN-14lp is also consistent with the model in the near-UV (median absolute fractional deviation of 14%), but has relatively low far-UV flux (median absolute fractional deviation of 40%; see Figure 5). Given that the relatively high far-UV flux of SN 2011fe is interpreted as being caused by a subsolar progenitor metallicity (Foley & Kirshner, 2013; Mazzali et al., 2014; Baron et al., 2015), one may extrapolate to say that ASASSN-14lp has a high progenitor metallicity.
However, we caution that the conclusions regarding the progenitor metallicity of ASASSN-14lp rely on the other SNe in the sample with similar light-curve shapes (namely SNe 2012cg and 2013dy). Therefore, a stronger conclusion is that ASASSN-14lp had a higher progenitor metallicity than SNe 2012cg and 2013dy, without making comparisons to SNe having significantly different light-curve shapes.
3.4 UV Diversity
Theory suggests that the diversity in SN Ia UV spectra is indicative of varying progenitor properties and explosion mechanisms. Any complete theory of SN Ia explosions must explain both the general UV spectral properties and the variance. Similarly, knowing the UV variance is critical for determining the cosmological utility of rest-frame UV data for SN cosmology.
To determine the variance as a function of wavelength, we take three similar approaches. First, we simply measure the mean and standard deviation of the sample. Second, we measure the median and median absolute deviation (MAD) of the sample. Finally, we produce a sample of average spectra using a bootstrap sampling (with replacement) method (see Foley et al., 2008a, and references therein). Because the spectra are normalized at 4000 Å, the resultant spectra (and variances) are indicative of relative spectral features, including spectral slopes, but do not indicate differences in the overall luminosity. The resulting spectra are presented in Figure 6.
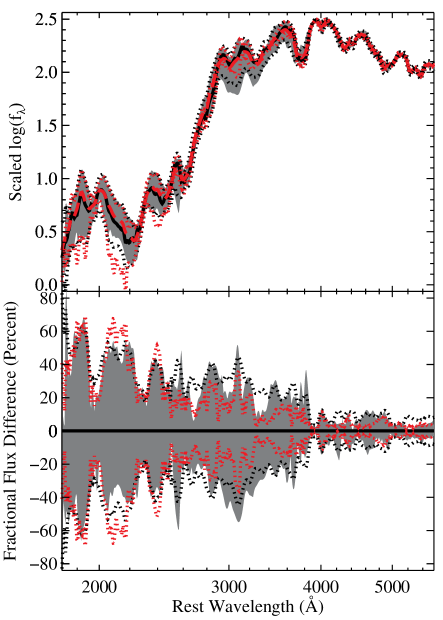
Importantly, the mean and median spectra are similar at all wavelengths, indicating that no single spectrum dramatically alters the results. The spectra are normalized at 4000 Å, and so the variance is naturally small there (3–8% depending on method). This choice does not affect the results; notably, the variance is similarly small at 5000 and 6000 Å (again 3–8%). However, the variance at 3000 Å is significantly higher (16–32%), indicating that the exact wavelength of normalization does not change our results.
In addition to the large increase in variance from the optical to the near-UV, the scatter continues to increase to the far-UV. In particular, the median variance in the range 2500–3000 Å is roughly 24%, while the median variance at 1800–2300 Å is 45%. The increase in variance with decreasing wavelength extends the trend seen in previous studies (Foley et al., 2008a, 2012a; Ellis et al., 2008; Maguire et al., 2012) further into the UV.
4 Discussion and Conclusions
We have compiled and analyzed the first sample of near-maximum-light UV SN Ia spectra. This sample spans most of the parameter space of all SNe Ia, but still lacks examples of the fastest decliners and those with the highest ejecta velocity.
With this sample, we examine trends between UV spectral behaviour and optical light-curve shape, ejecta velocity, and host-galaxy morphology. We find that the UV spectral continuum is driven primarily by light-curve shape, detecting only secondary correlations with ejecta velocity or host-galaxy morphology. We note that the lack of high-velocity SNe Ia in our sample prevents a thorough investigation of its impact on spectra. None the less, the velocities of UV spectral features broadly correlate with those of optical features.
Motivated by our initial investigations, we generated a UV spectral model that depends only on light-curve shape. This model is generally effective at describing the behaviour of the spectra in our sample. There are, however, notable differences. In particular, we find that SN 2011fe has significant excess flux at Å, consistent with previous findings (Foley & Kirshner, 2013). We interpret this difference as being caused by a particularly low-metallicity progenitor star for SN 2011fe.
We also find that ASASSN-14lp has a deficit of flux at Å, indicating that it had a high-metallicity progenitor (at least relative to the other SNe Ia in our sample having similar light-curve shapes). This is a particularly intriguing result since the host galaxy of ASASSN-14lp, NGC 4666, is a superwind galaxy (Dahlem et al., 1997) with a high star-formation rate and likely high metallicity.
The spectral model should allow for future spectral comparisons even when there is no SN having a similar light-curve shape. Since comparing a SN spectrum to the model removes spectral differences related to light-curve shape, any remaining differences are likely related to other parameters such as kinetic energy, asymmetries, and metallicity. As our sample expands the SN parameter space (especially to include higher-velocity SNe) and observes SNe with similar optical properties, we will be able to better determine when a SN Ia has abnormal UV spectra for its light-curve shape.
Using several techniques, we found that the near-maximum-light spectral variance increases with decreasing wavelength from 4000 Å to at least 1800 Å. In particular, we find an increase in the variance from 5% to 25% to 45% at 4000 to 3000 to 2000 Å, respectively. This dramatic rise in diversity at shorter wavelengths indicates that UV observations will be of limited utility for cosmology unless further standardization is identified.
With these results, we are now capable of discerning what “additional” physics contributes to the diversity of SNe Ia beyond the amount of 56Ni generated in the explosion. Future UV spectroscopy of SNe Ia with HST and Swift, while such capabilities exist, will fulfill this long-term goal.
Acknowledgements
Based on observations made with the NASA/ESA Hubble Space Telescope, obtained from the Data Archive at the Space Telescope Science Institute, which is operated by the Association of Universities for Research in Astronomy, Inc., under NASA contract NAS 5–26555. These observations are associated with programs GO–4016, GO–12298, GO–12582, GO–12592, GO–13286, and GO–13646. We thank the STScI staff for accommodating our target-of-opportunity programs. A. Armstrong, R. Bohlin, S. Holland, S. Meyett, D. Sahnow, P. Sonnentrucker, and D. Taylor were critical for the execution of these programs.
Swift spectroscopic observations were performed under program GI–5080130; we are very grateful to N. Gehrels and the Swift team for executing the program quickly.
R.J.F. gratefully acknowledges support from NASA grant 14-WPS14-0048, NSF grant AST-1518052, and the Alfred P. Sloan Foundation. G.P. is supported by the Ministry of Economy, Development, and Tourism’s Millennium Science Initiative through grant IC12009, awarded to The Millennium Institute of Astrophysics, MAS. A.V.F. is grateful for financial assistance from NSF grant AST-1211916, the TABASGO Foundation, and the Christopher R. Redlich Fund. M.S. acknowledges generous support provided by the Danish Agency for Science and Technology and Innovation realized through a Sapere Aude Level 2 grant.
We thank the many amateur and professional astronomers who continue to discover nearby, incredibly scientifically useful SNe and publicly announce their discovery. This research has made use of the NASA/IPAC Extragalactic Database (NED) which is operated by the Jet Propulsion Laboratory, California Institute of Technology, under contract with NASA.
References
- Amanullah et al. (2014) Amanullah R., et al., 2014, ApJ, 788, L21
- Amanullah et al. (2015) Amanullah R., et al., 2015, MNRAS, 453, 3300
- Baron et al. (1996) Baron E., Hauschildt P. H., Nugent P., Branch D., 1996, MNRAS, 283, 297
- Baron et al. (2015) Baron E., et al., 2015, MNRAS, 454, 2549
- Betoule et al. (2014) Betoule M., et al., 2014, A&A, 568, A22
- Blondin et al. (2006) Blondin S., et al., 2006, AJ, 131, 1648
- Branch et al. (2006) Branch D., et al., 2006, PASP, 118, 560
- Brown et al. (2015) Brown P. J., et al., 2015, ApJ, 805, 74
- Cooke et al. (2011) Cooke J., et al., 2011, ApJ, 727, L35+
- Dahlem et al. (1997) Dahlem M., Petr M. G., Lehnert M. D., Heckman T. M., Ehle M., 1997, A&A, 320, 731
- Ellis et al. (2008) Ellis R. S., et al., 2008, ApJ, 674, 51
- Filippenko et al. (1992a) Filippenko A. V., et al., 1992a, AJ, 104, 1543
- Filippenko et al. (1992b) Filippenko A. V., et al., 1992b, ApJ, 384, L15
- Foley (2013) Foley R. J., 2013, MNRAS, 435, 273
- Foley (2014) Foley R. J., 2014, The Astronomer’s Telegram, 6815
- Foley (2015) Foley R. J., 2015, The Astronomer’s Telegram, 7220
- Foley & Kasen (2011) Foley R. J., Kasen D., 2011, ApJ, 729, 55
- Foley & Kirshner (2013) Foley R. J., Kirshner R. P., 2013, ApJ, 769, L1
- Foley et al. (2008a) Foley R. J., et al., 2008a, ApJ, 684, 68
- Foley et al. (2008b) Foley R. J., Filippenko A. V., Jha S. W., 2008b, ApJ, 686, 117
- Foley et al. (2011) Foley R. J., Sanders N. E., Kirshner R. P., 2011, ApJ, 742, 89
- Foley et al. (2012a) Foley R. J., et al., 2012a, AJ, 143, 113
- Foley et al. (2012b) Foley R. J., et al., 2012b, ApJ, 744, 38
- Foley et al. (2012c) Foley R. J., et al., 2012c, ApJ, 753, L5
- Foley et al. (2014) Foley R. J., et al., 2014, MNRAS, 443, 2887
- Fraser et al. (2015) Fraser M., et al., 2015, The Astronomer’s Telegram, 7209
- Goobar et al. (2014) Goobar A., et al., 2014, ApJ, 784, L12
- Graham et al. (2015) Graham M. L., et al., 2015, MNRAS, 446, 2073
- Hamuy et al. (2000) Hamuy M., Trager S. C., Pinto P. A., Phillips M. M., Schommer R. A., Ivanov V., Suntzeff N. B., 2000, AJ, 120, 1479
- Hillebrandt & Niemeyer (2000) Hillebrandt W., Niemeyer J. C., 2000, ARA&A, 38, 191
- Höflich et al. (1998) Höflich P., Wheeler J. C., Thielemann F.-K., 1998, ApJ, 495, 617
- Holoien et al. (2014) Holoien T. W.-S., et al., 2014, The Astronomer’s Telegram, 6795
- Howell (2001) Howell D. A., 2001, ApJ, 554, L193
- Im et al. (2015) Im M., Choi C., Yoon S.-C., Kim J.-W., Ehgamberdiev S. A., Monard L. A. G., Sung H.-I., 2015, ApJS, 221, 22
- Kasen & Woosley (2007) Kasen D., Woosley S. E., 2007, ApJ, 656, 661
- Kelly et al. (2010) Kelly P. L., Hicken M., Burke D. L., Mandel K. S., Kirshner R. P., 2010, ApJ, 715, 743
- Kim et al. (2014) Kim A. G., et al., 2014, ApJ, 784, 51
- Kirshner et al. (1993) Kirshner R. P., et al., 1993, ApJ, 415, 589
- Lampeitl et al. (2010) Lampeitl H., et al., 2010, ApJ, 722, 566
- Leibundgut et al. (1993) Leibundgut B., et al., 1993, AJ, 105, 301
- Lentz et al. (2000) Lentz E. J., Baron E., Branch D., Hauschildt P. H., Nugent P. E., 2000, ApJ, 530, 966
- Lentz et al. (2001) Lentz E. J., Baron E., Branch D., Hauschildt P. H., 2001, ApJ, 557, 266
- Maguire et al. (2012) Maguire K., et al., 2012, MNRAS, 426, 2359
- Mazzali & Podsiadlowski (2006) Mazzali P. A., Podsiadlowski P., 2006, MNRAS, 369, L19
- Mazzali et al. (2001) Mazzali P. A., Nomoto K., Cappellaro E., Nakamura T., Umeda H., Iwamoto K., 2001, ApJ, 547, 988
- Mazzali et al. (2014) Mazzali P. A., et al., 2014, MNRAS, 439, 1959
- Monard et al. (2015) Monard L. A. G., et al., 2015, Central Bureau Electronic Telegrams, 4081
- Nugent et al. (1995) Nugent P., Phillips M., Baron E., Branch D., Hauschildt P., 1995, ApJ, 455, L147
- Nugent et al. (2002) Nugent P., Kim A., Perlmutter S., 2002, PASP, 114, 803
- Pan et al. (2015) Pan Y.-C., et al., 2015, MNRAS, 452, 4307
- Pereira et al. (2013) Pereira R., et al., 2013, A&A, 554, A27
- Perlmutter et al. (1999) Perlmutter S., et al., 1999, ApJ, 517, 565
- Phillips (1993) Phillips M. M., 1993, ApJ, 413, L105
- Phillips et al. (1987) Phillips M. M., et al., 1987, PASP, 99, 592
- Phillips et al. (1992) Phillips M. M., Wells L. A., Suntzeff N. B., Hamuy M., Leibundgut B., Kirshner R. P., Foltz C. B., 1992, AJ, 103, 1632
- Phillips et al. (1999) Phillips M. M., Lira P., Suntzeff N. B., Schommer R. A., Hamuy M., Maza J., 1999, AJ, 118, 1766
- Pinto & Eastman (2000) Pinto P. A., Eastman R. G., 2000, ApJ, 530, 757
- Podsiadlowski et al. (2006) Podsiadlowski P., Mazzali P. A., Lesaffre P., Wolf C., Forster F., 2006, preprint, (arXiv:astro-ph/0608324)
- Rest et al. (2014) Rest A., et al., 2014, ApJ, 795, 44
- Riess et al. (1998) Riess A. G., et al., 1998, AJ, 116, 1009
- Sauer et al. (2008) Sauer D. N., et al., 2008, MNRAS, 391, 1605
- Schlafly & Finkbeiner (2011) Schlafly E. F., Finkbeiner D. P., 2011, ApJ, 737, 103
- Schlegel et al. (1998) Schlegel D. J., Finkbeiner D. P., Davis M., 1998, ApJ, 500, 525
- Shappee et al. (2015) Shappee B. J., et al., 2015, preprint, (arXiv:1507.04257)
- Silverman et al. (2012) Silverman J. M., et al., 2012, ApJ, 756, L7
- Silverman et al. (2013) Silverman J. M., Ganeshalingam M., Filippenko A. V., 2013, MNRAS, p. 529
- Sullivan et al. (2010) Sullivan M., et al., 2010, MNRAS, 406, 782
- Thorstensen et al. (2014) Thorstensen J., et al., 2014, The Astronomer’s Telegram, 6801
- Timmes et al. (2003) Timmes F. X., Brown E. F., Truran J. W., 2003, ApJ, 590, L83
- Wang et al. (2009) Wang X., et al., 2009, ApJ, 699, L139
- Wang et al. (2012) Wang X., et al., 2012, ApJ, 749, 126