The dense gas in the largest molecular complexes of the Antennae: and observations of NGC 4038/39 using ALMA
Abstract
We present observations of the dense molecular gas tracers , , and in the transition using ALMA. We supplement our datasets with previous observations of , which traces the total molecular gas content. We separate the Antennae into 7 bright regions in which we detect emission from all three molecules, including the nuclei of NGC 4038 and NGC 4039, 5 super giant molecular complexes in the overlap region and 2 additional bright clouds. We find that the ratio of , which traces the dense molecular gas fraction, is greater in the two nuclei () than in the overlap region (). We attribute this to an increase in pressure due to the stellar potential within the nuclei, similar to what has been seen previously in the Milky Way and nearby spiral galaxies. Furthermore, the ratio of does not vary by more than a factor of between regions. By comparing our measured ratios to PDR models including mechanical heating, we find that the ratio of is consistent with mechanical heating contributing of the PDR surface heating to the total heating budget. Finally, the ratio of varies from in the nucleus of NGC 4038 down to in the overlap region. The lower ratio in the overlap region may be due to an increase in the cosmic ray rate from the increased supernova rate within this region.
Subject headings:
galaxies: individual (NGC 4038, NGC 4039) - galaxies: interactions - galaxies: ISM - ISM: molecules1. Introduction
Merging and interacting galaxies play a fundamental role in the hierarchical evolution of galaxies (e.g. Steinmetz & Navarro 2002). In a major merger, the turbulent motion generated by the gravitational interaction between the two merging galaxies can lead to a significant increase in the star formation rate, usually in the form of starbursts (e.g. see Hopkins et al. 2006 and references therein). For the most extreme mergers, this enhancement can culminate in an ultra luminous infrared galaxy (URLIG, , Sanders & Mirabel 1996). In fact, it has been shown that most, if not all, ULIRGs are the direct result of an ongoing merger (Sanders et al., 1988; Sanders & Mirabel, 1996; Clements et al., 1996).
In the nearby universe, the closest example of a major merger is the Antennae (NGC 4038/39, Arp 244), with the two progenitor galaxies, NGC 4038 and NGC 4039, still in a relatively early merger stage. Within this system, the region where the two initial gas disks are believed to overlap has been dubbed the “overlap region” (Stanford et al., 1990), while it has also been referred to as the “interaction region” (Schulz et al., 2007). Young, massive (), compact “super star clusters” (SSCs) are found throughout the overlap region (Whitmore et al., 1999, 2010). The overlap region also plays host to 5 super giant molecular complexes (SGMCs, Wilson et al. 2000), massive () associations of molecular gas within which current and future star formation is expected.
The molecular gas in the Antennae has been studied predominantly using the molecular gas tracer , which is excited via collisions with . The total molecular gas content within the Antennae, assuming a Milky Way-like -to- conversion factor, is (Gao et al., 2001). Interferometric observations of show the presence of 100 super giant molecular clouds (SGMCs) throughout the system with a mass range (Wilson et al., 2003). More recently, Schirm et al. (2014) analyzed observations of to using a non-local thermodynamic equilibrium (non-LTE) radiative transfer analysis. They found that most of the molecular gas in the system is cool () and intermediately dense (), while a small fraction () of the molecular gas is in a warm (), dense () phase.
Recently, Herrera et al. (2012) combined high-resolution Atacama Large Millimeter/submillimeter Array (ALMA) science verification observations of in the Antennae with VLT/SINFONI imaging of the transition, while Whitmore et al. (2014) obtained ALMA cycle-0 observations of the overlap region in . By combining their data with observations from the Hubble Space Telescope (HST), and the Very Large Array (VLA), Whitmore et al. (2014) identify regions within the overlap region corresponding to the various stages of star formation, from diffuse giant molecular clouds (GMCs) all the way to intermediate and old stellar clusters. Of particular interest is the very bright emission found within SGMC 2, which Whitmore et al. (2014) dubbed the “firecracker” and which is believed to be the precursor to a SSC. In addition, strong emission is associated with the bright emission (Herrera et al., 2012). The mass and energetics of the cloud suggest a very high pressure (), while a lack of thermal radio emission indicates no star formation has yet occurred (Johnson et al., 2015).
While is the most commonly used tracer of molecular gas, due to its brightness and relatively high abundance in giant molecular clouds (GMCs), it may not be the ideal tracer for the star forming molecular gas. Dense gas tracers, such as (Gao & Solomon, 2004a, b; Papadopoulos, 2007), (Talbi, Ellinger & Herbst, 1996), and (Graciá-Carpio et al., 2006), can be used to study the molecular gas most directly linked to star formation. This relation culminates in the form of a tight relationship between the luminosity of () and the infrared (IR) luminosity (), tighter than the correlation between and the infrared luminosity (Liu & Gao, 2010). In fact, this relationship holds in the form of a constant ratio of from individual giant molecular clouds (GMCs) all the way up to luminous infrared galaxies (LIRGs) (Wu et al., 2005b). Recently, Bigiel et al. (2015) used CARMA data to compare HCN and other dense tracers to the far-infrared luminosity to trace star formation efficiency and dense gas fraction. The critical densities of , , and are all for the transition (Loenen, Baan & Spaans, 2007), significantly higher than (, Loenen, Baan & Spaans 2007).
Because , , and in the transition all have similar critical densities, the relative strengths of the lines of these molecules are driven largely by ongoing physical processes. Infrared (IR) pumping can enhance emission in a system with a strong background mid-IR field (Sakamoto et al., 2010), while can be destroyed via dissociative recombination in the presence of a significant abundance of electrons. and are isotopomers, and their relative abundance is driven by the temperature of the dense molecular gas (Talbi, Ellinger & Herbst, 1996). Line ratios of these molecules can be used as a diagnostic for cosmic rays (Meijerink et al., 2011), photon dominated regions (PDRs, Kazandjian et al. 2012), and mechanical heating (Loenen et al., 2008; Kazandjian et al., 2012). Thus, these lines can be used to study the distribution of dense molecular gas within a system and to constrain the relative fraction of dense gas from region to region as well as the relative importance of physical processes such as mechanical heating.
In this paper, we present observations of the transition of , , and in the Antennae using ALMA. We adopt a distance to NGC 4038/39 of (Schweizer et al., 2008), corresponding to an angular scale of . We combine these observations with previous observations of from Wilson et al. (2000, 2003). In this work, we detail the observations and data reduction in Section 2, while we discuss separating the emission into the brightest regions in Section 3. We present various line ratios of , , , and in Section 4, and we discuss the implications of the measured line ratios in Section 5.
2. Observations
NGC 4038 was observed in two pointings over the course of 2 nights each in March, 2013 and April, 2014 as part of ALMA Cycle-1. One pointing was positioned to cover the nucleus of NGC 4038 and the western loop (), while the other was positioned to cover both the overlap region and the nucleus of NGC 4039 (), with a total on-source integration time of . The antenna array configuration was C32-4. The bandpass calibrators used were J1256-0547, J1246-2547, and J1130-1449, while J1215-1731 was used as the phase calibrator and Titan was used as the amplitude calibrator throughout.
Band 3 was used, with one spectral window set to observe both and simultaneously. A second spectral window was aligned to search for emission throughout the Antennae. The total usable bandwidth for each of these spectral windows was with a channel spacing of . The two remaining spectral windows were centred at and to observe the continuum emission across the Antennae. The bandwidth of the two continuum windows was with a channel spacing of .
We reduce these data using the Common Astronomy Software Applications package version 4.2. We start by running the script provided to the PI as part of the data delivery in order to calibrate the uv-datasets before splitting out the target from the calibrated dataset. We further split out the spectral window which contains the and lines, and the spectral window which contains the line. We subtract the background continuum emission by fitting a first order polynomial to the line-free channels of each spectral window using the uvcontsub task.
We create dirty data-cubes for each of the , , and transitions with a channel width of and cell size of . The restoring beams of the cleaned data cubes when using Briggs weighting with robust are for the line and for the line (the line was too weak to detect detect at the native ALMA resolution). We set the restoring beam for the and transitions to the beam and create clean data-cubes by placing clean boxes around emission in the dirty data-cubes, being careful not to select artifacts. We clean down to a threshold of , corresponding to in both dirty data cubes as measured in the line-free channels ().
In addition, we create dirty and clean data cubes to match the beam of the data cube from Wilson et al. (2000, 2003). We set the uv-taper on the outer baselines to for , , and with a restoring beam of . We use the same channel width and cell size as before, and draw clean boxes around emission. We clean down to a threshold of , corresponding to of the tapered dirty data cubes ().
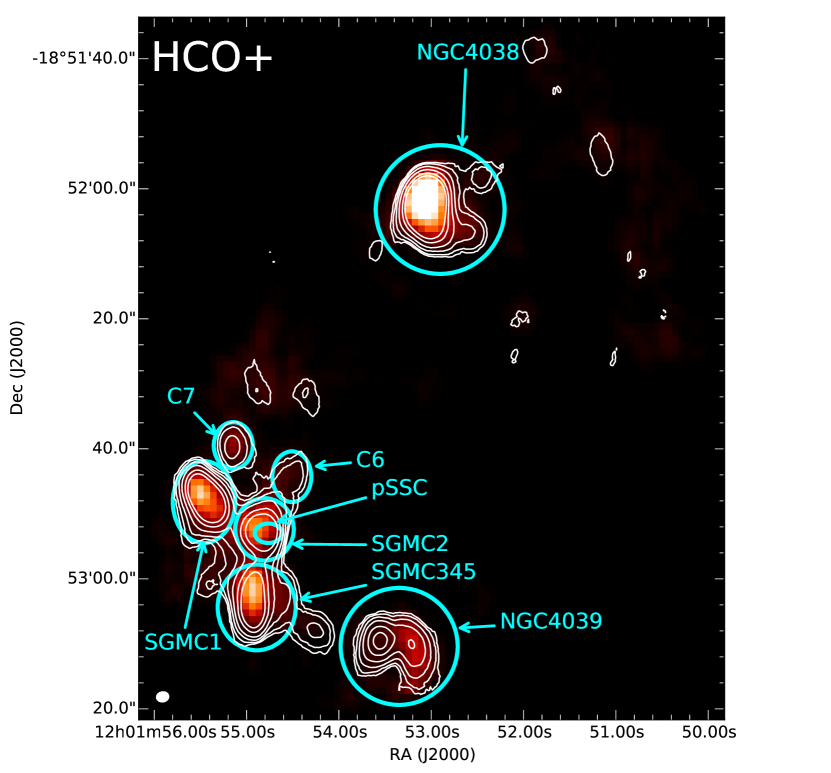
We create moment maps including emission above . The un-tapered moment 0 maps are shown in Figure 1, while the tapered moment 0 maps are shown in Figure 2, along with the moment 0 map from Wilson et al. (2000, 2003). Finally, we correct all of our , , and moment-0 maps for the primary beam. The largest correction occurs in the nucleus of NGC 4039, where the primary beam correction is on the order of for both the native ALMA resolution maps and the \ceCO resolution maps. The \ceCO map from Wilson et al. (2003) has already been corrected for the primary beam.
Gao et al. (2001) observed the Antennae in in two pointings: one centered on the nucleus of NGC 4038, and the other on the brightest emission from the overlap region. The full-width half-maximum of their beam was and their two pointings include both nuclei and the overlap region. They calculate a total luminosity of (adjusted to our adopted distance of ), while we measure a total of luminosity of in our ALMA maps. Our detected emission is well within their two beams, and we do not expect significant emission outside of our observed region. This comparison suggests that we recover of the total emission in our ALMA observations.
We estimate the measurement uncertainties in our moment maps by first determining the number of channels included in each pixel of the moment map (). We calculate the uncertainty in each pixel as , where is the root-mean squared uncertainty measured from our line-free channels of our data cubes, and is the channel width. Furthermore, when comparing our dense gas tracers to our map, we add a calibration uncertainty111ALMA Cycle 1 Technical Handbook. Available at https://almascience.nrao.edu/documents-and-tools/cycle-1/alma-technical-handbook. The calibration uncertainty of the map is (Wilson et al., 2003). While individual luminosities can vary depending on the size of the aperture chosen, line ratio measured in the same apertures from maps with the same beam size should be quite accurate measures of the average line ratio over a given region. Line ratios involving the line may be somewhat more uncertain as this is the weakest line and so the 2 clipping used to make the moment maps is a larger fraction of the peak flux.
3. The brightest regions in the Antennae
In this paper, we will focus on the , , and emission from the brightest regions in the Antennae. A full catalogue of clouds in both , , and will be published in a future paper, along with a cloud-by-cloud analysis of the emission.
Wilson et al. (2000) identified and isolated the 7 brightest regions in their map of the Antennae using the clump identification algorithm CLFIND (Williams, de Geus & Blitz, 1994). These regions include both nuclei (NGC 4038 and NGC 4039), and 5 large clouds in the overlap region, dubbed Super Giant Molecular Complexes (SGMCs). In addition to these 7 regions, we identify two additional bright regions, C6 and C7. These clouds correspond to clouds 16, 17 and 18 (C6), and clouds 67 and 74 (C7) in the cloud catalogue published in Wilson et al. (2003).
We place elliptical apertures around each of the 9 brightest regions to measure the total , , , and fluxes (, Table 1) in the moment-0 map for the transition for each molecule (Figure 3). The total fluxes and total luminosities of the nuclei, SGMCs and clouds C6 and C7 are measured at the resolution for all 4 molecules.
For the 5 SGMC regions, we are unable to distinguish between SGMC 3, 4 and 5 in the moment-0 map and so we combine these three SGMCs into SGMC 3+4+5. We can, however, distinguish between them in velocity-space, as shown in Wilson et al. (2000) (see their Figure 5). Using the measured local standard of rest velocity () along with the velocity widths () from Wilson et al. (2000), we create moment-0 maps for the velocity range spanned by each SGMC. We measure the flux and luminosity for each cloud in their own moment-0 map using the same aperture as used for SGMC 3+4+5. There are 2 channels of overlap in the velocity ranges for SGMC 4 and 5 as measured by Wilson et al. (2000); we separate the two SGMCs by including one channel in each of the moment maps of SGMC 4 and 5.
Johnson et al. (2015) identified a small region in SGMC 2 in their ALMA map of the overlap region which they believe to be the precursor to a super star cluster, which we have dubbed “pre-SSC” in this work. The resolution of their map is considerably better than that of our observations (beam size ), while the size of pre-SSC as measured using the CPROPS program (Rosolowsky & Leroy, 2006) is , less than the size of the beam of our and observations. We created a moment-0 map using the velocity range measured for the pre-SSC by Johnson et al. (2015) and our data cubes at the native ALMA resolution. However, even in this map, the pre-SSC is not visible as a separate source. The and peak fluxes measured at the location of the pre-SSC are 0.28 and 0.45 Jy beam-1 km s-1, respectively; however, these fluxes almost certainly contain significant contamination from SGMC 2 and so should be regarded as upper limits to the true flux of the pre-SSC.
| aaThe calibration uncertainty for ALMA band 3 in Cycle 1 is (see text) | aaThe calibration uncertainty for ALMA band 3 in Cycle 1 is (see text) | aaThe calibration uncertainty for ALMA band 3 in Cycle 1 is (see text) | bbThe calibration uncertainty for the \ceCO observations is (see text and Wilson et al. 2003) | ||
|---|---|---|---|---|---|
| Region ID | |||||
| NGC 4038 | |||||
| NGC 4039 | |||||
| SGMC 1 | |||||
| SGMC 2 | |||||
| SGMC 3 | |||||
| SGMC 4 | |||||
| SGMC 5 | |||||
| SGMC 3+4+5 | |||||
| C6 | |||||
| C7 |
Note. — The reported uncertainties are the measurement uncertainties.
To convert into luminosity with units of , multiply fluxes by
. See text for additional details.
4. Line Ratios
We calculate the / and / line ratio maps for both the native resolution and beam matched moment-0 maps by dividing the moment-0 maps directly (Figure 4). The difference between the primary beam correction for the and moment-0 maps is minimal, and so we use the non-primary beam corrected maps for this line ratio. For the line ratio of /, we use the primary beam-corrected maps. In addition, we include only pixels with a detection of both molecular transitions in the moment-0 maps.
4.1. Ratios of the dense gas tracers
We calculate the ratios of the luminosities of the dense gas tracers , , and for the brightest regions in the Antennae (see Section 3). We use the fluxes we measure in Table 1 at the OVRO beam size, and convert them to luminosities using the following formula (Wilson et al., 2008)
| (1) |
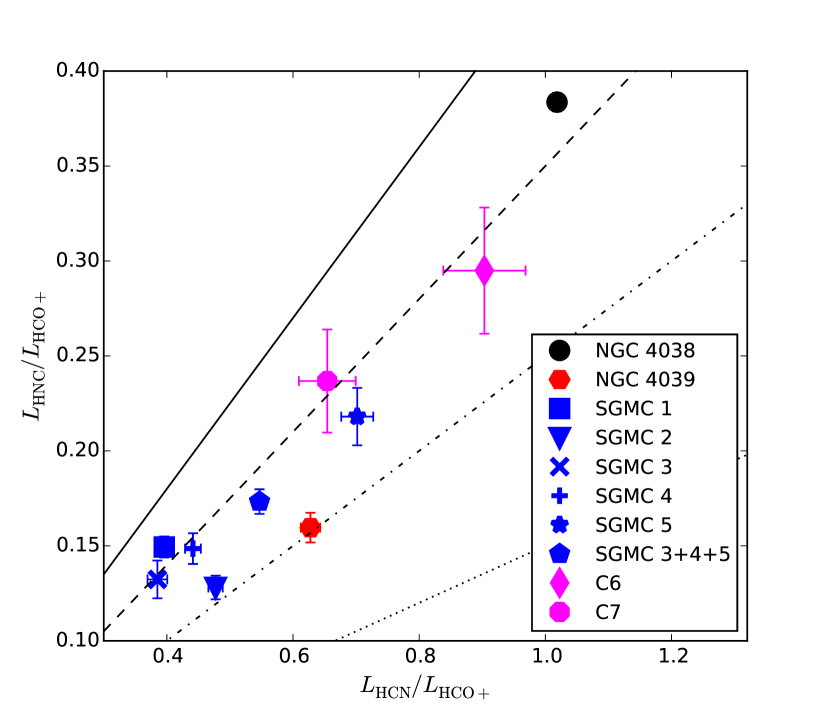
where is the flux, is the distance, is the rest frequency of the transition, and is the redshift. We show these ratios of , , and in Table 2 and we plot the ratios of and in Figure 5.
With the exception of C6, the nucleus of NGC 4038 shows values of and more than times greater than the other regions. For C6, the ratios of and are only and times less than in NGC 4038. Of the remaining regions, SGMCs 1, 2, 3 and 4 exhibit similar values for both the ratio of () and the ratio of (), suggesting similar dense gas properties across the 4 regions. The nucleus of NGC 4039 exhibits slightly larger values for both (, ). Of the SGMCs, SGMC 5 exhibits the largest value for both line ratios (, ); this enhanced line ratio can also be seen in the high-velocity end of the spectrum for this region in Bigiel et al. (2015).
The value of varies by less than a factor of 1.5 across all 9 regions. The largest deviations occur for the nucleus of NGC 4039 and SGMC 2, with and respectively. Of the remaining 8 regions, is nearly constant, varying by only ().
4.2. Ratios to
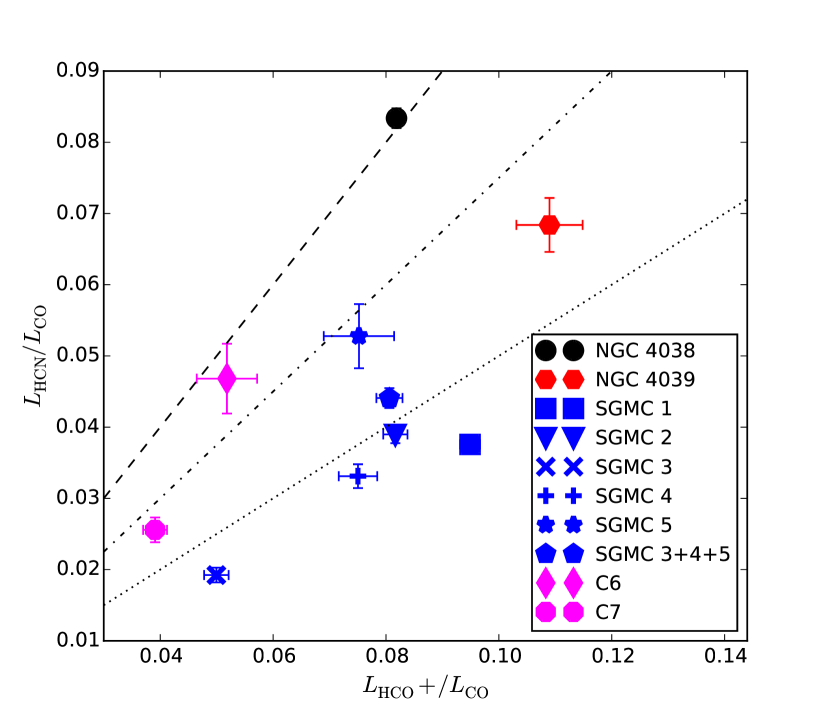
The ratio of the detected dense gas tracers to the total luminosity is an indicator of the fraction of the dense molecular gas within the different regions in the Antennae. We calculate this ratio for all three dense gas tracers relative to (Table 2), and plot the ratio of and in Figure 6.
The ratio of varies by more than a factor of , with the two nuclei exhibiting larger values than the other regions in the Antennae. The smallest values are seen in SGMC 3 and C7, while the remaining 6 regions have values . The ratio of , on the other hand, varies by a factor of . Once again, SGMC 3 and C7, along with C6, show the smallest values of (), while the nucleus of NGC 4039 has the highest ratio of (). The remaining regions, including the nucleus of NGC 4038, all have a characteristic value of of .
| Region ID | / | / | / | / | / | / |
|---|---|---|---|---|---|---|
| NGC 4038 | ||||||
| NGC 4039 | ||||||
| SGMC 1 | ||||||
| SGMC 2 | ||||||
| SGMC 3 | ||||||
| SGMC 4 | ||||||
| SGMC 5 | ||||||
| SGMC 3+4+5 | ||||||
| C6 | ||||||
| C7 |
Note. — The reported uncertainties are measurement uncertainties only, which are equal to the total uncertainty for the ratios which include only , and . The uncertainties in line ratios which include are dominated by the calibration uncertainties. We add the calibration uncertainties from the two instruments in quadrature to obtain a total line ratio uncertainty of . See text for additional details.
5. Discussion
5.1. On the global line ratio of
Gao et al. (2001) measured the emission at two locations in the Antennae with a beam FWHM : the nucleus of NGC 4038 and the overlap region, including a large portion of NGC 4039. They calculated a global value of . This is comparable to the value we calculate for SGMC 3 (), the smallest value of our 9 regions. ratios in five of our regions are a factor of 2 or more larger than the global value calculated by Gao et al. (2001), while the value calculated for the nucleus of NGC 4038 is a factor of 4 larger.
There are two major contributions which could lead to such a large difference in our ratios compared to the global ratio from Gao et al. (2001): missing flux in the interferometric observations and emitting gas beyond the boundaries of our defined regions. Wilson et al. (2003) compared their interferometric map of to the same region in the Gao et al. (2001) single dish map and found that only of the flux is recovered in the interferometric map. In comparison, we determined that most of the emission is recovered in our map (see Section 2).
The total luminosity in our interferometric map from the 7 brightest regions (with SGMC 3, 4 and 5 combined as SGMC 3+4+5) is , while the total luminosity over the same area from the single dish map used in Gao et al. (2001), scaled to our adopted distance of , is (Wilson et al., 2003). Similarly, the total luminosity from our regions is , while from Gao et al. (2001), . Based on this, of the total emission originates from the brightest regions of the Antennae, while only of the total emission originates from these same regions.
If we assume that the of the emission found outside of these regions is associated with emission, we can assume a ratio of and calculate that these regions account for another of the total emission. This leaves of the emission unaccounted for and presumably not within relatively dense GMCs or producing significant HCN emission. If we instead adopted the global value for of 0.02 from Gao et al. (2001), then all of the emission would originate in GMCs producing significant emission. Thus, the amount of emission in the Antennae associated with diffuse molecular gas is %.
Using the map of M51 from the Plateau de Bure interferometer (PdBI) Arcsecond Whirlpool Survey (PAWS), Pety et al. (2013) identified an extended, diffuse component of the molecular gas which account for of the flux, and in which emission is subthermally excited. It is possible that a significant fraction of the of the emission that is unaccounted for in NGC 4038/39 is subthermally excited from a diffuse, extended component such as in M51. The critical density of the transition () is significantly less than that of () and so we would not expect any emission from an extended, diffuse component. This would lead to a suppression of the global ratio when compared to smaller regions. High-resolution, flux-recovered observations of in the Antennae using ALMA would allow us to detect the presence of this extended diffuse component.
5.2. Dense gas fraction
We use the ratio of as an indicator of the dense gas fraction throughout the Antennae, and show this ratio compared to in Figure 7 for the 9 brightest regions in the Antennae. Typical values for normal spiral galaxies are (Gao & Solomon, 2004a, b), while this fraction can increase to in the case of some extreme star forming LIRGs and ULIRGs.
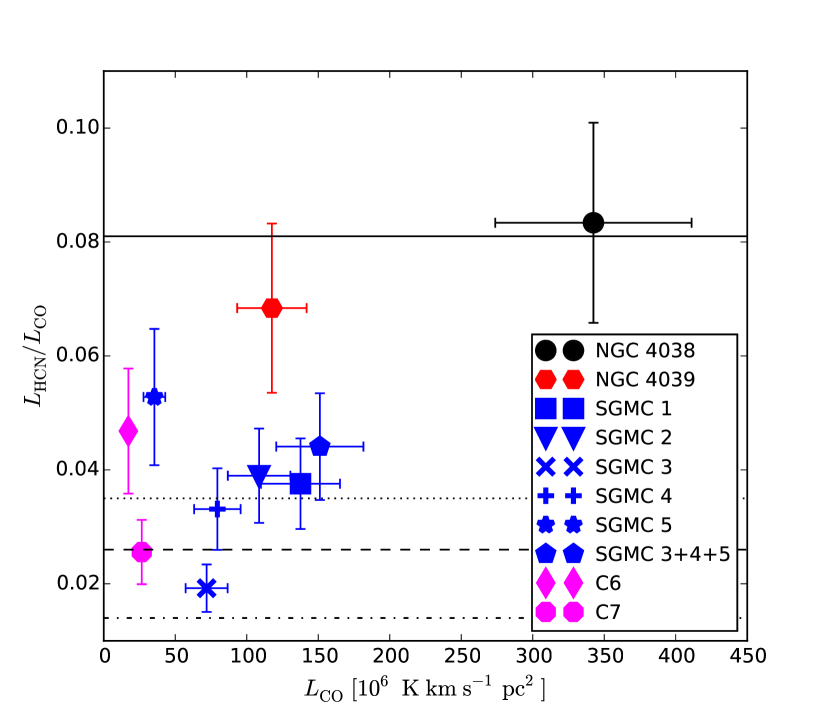
The two nuclei, NGC 4038 and NGC 4039, show a higher dense gas fraction than the rest of the system, by roughly a factor of . In comparison, Helfer & Blitz (1997a) measured , comparable to , in the plane of the Milky Way and found that the dense gas fraction was greater towards the bulge () than the rest of the plane (). Helfer & Blitz (1997b) saw a similar increase in NGC 6946, a grand-design spiral galaxy, and NGC 1068, a Seyfert-2 galaxy with a starburst, with the ratio of increasing by a factor of towards the bulge. In larger surveys extending to higher infrared luminosities, Baan et al. (2008) report ratios of 0.01 to 0.18 with a median spatial resolution of 5 kpc in their sample of 75 galaxies. García-Burillo et al. (2012) find ratios from 0.02 to 1 in a sample of 130 galaxies, with higher ratios more common in galaxies with infrared luminosities above L⊙. Juneau et al. (2009) find ratios of 0.02 to 0.06 in galaxies with infrared luminosities in the range L⊙. Recently, Usero et al. (2015) surveyed 62 positions in the disks of normal spiral galaxies. They found ratios of 0.011 to 0.065 on average scales of 1.5 kpc and found that this line ratio correlates with both the atomic-to-molecular gas fraction and the stellar surface density.
Helfer & Blitz (1997a) argue that the increased dense gas fraction in the bulge is due to an increase in the average gas pressure towards the center of the Milky Way, with . With this relation, a factor of 2 difference in the ratio of would correspond to a factor of difference in the average gas pressure. This increase in gas pressure is due in part to the increased stellar density in the bulge, which increases the gravitational potential, and in turn increases the gas pressure required to support hydrostatic equilibrium. As in the Milky Way, the high ratio of seen in the two nuclei of the Antennae could be due to an increase in the stellar density compared to the overlap region.
Schirm et al. (2014) calculated the pressure using a non-LTE excitation analysis of and in each of NGC 4038, NGC 4039 and the overlap region in relatively large beams (FWHM , ). Their cold component results suggest that the pressure in all three regions is similar (); however the ranges span an order of magnitude. (It is important to note that, due to the large beams, NGC 4039 contains some emission from the overlap region, and this may be reflected in the non-LTE excitation analysis.) Their warm component, traced largely by the and transitions, shows a much higher pressure in NGC 4038 () than in either NGC 4039 or the overlap region ().
It is possible that some, or even most, of the emission is associated with their warm component; however the transition is often associated with cold, dense gas. Observations of higher and transitions coupled with a non-LTE excitation analysis similar to the method used by Schirm et al. (2014) would help determine whether this emission is associated with cold or warm dense molecular gas, while also enabling direct calculations of the pressure in the dense gas in these regions.
We show the ratio of in Figure 4, right. In both NGC 4038 and NGC 4039, there is a region towards the very center where the ratio of increases by a factor of compared to the surrounding regions. These high ratio regions are approximately the size of the beam, which corresponds to , similar to the size of the bulges measured by Helfer & Blitz (1997b). Interestingly, the peak value of is greater in NGC 4039 than in NGC 4038, while averaged over the whole region the dense gas fraction is greater in NGC 4038.
In the overlap region, most of the molecular gas is characteristic of SGMC 1, where . There are two interesting peaks in the distribution of the dense gas ratio in the overlap region, one in the south-west of SGMC 2, and another to the south of SGMC 3+4+5. The center of the peak in SGMC 2 is offset from the center of pre-SSC by , which corresponds to roughly a beam. Both peaks exhibit a higher ratio of and, to a lesser extent, (Figure 8). No significant emission is detected at a level at either peak in either or at the native ALMA resolution. However, both peaks are detected in the beam-matched maps of both dense gas tracers at a level. Moreover, there is no obvious emission detected at this location either (Whitmore et al., 2014). It is possible that these high regions are produced by edge effects; inspection of the individual emission maps shows that the peaks of the HCN and the CO emission are not precisely coincident in these areas.
5.3. Comparison to other wavelengths
Whitmore et al. (2010) observed the Antennae with the Hubble Space Telescope using multiple filters, including F435W, F814W, and F658N, which correspond to B-band, I-band and \ceHα emission. We compare the emission to each of these filters in the middle row of Figure 8. At the two peaks in the ratio discussed in the previous section, there are only faint or no B-band or I-band optical counterparts. However, there is some nearby \ceHα emission, at the southern edge of the SGMC 3+4+5 peak, and near the eastern edge of the SGMC 2 peak. Furthermore, there is no (Klaas et al., 2010), (Zhang, Gao & Kong, 2010) or (Wang et al., 2004) emission associated with the line ratio peak near SGMC-2, although there is bright emission in these bands towards SGMC 3+4+5 that could have some relation to the southern peak in the line ratio (Figure 8).
The lack of emission in the B- and I-band images is likely due to high dust extinction in the overlap region. The (Calzetti et al., 2010), and (Wu et al., 2005a) fluxes all correlate strongly with star formation, and so we attribute the deficiency in their emission to a lack of recent star formation within one or possibly both of the line ratio peaks in the overlap region. As such, these high-dense gas fraction regions may be the result of turbulent motion due to the ongoing merger, and may indicate sites of future star formation within the overlap region.
5.4. Mechanical heating and photon dominated regions
and are isotopomers with similar excitation energies. The line ratio of is driven in large part by their relative abundance, in which the exchange reaction \ceH + HNC ¡-¿ H + HCN is an important factor (Schilke et al., 1992; Talbi, Ellinger & Herbst, 1996). At temperatures , the rate coefficients of both the forward and reverse reactions are small, and this reaction is not important (Talbi, Ellinger & Herbst, 1996). At temperatures of a few hundred , the energies are sufficient to exceed the activation energy of the \ceH + HNC reaction, leading to a higher relative abundance of to and a lower ratio of .
It has been suggested that most molecular gas is in the form of PDRs (e.g. see the PDR model comparison study by Röllig et al. 2007). If mechanical heating is not included in the model, heating occurs only at the surface of the PDR, where the photon energies are high enough to liberate elections from the surfaces of dust grains. Recent PDR models have investigated the effects of mechanical heating on the molecular gas within PDRs (Meijerink et al., 2011; Kazandjian et al., 2012, 2015), in particular on the predicted atomic and molecular line ratios. They find that mechanical heating begins to have a measurable effect on the chemistry of the PDR, and consequently the line ratios, with contributions of as little as to the total heating (Kazandjian et al., 2012).
In the Antennae, the ratio of varies by less than a factor of across the brightest regions, ranging from (Table 2 and Figure 5). We compare our measured ratio to the PDR models with mechanical heating from Kazandjian et al. (2015). In their models, the mechanical heating is parameterized as , which is equal to the total amount of mechanical heating relative to the PDR surface heating. For values of , their reference models report a value of . Our measured line ratios are consistent with at least some () contribution of mechanical heating towards the total heating budget in all the bright regions in the Antennae.
In comparison, Schirm et al. (2014) modelled various line ratios of from to along with the FIR luminosity using PDR models which did not include mechanical heating. In all three region, they found that line ratios of the low-J transitions ( to ) are consistent with a “cold” PDR with a field strength of and a molecular gas density of . Line ratios of the high-J transitions ( to ) are consistent with a “warm” PDR with a field strength of and a molecular gas density of , while the warm PDR accounts for of the total molecular gas mass. Their warm PDR solutions are similar to model M3 from Kazandjian et al. (2015), for which for all amounts of mechanical heating, while the field strength of their cold PDR models lies outside of the range of modelled by Kazandjian et al. (2015). Future PDR modelling within the Antennae should include mechanical heating as it has to have a fundamental effect on the chemistry within these regions.
The higher ratio of seen in the nucleus of NGC 4038 and SGMC 1 indicates that the relative contribution of mechanical heating is lower within these regions. Conversely, the lower ratio seen in the nucleus of NGC 4039 and SGMC 2 indicates a higher relative contribution of mechanical heating. An increase (decrease) in the relative contribution of mechanical heating could either be due to an increase (decrease) in the total mechanical heating, or due to a decrease (increase) in the total PDR surface heating. All four regions show similar star formation efficiencies (SFEs), ranging from for NGC 4038, to for SGMC 2 (Klaas et al., 2010). As PDR surface heating is tied to the background FUV field strength, which is emitted from young, massive stars, the similar SFEs within these four regions likely indicate variations in the amount of mechanical heating as opposed to the PDR surface heating. This, in turn, agrees with the results from Schirm et al. (2014) who found similar values for and in NGC 4038, NGC 4039 and the overlap region.
Finally, our ratios of are consistent with models from Kazandjian et al. (2015) with (while also consistent with ). The molecular gas temperature of the models with is high (), which would indicate that the and emission originates from warm, dense molecular gas similar to the warm component found by Schirm et al. (2014). However, the transition of both these molecules is typically assumed to be associated with cold, dense, star forming molecular gas. It could be that this cold, dense gas is quickly heated by the ongoing star formation within these systems, via supernovae and stellar winds, or that the turbulent motion due to the ongoing merger heats this dense gas. A multi-transitional non-LTE excitation analysis can be used to assess whether the and emission is from cold or warm dense gas.
5.5. Cosmic rays and the abundances of and
Differences in the ratio of and of over a factor of are seen in both the total global line ratio in the form of (Table 2) and in the distribution of (Figure 4). In particular, the nucleus of NGC 4038 exhibits a ratio , while in the SGMCs, the ratio is typically . These differences in the line ratio suggest either different excitation conditions for the two molecules (e.g. see Juneau et al. 2009) or changes in the relative abundances. To look for varying excitation conditions, additional transitions are required of both molecules. Thus, we discuss the implications of varying abundances of and in the context of the measured line ratios.
is an ion and is easily destroyed through recombination in the presence of free electrons. Free electrons can also combine with \ceHCNH+ to form (Lintott & Viti, 2006; Juneau et al., 2009), simultaneously enhancing the abundance of while suppressing the abundance of . These free electrons are generated in the formation of the ion, which occurs via (McCall et al., 2003). Papadopoulos (2007) argue that deep within molecular clouds, where the dense gas is found, this reaction with cosmic rays is the primary source of free electrons; however is also important in the formation of . Thus, interpreting variations in the line ratio of and is not as straightforward as, say, and .
Meijerink et al. (2011) investigated the effects of cosmic rays on the abundances of various molecules, atoms and ions within PDRs. They modelled a dense () PDR region with a strong background UV field (), along with an intermediate density () PDR with a PDR field strength of . They varied the cosmic ray rate from to . In the dense PDR, they found that the abundances of both and are insensitive to changes in the cosmic ray rates. The abundance of , however, increases with increasing cosmic ray rates, except at very high cosmic ray rates. In the intermediate density PDR case, the , and abundances all decrease with increasing cosmic ray rate.
Cosmic rays are assumed to originate largely from supernova remnants (Schulz et al., 2007). Neff & Ulvestad (2000) measured the supernova rate () across the Antennae using nonthermal radio sources which trace compact supvernova, and found a global rate of . Schirm et al. (2014) compared the location of these supernova to their beams for each of NGC 4038, NGC 4039 and the overlap region and determined that of the supernova originate from the overlap region, from the nucleus of NGC 4038 and from the nucleus of NGC 4039. In our new ALMA maps, the emission in the overlap region covers roughly twice the area of emission in either of the two nuclei. Neff & Ulvestad (2000) identified 115 sources in their 6-cm map, of which they estimate 60% to be non-thermal sources; there are 18 source bright enough for their spectral index to be measured with sufficient accuracy to show they are non-thermal. Comparing to their catalogs, the overlap region contains 36 sources, of which 6 are confirmed to be non-thermal, NGC 4038 has 9 (4) sources, and NGC 4039 has 5 (1) sources. These source counts suggest that the surface density of supernova in the overlap region is 0.7-2 times that of NGC 4038, while the surface density in NGC 4039 is 0.3-0.6 times that of NGC 4038, with the lower values corresponding to sources with confirmed non-thermal spectral indices.
Unfortunately, there is no clear trend between the ratio and the supernova surface density among these three sources. If the overlap region has a higher supernova surface density than NGC 4038, this could produce an increase in the local cosmic ray rate. This could in turn explain the decreased ratio of found in the overlap region. However, NGC 4039 has a lower supernova surface density than either of the other two regions and yet exhibits an ratio that is more similar to that of the overlap region. An active galactic nucleus (AGN) can also be the source of cosmic rays (Pierre Auger Collaboration et al., 2007); however multi-wavelength studies of the Antennae suggest that there is no AGN at the center of NGC 4039 (Neff & Ulvestad, 2000; Brandl et al., 2009; Ueda et al., 2012). Ueda et al. (2012) suggest that the high line ratio of / seen in NGC 4039 is not due to star formation activity, but could possibly be due to a hidden AGN. If that is the case, the lower value of seen in NGC 4039 could perhaps be explained by the presence of such a hidden AGN.
6. Summary and conclusions
In this paper, we present high-resolution observations of the dense gas tracers , , and transitions in the Antennae using ALMA. These observations are beam matched and compared to previously obtained lower resolution observations by Wilson et al. (2000, 2003). We isolate the emission from the nucleus of NGC 4038 and NGC 4039, and from the 5 SGMCs in the overlap region. We also identify two other bright regions, clouds C6 and C7, located to the north of the overlap region.
-
1.
We compare our interferometric observations of and to single-dish observations of the same transitions by Gao et al. (2001). We find that of the total flux from the Gao et al. (2001) observations is located within the nuclei, SGMCs and clouds C6 and C7, while of the emission is from these same regions. Furthermore, assuming a line ratio of , we find that there may be up to of the emission not associated with any emission. We suggest that this is subthermally excited and the emission originates from relatively diffuse molecular gas, similar to that seen in M51.
-
2.
The dense gas fraction as measured by is higher in the two nuclei ( and respectively) than in any other region of the Antennae (). Furthermore, the line ratio peaks in the centre of the two nuclei. This increase is consistent with what is seen within the bulges of nearby spiral galaxies, where the stellar potential is larger. We attribute this increase in the dense gas fraction to an increase in the pressure within the two nuclei due to the higher stellar potential in the bulge region.
-
3.
The ratio of is a tracer of mechanical heating within PDRs. We find that this ratio varies by less than a factor of 1.5 across our defined regions in the Antennae, ranging from . By comparing these values to PDR models which include mechanical heating, we find that mechanical heating must be at least of the PDR surface heating in the Antennae. In these PDR models, a minimum contribution of of mechanical heating relative to PDR surface heating indicates temperatures , which is consistent with the values we measure. This may indicate that both and are tracers of warm, dense molecular gas in the Antennae as opposed to cold, dense molecular gas. A multi-transitional non-LTE excitation analysis would be useful to determine the temperature of this gas.
-
4.
The ratio peaks in the nucleus of NGC 4038 (), while it is approximately a factor of 2 smaller in the overlap region. This difference may be due to a increase in the abundance of in the overlap region due to an increase in the cosmic ray rate from an increased supernova rate. We also find a difference in the ratio between NGC 4038 and NGC 4039 (). This difference seems unlikely to be due to an increased supernova rate; a hidden AGN in NGC 4039 could be an additional source of cosmic rays. However, few studies have shown any evidence of a hidden AGN, and so its existence remains speculative.
We thank the referee for comments which substantially improved the discussion and analysis. This paper makes use of the following ALMA data: ADS/JAO.ALMA#2012.1.00185.S. ALMA is a partnership of ESO (representing its member states), NSF (USA) and NINS (Japan), together with NRC (Canada), NSC and ASIAA (Taiwan), and KASI (Republic of Korea), in cooperation with the Republic of Chile. The Joint ALMA Observatory is operated by ESO, AUI/NRAO and NAOJ. The National Radio Astronomy Observatory is a facility of the National Science Foundation operated under cooperative agreement by Associated Universities, Inc. The research of C.D.W. is supported by NSERC Canada. This research made use of the python plotting package matplotlib (Hunter, 2007). This research made use of APLpy, an open-source plotting package for Python hosted at http://aplpy.github.com.
References
- Baan et al. (2008) Baan W. A., Henkel C., Loenen A. F., Baudry A., Wiklind T., 2008, A&A, 477, 747
- Bigiel et al. (2015) Bigiel F., Leroy A. K., Blitz L., Bolatto A. D., da Cunha E., Rosolowsky E., Sandstrom K., Usero A., 2015, ApJ, 815, 103
- Brandl et al. (2009) Brandl B. R. et al., 2009, ApJ, 699, 1982
- Calzetti et al. (2010) Calzetti D. et al., 2010, ApJ, 714, 1256
- Clements et al. (1996) Clements D. L., Sutherland W. J., McMahon R. G., Saunders W., 1996, MNRAS, 279, 477
- Gao et al. (2001) Gao Y., Lo K. Y., Lee S.-W., Lee T.-H., 2001, ApJ, 548, 172
- Gao & Solomon (2004a) Gao Y., Solomon P. M., 2004a, ApJS, 152, 63
- Gao & Solomon (2004b) Gao Y., Solomon P. M., 2004b, ApJ, 606, 271
- García-Burillo et al. (2012) García-Burillo S., Usero A., Alonso-Herrero A., Graciá-Carpio J., Pereira-Santaella M., Colina L., Planesas P., Arribas S., 2012, A&A, 539, A8
- Graciá-Carpio et al. (2006) Graciá-Carpio J., García-Burillo S., Planesas P., Colina L., 2006, ApJ, 640, L135
- Helfer & Blitz (1997a) Helfer T. T., Blitz L., 1997a, ApJ, 478, 233
- Helfer & Blitz (1997b) Helfer T. T., Blitz L., 1997b, ApJ, 478, 162
- Herrera et al. (2012) Herrera C. N., Boulanger F., Nesvadba N. P. H., Falgarone E., 2012, A&A, 538, L9
- Hopkins et al. (2006) Hopkins P. F., Hernquist L., Cox T. J., Di Matteo T., Robertson B., Springel V., 2006, ApJS, 163, 1
- Hunter (2007) Hunter J. D., 2007, Computing In Science & Engineering, 9, 90
- Johnson et al. (2015) Johnson K. E., Leroy A. K., Indebetouw R., Brogan C. L., Whitmore B. C., Hibbard J., Sheth K., Evans A. S., 2015, ApJ, 806, 35
- Juneau et al. (2009) Juneau S., Narayanan D. T., Moustakas J., Shirley Y. L., Bussmann R. S., Kennicutt, Jr. R. C., Vanden Bout P. A., 2009, ApJ, 707, 1217
- Kazandjian et al. (2012) Kazandjian M. V., Meijerink R., Pelupessy I., Israel F. P., Spaans M., 2012, A&A, 542, A65
- Kazandjian et al. (2015) Kazandjian M. V., Meijerink R., Pelupessy I., Israel F. P., Spaans M., 2015, A&A, 574, A127
- Klaas et al. (2010) Klaas U., Nielbock M., Haas M., Krause O., Schreiber J., 2010, A&A, 518, L44
- Lintott & Viti (2006) Lintott C., Viti S., 2006, ApJ, 646, L37
- Liu & Gao (2010) Liu F., Gao Y., 2010, ApJ, 713, 524
- Loenen, Baan & Spaans (2007) Loenen A. F., Baan W. A., Spaans M., 2007, in IAU Symposium, Vol. 242, IAU Symposium, Chapman J. M., Baan W. A., eds., pp. 462–466
- Loenen et al. (2008) Loenen A. F., Spaans M., Baan W. A., Meijerink R., 2008, A&A, 488, L5
- McCall et al. (2003) McCall B. J. et al., 2003, Nature, 422, 500
- Meijerink et al. (2011) Meijerink R., Spaans M., Loenen A. F., van der Werf P. P., 2011, A&A, 525, A119
- Neff & Ulvestad (2000) Neff S. G., Ulvestad J. S., 2000, AJ, 120, 670
- Papadopoulos (2007) Papadopoulos P. P., 2007, ApJ, 656, 792
- Pety et al. (2013) Pety J. et al., 2013, ApJ, 779, 43
- Pierre Auger Collaboration et al. (2007) Pierre Auger Collaboration et al., 2007, Science, 318, 938
- Röllig et al. (2007) Röllig M. et al., 2007, A&A, 467, 187
- Rosolowsky & Leroy (2006) Rosolowsky E., Leroy A., 2006, PASP, 118, 590
- Sakamoto et al. (2010) Sakamoto K., Aalto S., Evans A. S., Wiedner M. C., Wilner D. J., 2010, ApJ, 725, L228
- Sanders & Mirabel (1996) Sanders D. B., Mirabel I. F., 1996, ARA&A, 34, 749
- Sanders et al. (1988) Sanders D. B., Soifer B. T., Elias J. H., Madore B. F., Matthews K., Neugebauer G., Scoville N. Z., 1988, ApJ, 325, 74
- Schilke et al. (1992) Schilke P., Walmsley C. M., Pineau Des Forets G., Roueff E., Flower D. R., Guilloteau S., 1992, A&A, 256, 595
- Schirm et al. (2014) Schirm M. R. P. et al., 2014, ApJ, 781, 101
- Schulz et al. (2007) Schulz A., Henkel C., Muders D., Mao R. Q., Röllig M., Mauersberger R., 2007, A&A, 466, 467
- Schweizer et al. (2008) Schweizer F. et al., 2008, AJ, 136, 1482
- Stanford et al. (1990) Stanford S. A., Sargent A. I., Sanders D. B., Scoville N. Z., 1990, ApJ, 349, 492
- Steinmetz & Navarro (2002) Steinmetz M., Navarro J. F., 2002, New A, 7, 155
- Talbi, Ellinger & Herbst (1996) Talbi D., Ellinger Y., Herbst E., 1996, A&A, 314, 688
- Ueda et al. (2012) Ueda J. et al., 2012, ApJ, 745, 65
- Usero et al. (2015) Usero A. et al., 2015, AJ, 150, 115
- Wang et al. (2004) Wang Z. et al., 2004, ApJS, 154, 193
- Whitmore et al. (2014) Whitmore B. C. et al., 2014, ApJ, 795, 156
- Whitmore et al. (2010) Whitmore B. C. et al., 2010, AJ, 140, 75
- Whitmore et al. (1999) Whitmore B. C., Zhang Q., Leitherer C., Fall S. M., Schweizer F., Miller B. W., 1999, AJ, 118, 1551
- Williams, de Geus & Blitz (1994) Williams J. P., de Geus E. J., Blitz L., 1994, ApJ, 428, 693
- Wilson et al. (2008) Wilson C. D. et al., 2008, ApJS, 178, 189
- Wilson et al. (2000) Wilson C. D., Scoville N., Madden S. C., Charmandaris V., 2000, ApJ, 542, 120
- Wilson et al. (2003) Wilson C. D., Scoville N., Madden S. C., Charmandaris V., 2003, ApJ, 599, 1049
- Wu et al. (2005a) Wu H., Cao C., Hao C.-N., Liu F.-S., Wang J.-L., Xia X.-Y., Deng Z.-G., Young C. K.-S., 2005a, ApJ, 632, L79
- Wu et al. (2005b) Wu J., Evans, II N. J., Gao Y., Solomon P. M., Shirley Y. L., Vanden Bout P. A., 2005b, ApJ, 635, L173
- Zhang, Gao & Kong (2010) Zhang H.-X., Gao Y., Kong X., 2010, MNRAS, 401, 1839