How to separate the low amplitudeδ Scuti variation from the instrumental ones in CoRoT data?
Abstract
Rich regular frequency patterns were found in the Fourier spectra of low-amplitude Scuti stars observed by CoRoT satellite (see Paparó et al. 2016a,b). The CoRoT observations are, however, influenced by the disturbing effect of the South Atlantic Anomaly. The effect is marginal for high amplitude variable stars but it could be critical in the case of low amplitude variables, especially if the frequency range of the intrinsic variation overlaps the interval of the instrumental frequencies. Some tests were carried out both on synthetic and real data for distinguishing technical and stars’ frequencies.
keywords:
methods: data analysis, stars: variables: delta Scuti, techniques: photometric1 Introduction
The photometic space telescope CoRoT (Baglin et al., 2006) moves on a polar low Earth orbit with an orbital period of 1 hour 43 minutes. The orbital plane is fixed with respect to the center of the Earth so (due to the rotation of the Earth) the satellite flies for each circulation above different geographical lenghts. This orbital property causes that the satellite passes regularly through the South Atlantic Anomaly (SAA). The SAA is an area where the Earth’s inner Van Allen zone comes closest to the surface. It leads to an increased flux of energetic particles what makes the CCD images to be noisy. The CoRoT satellite observated continousely even in the SAA as well, but the data pipeline signed these data points by a non-zero flag. If we use data points with zero flag only we get of the noisy data but we lose the continuous sampling which causes alias frequencies in the Fourier spectra. The alias structure needs careful study before we search for regular spacing in the frequency lists of CoRoT Scuti stars.
2 Tests
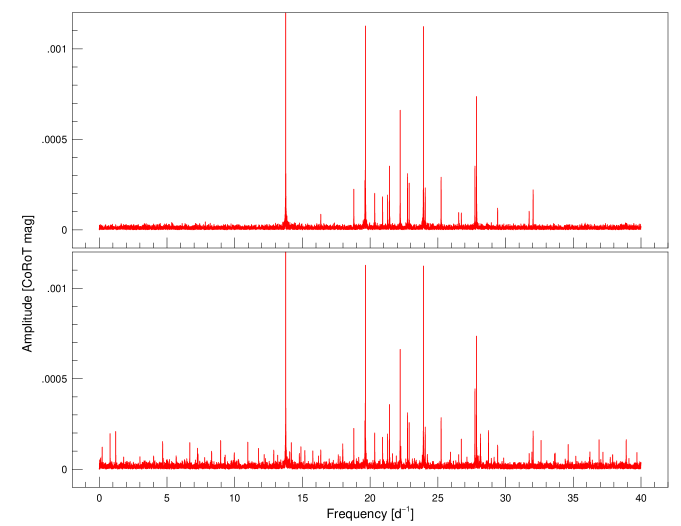
All statement here respect to EXO field stars in the 2nd CoRoT long run field located in the Galactic anticenter direction (LRa2) (see for the specifications Auvergne et al. 2009). We prepared an artificial light curve from 22 frequencies taken from the highest amplitude frequencies of a CoRoT Scuti star (CoRoT 102637079). The amplitudes were set to be identical with the observed ones and Gaussian noise ( mag) was also added to the sythetic light curve. (This noise level is typical for a 11-13 mag star in the EXO field.) The light curve was sampled with the CoRoT sampling time (1) either uniformly or (2) in those data points where CoRoT pipeline yields 0 flag (viz. without any technical problems). The Fourier spectra of these two synthetic time series are given in Fig. 1.
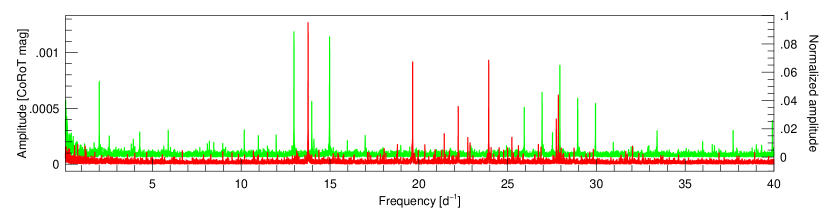
The equidistantly sampled data has clear spectrum, that is no other peaks then the originally set 22 ones (top panel in Fig. 1). While the spectrum of flag 0 data shows many low amplitude alias peaks caused by the non-uniform data sampling (bottom panel in Fig. 1). The alias phenomenon is well-known for ground-based data where daily and yearly (seasonal) alias frequencies are the most frequent. The spectral window function of flag 0 point of the CoRoT data (green spectrum in Fig. 2) contains frequencies at , where d-1 (sidereal-day frequency), d-1(orbital frequency), and are integers. The amplitude of a given alias frequency is varied form star to star but Fig. 2 shows a typical situation: the highest peak amongst the sideral-day harmonic frequencies is the 2 d-1. The largest order detectable harmonic is generally the 4th or the 5th one. The orbital frequency amplitude is lower than the amplitude of its first harmonic. The amplitudes of the linear combination frequencies are higher than the amplitude of the orbital frequency .
The common pre-whitening processes produce further technical frequencies and increasing noise level (Balona, 2014), however, due to the many above mentioned aliases, a pre-whitening method is essential for handling these data. We used SigSpec program (Reegen, 2007) for consecutive pre-whitening process. The SigSpec algorithm with its default spectral significance limit () resulted in the 22 input frequencies for both artificial data sets. Both the residual spectra indicate no significant peaks above the 0.01 mmag average (noise) level after the pre-whitening process. These results are consonant with Balona (2014) diagnose, namely that the higher amplitude frequencies are less affected by the faults of pre-whitening process. In the same time we found that all of the used input frequencies can be considered as ‘higher amplitude frequency’ though they amplitudes are between 1.5 and 0.1 mmag.
The red line in Fig. 2 shows the spectrum of CoRoT 102637079. This spectrum is very similar to the synthetic one (in the bottom panel of Fig. 1) which is evident because it was generated on the basis of the highest amplitude frequencies of the real star. More instructive is how heavily overlaps the real star’s frequency range with the location of the peaks of the spectral window. Despite the previous positive test result this warns for caution. The observed data have additional biases from the sythetic case. The flag 0 data might be still encumbered by the influence of the SAA. The strength of this influence differs from star to star. According to our experiences the alias structure can not be removed totally by a consecutive pre-whitening process. The probable reason is that the proximity of the SAA causes some flux variations (an increase before the SAA and a decrease after that) which have different time lengths and amplitudes for each passing through.
Our conclusion is that the higher amplitude peaks of the Fourier spectra can be easily separated from the instrumental ones. Attention has to pay to the increasing noise level is due to many-steps pre-whitening processes (Balona, 2014). Any well-established study can be accepted only for the higher amplitude peaks. They should be referred as intrinsic frequencies of the star. Although, beacuse of the increased noise level, we may miss some of the low amplitude intrinsic frequencies. When we found regular pattern using the high amplitude frequencies we may extend the pattern with lower amplitude frequencies. This basic idea – using only the highest amplitude peaks – was applied in Paparó et al. (2013) that in our new investigation on a larger sample of CoRoT Scuti stars we extended the regular patterns with lower amplitude frequencies, too. The results and the details of the analysis will be published soon elsewhere (Paparó et al. 2016a, b).
This work was partially supported by the ESA PECS Grant No 4000103541/11/NL/KM.
References
- Auvergne et al. (2009) Auvergne, M., Bodin, P., Boisnard, L. et al. 2009, A&A, 506, 411
- Baglin et al. (2006) Baglin, A., Auvergne, M., Boisnard, L., et al. 2006, in COSPAR Meeting, Vol. 36, 36th COSPAR Scientific Assembly, 3749
- Balona (2014) Balona, L. 2014, MNRAS, 439, 3453
- Paparó et al. (2013) Paparó, M., Bognár, Zs., Benkő, J.M., Gandolfi, D., Moya, A., et al. 2013, A&A, 557, A27
- Paparó et al. (2016a) Paparó, M., Benkő, J.M., Hareter, M., Guzik, J.A., 2016a, ApJ (accepted), astro-ph:1603.02050
- Paparó et al. (2016b) Paparó, M., Benkő, J.M., Hareter, M., Guzik, J.A., 2016b, ApJS (accepted), astro-ph:1603.09161
- Reegen (2007) Reegen, P. 2007, A&A, 467, 1353